
Paper:
Deep Learning-Based Morphological Analysis for Identifying Culture Status and Contractile Motion in Skeletal Muscle Tissues
Yudai Kizure, Daiki Miyashita, and Yuya Morimoto

Faculty of Science and Engineering, Waseda University
3-4-1 Okubo, Shinjuku-ku, Tokyo 169-8555, Japan

This study investigates a deep learning-based framework that uses static microscopic images to identify culture status and contractile motion in cultured skeletal muscle tissues. Noninvasive functional evaluation is important for advancements in tissue engineering and biohybrid robotics. However, acquiring large-scale labeled datasets is often difficult owing to the time-consuming nature of functional measurements. To explore the feasibility of image-based evaluation under the data constraints, we implemented a structured image processing and validation pipeline. First, tissue regions were isolated using U2-Net, achieving a Dice coefficient of 0.984 to reduce background interference. Second, an ensemble learning strategy was examined via a culture-day identification task using 528 images. A soft-voting ensemble of convolutional neural networks achieved a Macro F1-score of 0.817, indicating that morphological features associated with culture progression could be effectively captured. Additionally, self-supervised pre-training via SimSiam was tested to extract domain-specific representations from unlabeled images. For contractile motion identification, the ImageNet-pre-trained EfficientNetV2-S paired with a random forest classifier attained an accuracy and F1-score of 75.0% and 0.800, respectively. These results suggest that functional properties of cultured tissues can be partially inferred from static morphological characteristics. While the limited size of the dataset and low identification confidence pose challenges, this study provides a baseline methodology for noninvasive, image-based cellular sensing in engineered biological systems.
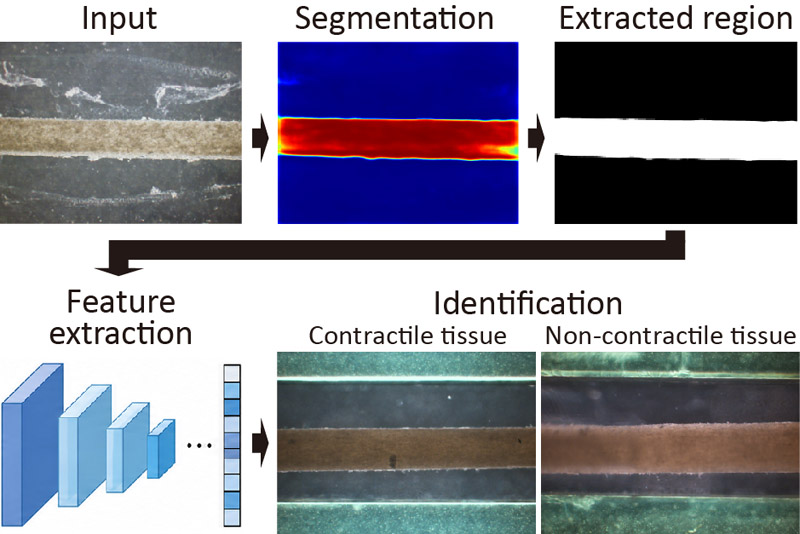
Image-based muscle tissue analysis
1. Introduction
Research on the engineering and utilization of cultured tissues has advanced significantly in recent years 1,2. For example, tissues are being explored as sustainable alternatives to livestock products 3,4 and the development of biohybrid systems powered by the functions of cultured tissues combined with artificial devices has progressed 5,6. In particular, cultured skeletal muscle tissues have attracted substantial attention because of their versatility; they serve as cultured meat from an agricultural perspective 7,8 and as contractile actuators from an engineering perspective 9,10,11. In these applications, evaluating whether cultured muscle tissues have sufficiently matured to perform their intended functions is critical. Analysis of contractile motion is one of the primary methods for the functional assessment of cultured skeletal muscle tissues 12,13. Evaluating contractile motion typically requires specialized equipment, such as electrical stimulation devices and displacement measurement setups, which involve significant time and cost. To address these issues, estimating tissue states and functions directly from microscopic images may provide a supplementary, noninvasive, and simplified quality evaluation approach.
Deep learning-based image analysis has been widely used in medical and cellular imaging to estimate cellular states and differentiation stages 14,15,16. Conventional studies have successfully estimated cellular traction forces from images by learning the relationship between morphological features and biological functions 17,18, thereby demonstrating the effectiveness of deep learning approaches. In addition, technologies for embedding sensors into biological tissues or cells to acquire biological signals in real-time and transmit them externally have been recently investigated 19,20,21. These technologies are expected to enable continuous monitoring of tissue states and functions in tissue engineering and biohybrid systems. In this context, techniques that estimate tissue function from noninvasive observational data, such as microscopic images, can serve as complementary evaluation methods for sensor-based measurements. However, the application of deep learning-based image analysis to cultured skeletal muscle tissues remains limited. A major challenge in the tasks is the difficulty of preparing large amounts of labeled datasets, particularly data annotated with contractile motion, as the construction of cultured tissues is both time-consuming and resource-intensive. Consequently, it is necessary to investigate methods capable of extracting potentially effective feature representations and providing stable classification under limited data conditions.
In this study, we propose an image analysis framework to examine the possibility of identifying the culture status and contractile motion of cultured skeletal muscle tissues from microscopic images. Our approach utilizes tissue-region segmentation as a preprocessing step and evaluates the potential of self-supervised pre-training and ensemble learning to mitigate stability issues under limited-data conditions. Here, we evaluate the possibility of using image-based classification to distinguish differences in culture states, apply the proposed approach to identify contractile motion, and discuss its feasibility and current limitations as a noninvasive functional assessment tool.
2. Materials and Methods
2.1. Cell Preparation
C2C12 cells (murine myoblasts) were maintained in a growth medium (GM) comprising Dulbecco’s modified Eagle’s medium high glucose (DMEM; Sigma-Aldrich) supplemented with 10% fetal bovine serum (FBS; Biowest) and 1% penicillin-streptomycin (P/S; Sigma-Aldrich). The cells were incubated at 37°C with 5% CO\(_2\). The medium was replaced every two days, and the cells were passaged with trypsin-EDTA (Sigma-Aldrich) upon reaching approximately 80% confluence.
2.2. Formation of Cultured Skeletal Muscle Tissue
Skeletal muscle tissues were fabricated by modifying previously reported methods 9,22. The culture device comprised a polydimethylsiloxane (PDMS) chamber with longitudinal grooves and anchors at both ends to secure the cultured skeletal muscle tissue. The molds for the chambers and anchors were fabricated using 3D printers (Form 3B\(\texttt{+}\), Formlabs; Mars 5 Ultra 9K, Elegoo; Shape1\(+\)HD, Rayshape) with biocompatible or heat-resistant resins (BioMed Clear, Formlabs; Rigid20, Rayshape). The printed parts were coated with a 2-μm-thick layer of parylene using a chemical vapor deposition system (Parylene Deposition System 2010, Specialty Coating Systems). To fabricate the chamber, a PDMS elastomer and curing agent (Sylgard 184, Dow Corning Toray) were mixed in a \(10:1\) ratio, poured into the molds, and cured at 75°C for 90 min. After release from the mold, the PDMS chamber was obtained. Before use, all the components were sterilized using an ozone/UV sterilizer (CoolCLAVE Blue, Gelantis). To prevent nonspecific tissue adhesion, the groove surfaces were coated with 0.5 wt% 2-methacryloyloxyethyl phosphorylcholine polymer (Lipidure-CM5206, NOF Corporation) in ethanol, heat-treated at 65°C–75°C for 90 min, and subsequently coated with 1 wt% bovine serum albumin (BSA; Sigma-Aldrich). Conversely, the anchors were coated with a 100 μg/mL fibronectin (Sigma-Aldrich) solution in phosphate buffered saline and incubated overnight at 37°C to promote tissue attachment.
For tissue formation, a cell-gel mixture consisting of Matrigel (356231, Corning), GM, fibrinogen (Sigma-Aldrich), thrombin (Sigma-Aldrich), and C2C12 cells (final concentration: 1.5 \(\times\) 10\(^7\) cells/mL) was dispensed into the chamber grooves and around the anchors. After casting, the culture device was incubated at 37°C for 30 min to induce gelation of the cell-gel mixture, followed by the addition of GM supplemented with 1 mg/mL 6-aminocaproic acid (ACA; Sigma-Aldrich). After 1–2 days of culture, the tissues were gently detached from the chamber walls using tweezers. On day 2 of culture, the medium was switched to differentiation medium comprising low-glucose DMEM (Sigma-Aldrich), 2% horse serum (Thermo Fisher Scientific), 1% P/S, and 1 mg/mL ACA. The medium was refreshed every two days throughout the culture period.
2.3. Testing Contractile Motion
On day 9 of culture, contractile motion was evaluated using electrical stimulation. Electrical pulses (1 Hz) were applied to the tissues through gold electrodes using a function generator (WF1947, NF Corporation) and a bipolar amplifier (HSA42011, NF Corporation). During electrical stimulation, tissue motion was recorded using an inverted microscope (IX73, Olympus), and contractile displacement was quantitatively analyzed using motion tracking software (VM-9000, Keyence Corporation). For each sample, the stimulation-synchronized response amplitude was quantified as the peak-to-peak displacement within a fixed response window, and the background noise level was estimated as the standard deviation of the displacement during intervals without stimulation-synchronized responses. In this analysis, a displacement exceeding 20 times the background noise level was used as a quantitative reference for clearly distinguishable contractile motion. The samples labeled as contractile exhibited response amplitudes above this reference level, whereas those labeled as noncontractile showed displacements comparable to the background noise level and no detectable contractile motion.
2.4. Preprocessing of Deep Learning-Based Image Analysis System
Microscopic images of C2C12-based skeletal muscle tissues acquired in a previous study 22 were used to develop a deep learning-based image analysis system. These images were captured once daily using a microscope (IX71N, Olympus) from culture days 1 to 5 (Fig. 1) and utilized for segmentation training, ensemble strategy evaluation, and self-supervised pre-training validation.
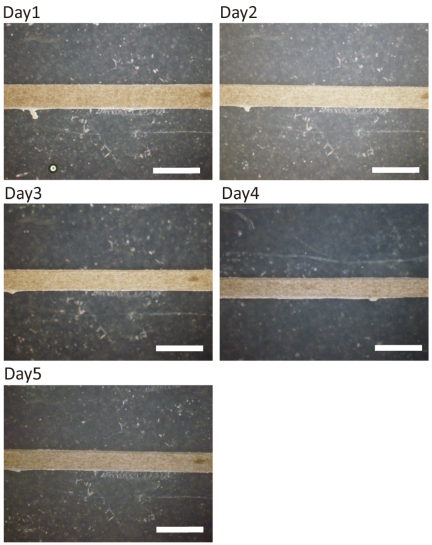
Fig. 1. Typical samples from the dataset categorized by culture day. The scale bars are 1 mm.
To automatically isolate tissue regions, the U\(^2\)-Net model 23 was employed for tissue segmentation. The training data consisted of 100 images with the ground-truth masks manually annotated using ImageJ, while an additional 20 images were used for validation. All the images were resized to 256 pixels \(\times\) 256 pixels. To compensate for this limited dataset, data augmentation was applied, including horizontal and vertical flipping, random affine transformations (shifts, scaling, and rotations), elastic deformation, grid distortion, brightness and contrast adjustments, and Gaussian blurring.
Binary cross-entropy loss was utilized as the objective function, calculated for each of the multiple-side outputs produced by U\(^2\)-Net, and summed as the final loss. The segmentation performance was evaluated using the Dice similarity coefficient. Optimization was performed via the Adam optimizer with an initial learning rate of \(1\times 10^{-4}\), which was reduced using a ReduceLROnPlateau scheduler (patience \(=5\) epochs). The model was trained for 100 epochs with a batch size of 8. For post-processing, the generated probability maps were binarized, and only the largest connected component was retained to remove small noisy regions. Morphological operations were applied to smooth the boundaries and fill small holes in the segmented regions. After these automated post-processing steps, minor manual refinements were performed only in a small minority of images, roughly on the order of 10%, mainly when anchor regions were partially included in the final segmented masks. These refinements only corrected obvious non-tissue regions, leaving the class labels or downstream classification criteria unaltered.
| Culture status | Number of images | Percentage [%] |
| Day 1 | 122 | 23.1 |
| Day 2 | 121 | 22.9 |
| Day 3 | 94 | 17.8 |
| Day 4 | 94 | 17.8 |
| Day 5 | 97 | 18.4 |
| Total | 528 | 100.0 |
2.5. Validation of Ensemble Learning Using Culture-Day Identification
Microscopic images from the existing dataset were processed using U\(^2\)-Net for tissue-region extraction and categorized into five classes (day 1 to day 5), reflecting the morphological status, such as tissue compaction and alignment of myotubes. The sample distribution across these classes revealed inherent class imbalances (Table 1), particularly for days 3 and 4, which contained fewer samples than the other stages. To classify these stages, we implemented a soft-voting ensemble comprising three heterogeneous convolutional neural network (CNN) architectures: ConvNeXt-S 24, EfficientNetV2-S 25, and DenseNet201 26. With the input images resized to 384 pixels \(\times\) 384 pixels, each model was initialized using ImageNet-pre-trained weights and modified with a five-class output layer. These architectures were selected to capture complementary representations based on distinct design principles.
To account for the ordinal nature of culture progression, a hybrid loss function combining soft labels for ordinal regression (SORD)-based KL divergence 27 and Focal Loss 28 was implemented. SORD penalizes distant misclassifications more heavily by generating Gaussian-distributed soft labels (\(\sigma=0.35\)) centered on the ground-truth class. Focal Loss (\(\gamma=2.5\)) was incorporated to prioritize difficult samples by down-weighting the loss from well-classified examples. The final training loss was defined as the weighted sum of these two components, with a 0.7 weight assigned to the SORD-based KL divergence to emphasize the ordinal structure while maintaining the ability to identify the exact ground-truth class through the Focal Loss. Class-specific weights were applied to mitigate the dataset imbalance: day 1 (1.0), day 2 (1.15), day 3 (1.6), day 4 (1.25), and day 5 (1.5). These weights were strategically assigned based on sample size and morphological ambiguity during the intermediate maturation stages to reinforce learning for classes with the highest anticipated difficulty.
For generalization, several data augmentation techniques were employed: random horizontal and vertical flipping with a 50% probability, RandAugment 29 configured to select two operations with a magnitude of 9, and random erasing 30 with 2%–33% of the image area with a 50% probability. For image mixing, MixUp (\(\alpha=0.4\)) 31 and CutMix (\(\alpha=1.0\)) 32 were applied with a combined 50% probability, with each method selected equally. Additionally, test-time augmentation (TTA) 33 was utilized during inference by averaging the classification outputs across original, flipped, and rotated versions of the images.
Optimization was performed using the AdamW optimizer 34 with an initial learning rate of \(7\times 10^{-5}\) and a weight decay of \(1\times 10^{-5}\). A cosine annealing with warmup schedule 35 was applied, where the learning rate was linearly increased from \(1\times 10^{-6}\) up to the initial set value over the first five epochs, followed by a cosine decay back to \(1\times 10^{-6}\) over the remaining epochs. The batch size was set to 16, and early stopping was triggered after 20 epochs, with no improvement in the Macro F1-score. To ensure reproducibility, the random seed was fixed at 42.
A soft-voting ensemble integrated the output probabilities from the three models via a weighted average, with the optimal weights determined by a grid search (step size \(=0.05\)). Evaluation was performed using stratified five-fold cross-validation, and performance was assessed using the Macro F1-score, class-wise F1-scores, and confusion matrix analysis using aggregated out-of-fold classification results (\(n =528\)).
2.6. Self-Supervised Pre-Training Using SimSiam
To compensate for the scarcity of labeled contractile motion data, self-supervised pre-training was conducted using 528 unlabeled culture images preprocessed with U\(^2\)-Net using the SimSiam (Simple Siamese) framework 36. This method learns the domain-specific morphological features by maximizing the similarity between two augmented views of the same image. A stop-gradient operation was employed to prevent the representation collapse without requiring negative samples. EfficientNetV2-S, initialized with ImageNet-pre-trained weights, served as the encoder with input images resized to 256 pixels \(\times\) 256 pixels. The projection and prediction heads were implemented as multilayer perceptrons with an output dimension of 2048, which were specifically configured with three and two layers, respectively. Data augmentation included randomly resized cropping, flipping, 90° rotations, affine transformations (shift, scale), and brightness/contrast adjustments. Optimization was performed using stochastic gradient descent (momentum \(=0.9\), weight decay \(=1\times 10^{-4}\)) with a batch size of 32 for 100 epochs. A cosine decay learning rate schedule was applied, starting at an initial rate of 0.03 after 10 epochs of linear warmup. The resulting pre-trained encoder was utilized as the initial model for the subsequent contractile motion identification task, which was defined as the binary classification of tissues with or without detectable contractile motion under electrical stimulation.
2.7. Identification of Contractile Motion
The presence of contractile motion was evaluated using electrical stimulation and microscopic observations. A dataset of 43 images, comprising 23 positive samples (with contractions) and 20 negative samples (without contractions) was constructed (Fig. 2). The images were preprocessed using the U\(^2\)-Net model to isolate the tissue regions, focusing on the morphological features of the tissue. The task was formulated as a binary classification problem: Class 1 (presence of contractions) and Class 0 (absence of contractions).
To mitigate overfitting risks with small datasets, pre-trained CNNs were employed as fixed-feature extractors rather than being trained end-to-end. Three architectures were evaluated as feature extractors: ConvNeXt-S (input: 384 pixels \(\times\) 384 pixels, 768-dimensional vector), EfficientNetV2-S (input: 384 pixels \(\times\) 384 pixels, output: 1280-dimensional vector), and DenseNet201 (input: 224 pixels \(\times\) 224 pixels, output: 1920-dimensional vector). The feature vectors were obtained via global average pooling 37 after ImageNet normalization. Beyond single models, an ensemble representation was constructed by concatenating the feature vectors from all three architectures, resulting in a 3968-dimensional feature set that captured complementary morphological traits. Additionally, the SimSiam-pre-trained encoder using unlabeled skeletal muscle tissue images was evaluated to determine the efficacy of domain-specific versus ImageNet-based features.
Several classifiers were evaluated, including logistic regression (\(L_1\) and \(L_2\) regularization), support vector machines (linear and RBF kernels), random forest, and gradient boosting. The feature vectors were standardized to zero mean and unit variance before classification. Data diversity was enhanced by applying augmentations including horizontal or vertical flipping, 90° rotations, affine transformations, and brightness adjustments alongside TTA during inference. The dataset was split into 35 training and 8 test samples. Stratified k-fold cross-validation was performed on the training set to identify the optimal classifier and extractor combination, which was retrained on the full training set and evaluated on the held-out test set using the accuracy and F1-score. To ensure statistical robustness given the limited dataset, we evaluated the performance using the average accuracy across 100 independent trials.
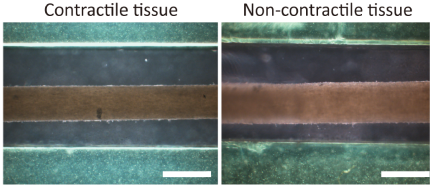
Fig. 2. Representative samples from the dataset categorized by the presence or absence of contractile motion. The scale bars are 1 mm.
2.8. Computational Environment
All models and algorithms were implemented using Python 3.12. Deep-learning models, including U\(^2\)-Net for segmentation and CNN-based feature extractors, were developed using PyTorch. Standard machine learning classifiers such as support vector machines and random forests were implemented using the scikit-learn library. The experiments were conducted on the Google Colab platform using NVIDIA GPU accelerators (e.g., Tesla L4 or A100) to ensure efficient processing and model training.
3. Results and Discussion
3.1. Segmentation Performance of U\(^{\boldsymbol{2}}\)-Net
To ensure that the subsequent feature extraction focused exclusively on biological information, a tissue region extraction model was trained using U\(^2\)-Net for 100 epochs. As shown in the loss curves (Fig. 3(a)), both training and validation losses decreased steadily and converged after approximately 50 epochs. The model from epoch 98, which achieved the minimum validation loss of 0.116, was selected as the final model. The optimized model generated high-fidelity probability maps, achieving a Dice coefficient of 0.984 and demonstrating high accuracy in isolating tissue regions.
To evaluate the practical performance of the trained model, the extraction results were visualized using a multi-step refinement process. By applying threshold-based binarization, largest-connected-component extraction, and morphological smoothing to the probability maps generated by U\(^2\)-Net, the tissue regions were precisely isolated (Fig. 3(b)). This visualization confirmed the effective removal of background artifacts, such as the grooves of the culture chamber and anchor connection points, while preserving the tissue structure. The generated masks were applied to the original images to isolate the tissue regions, thereby ensuring that subsequent learning solely utilized morphological features. Furthermore, this automated system improved both efficiency and consistency in data preparation. While manual masking required approximately 5 min per image and displayed subjective variability in defining tissue boundaries, the U\(^2\)-Net-based approach ensured objective and uniform segmentation across all samples. This automated pipeline processed 432 new images, thereby drastically reducing manual labor. In cases where anchor regions were partially misidentified, minor manual refinements were performed to ensure mask quality.
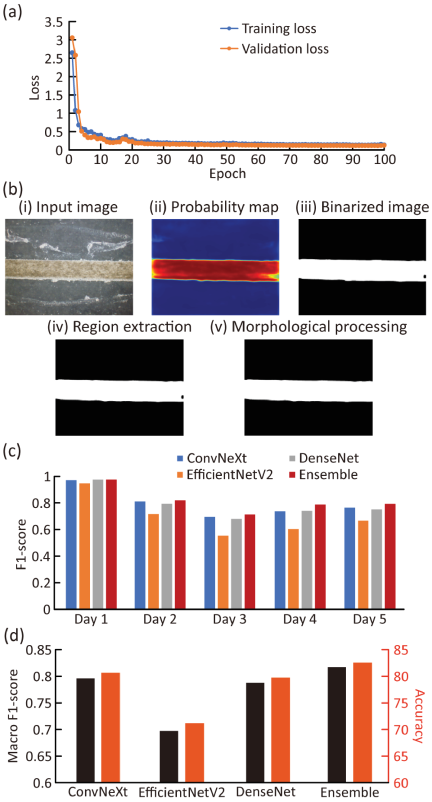
Fig. 3. Evaluation of the culture-day identification framework. (a) Training and validation loss curves (binary cross-entropy) for the U\(^2\)-Net segmentation model. (b) Sequential workflow of tissue-region segmentation. (c) F1-scores of individual models and the soft-voting ensemble across different culture days. (d) Performance comparison of individual models and the ensemble for culture-day identification.
3.2. Ensemble Learning via Culture-Day Identification
To evaluate the effectiveness of the proposed ensemble framework, a validation task was conducted using 528 masked images categorized into five classes depending on the culture day (days 1 to 5). Before ensemble analysis, the performances of three individual architectures, ConvNeXt-S, EfficientNetV2-S, and DenseNet201, were evaluated. A consistent trend across all models was that the highest F1-scores were achieved for day 1, while the lowest were recorded for day 3 (Fig. 3(c)). On day 1, all models exceeded an F1-score of approximately 0.95, reflecting the distinct morphological characteristics at the early stages of culture. Conversely, the F1-scores for day 3 were significantly lower (0.553–0.696), likely due to morphological overlap with consecutive culture days, as well as the limited number of training samples noted in the dataset distribution. Among the individual models, ConvNeXt achieved the best overall performance with a Macro F1-score of 0.796 (Fig. 3(d)).
| Note | Combination ratio | Macro F1-score | ||
| Conv NeXt | EfficientNetV2 | DenseNet | ||
| Optimal | 0.35 | 0.35 | 0.30 | 0.817 |
| Optimal w/o EffV2 | 0.45 | 0.00 | 0.55 | 0.815 |
| Optimal w/o Dense | 0.90 | 0.10 | 0.00 | 0.802 |
| Optimal w/o Conv | 0.00 | 0.15 | 0.85 | 0.798 |
| I-Day 1 | I-Day 2 | I-Day 3 | I-Day 4 | I-Day 5 | Accuracy | |
| A-Day 1 | 119 | 2 | 1 | 0 | 0 | 97.5% |
| A-Day 2 | 2 | 102 | 16 | 1 | 0 | 84.3% |
| A-Day 3 | 1 | 18 | 67 | 4 | 4 | 71.3% |
| A-Day 4 | 0 | 4 | 3 | 72 | 15 | 76.6% |
| A-Day 5 | 0 | 2 | 7 | 12 | 76 | 78.4% |
| Overall accuracy | 82.6% |
To determine whether combining diverse architectures could improve the identification stability, a soft-voting ensemble was implemented. The ensemble achieved a Macro F1-score of 0.817 and accuracy of 82.6%, representing improvements of approximately 0.02 and 1.9%, respectively, over the best single model (Fig. 3(d)). Through a grid search (Table 2), the optimal weights were determined to be 0.35 for ConvNeXt, 0.35 for EfficientNetV2, and 0.30 for DenseNet. Notably, although EfficientNetV2 exhibited the lowest individual performance (Macro F1-score \(=0.697\)), it was assigned a weight equal to that of ConvNeXt in the optimal configuration. Ablation analysis showed that excluding ConvNeXt or DenseNet substantially degraded performance (to 0.798 and 0.802, respectively), whereas excluding EfficientNetV2 resulted in a decrease from 0.817 to 0.815. These results suggest that EfficientNetV2 captured complementary image-based morphological representations and distinct misclassification patterns, which enhanced the overall ensemble robustness. Class-wise analysis showed that the ensemble improved the F1-scores across all classes, with the most notable gain on day 4 (from 0.740 to 0.787) (Fig. 3(c)). The confusion matrix revealed that most errors occurred on consecutive days, such as day 2/day 3 (16 and 18 cases) and day 4/day 5 (15 and 12 cases) (Table 3). In comparison, fewer misclassifications were observed between days 3 and 4, suggesting that the morphological changes during this interval were more distinguishable. This may reflect a relatively clearer transition in tissue compaction or overall structural organization around day 4, whereas the boundaries between day 2/day 3 and day 4/day 5 remained more ambiguous. No misclassifications occurred between days 1 and 5, underscoring the clear morphological divergence between the early and late stages.
These results provided two key insights into the proposed system. First, the overall performance gains and optimal weight distributions suggested that heterogeneous architectures captured complementary morphological representations, thereby justifying the soft-voting ensemble approach. These representations may include morphological cues, such as tissue outline, compaction, alignment, and texture patterns associated with myotube-like organization, which are consistent with previously reported structural characteristics of cultured skeletal muscle tissues 22. Second, the concentration of errors between adjacent days (days 2–5) indicated that morphological transitions in the cultured skeletal muscle occurred gradually. These findings validate the efficacy of the proposed feature-extraction framework for the subsequent and more complex task of contractile motion identification.
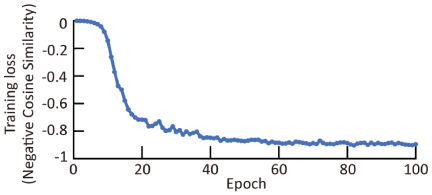
Fig. 4. Convergence of training loss during SimSiam pre-training.
3.3. Effect of SimSiam Pre-Training
To compensate for the scarcity of labeled data for contractile motion identification, self-supervised pre-training via SimSiam was conducted using unlabeled culture images. This process primarily aimed to enable the encoder to capture the domain-specific morphological features of cultured skeletal muscle tissues without manual annotation. A total of 528 masked images preprocessed using U\(^2\)-Net, which contained structural information related to tissue morphology and culture progression and were therefore suitable for self-supervised representation learning, were used for pre-training. The model was pre-trained for 100 epochs, and the transition of the training loss, defined by the negative cosine similarity, rapidly decreased to approximately \(-0.78\) after 25 epochs during the initial phase (Fig. 4). The loss continued to decline gradually, eventually converging to a final value of \(-0.903\) after approximately 75 epochs. The high degree of similarity between the feature vectors of the two differently augmented views indicates that SimSiam-based pre-training successfully enabled the model to learn invariant representations specific to the morphology of skeletal muscle tissues. By using the pre-trained encoder as the initialization for contractile motion identification, more efficient learning was expected, even with a limited amount of labeled data. These results indicate that SimSiam pre-training converged on the unlabeled skeletal muscle tissue image dataset and enabled the model to learn augmentation-invariant representations. The practical usefulness of the learned representations for contractile motion identification was further evaluated via a subsequent classification task.
3.4. Identification of Contractile Motion
A binary classification task was conducted using labeled microscopic images to identify the presence or absence of contractile motion. To determine the most effective model configuration, the performance of various combinations of feature extractors and classifiers was evaluated (Table 4). The best performance was achieved by combining EfficientNetV2-S with a random forest classifier, which yielded an accuracy and F1-score of 75.0% and 0.800, respectively. In contrast, ConvNeXt-S and DenseNet201 achieved an accuracy of only 62.5%. To evaluate the scalability of the methods validated in the preliminary tasks, the effects of feature-level ensembling and self-supervised pre-training were also analyzed. Unlike the culture-day identification task, in which ensembling improved the performance, the concatenated-feature ensemble achieved only 62.5% accuracy in contractile identification. This result suggests that the high dimensionality of the concatenated vector (3968 dimensions) exceeded the capacity of the model to generalize from the limited training samples, thereby increasing the risk of overfitting. Therefore, future work should optimize feature dimensionality through dimensionality reduction or feature selection under cross-validation, rather than directly using the full concatenated feature vector. Furthermore, the impact of domain-specific pre-training was assessed by comparing the SimSiam-pre-trained encoder against ImageNet-pre-trained models. The SimSiam-based features yielded a test accuracy of only 50.0%, which was 25% lower than that of the ImageNet-pre-trained EfficientNetV2-S (Table 4). This result indicates that while SimSiam learned representations from the 528 unlabeled images, these features were less discriminative for contractile motion than the general-purpose features from ImageNet. The limited diversity and scale of the pre-training dataset possibly hindered the acquisition of task-relevant morphological representations. Overall, increased model complexity via high-dimensional ensembling or small-scale self-supervised learning did not consistently improve the performance under the present data constraints, whereas ImageNet-pre-trained features were more robust.
| Feature extractor | Dimension | Optimal classifier | Accuracy | F1-score |
| EffV2 | 1280 | Random forest | 75.0% | 0.800 |
| Dense | 1920 | LogReg (\(L_2\)) | 62.5% | 0.571 |
| Conv | 768 | SVM (RBF) | 62.5% | 0.667 |
|
Ensemble (3 models) |
3968 | SVM (RBF) | 62.5% | 0.667 |
| SimSiam (Pre-trained) | 1280 | LogReg (\(L_2\)) | 50.0% | 0.333 |
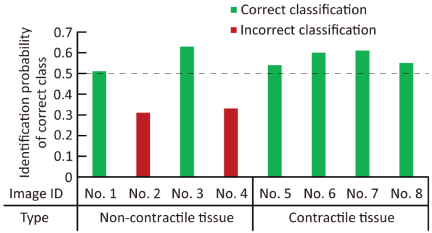
Fig. 5. Model confidence for individual test samples to classify contractile motion. The bars represent the classification confidence, which is defined as the probability assigned to the ground-truth class. For non-contractile samples, the confidence is calculated as \(1 - p\) (contractile). The red bars indicate samples where the confidence was below the 0.5 decision threshold, resulting in incorrect classifications (Images 2 and 4).
| Model | Mean\(\boldsymbol{\pm}\)SD | Min | Max | Median |
| EffV2 | \(55.8{\pm}11.6\)% | 25.0% | 75.0% | 62.5% |
| Conv | \(62.1{\pm}10.5\)% | 37.5% | 87.5% | 62.5% |
To examine the classification robustness of the system, an error analysis was performed on the best-performing model from the initial trial (a combination of EfficientNetV2-S and random forest) (Fig. 5). The model correctly classified six of the eight samples. Although 100% accuracy (4/4) was achieved for tissues with contractile motion, only 50% (2/4) of those without motion were correctly identified. Notably, the output probabilities for the correctly classified samples were clustered near the 0.5 decision threshold, ranging from 0.37 to 0.61. This limited confidence suggests that the model may not yet capture sufficiently distinct morphological markers to robustly separate the two functional states. Although a test accuracy of 75.0% was obtained from this single train–test split, an additional evaluation across 100 independent random splits revealed substantially lower mean accuracies (Table 5). The mean accuracies (\(mean{\pm}SD\), \(n =100\)) for EfficientNetV2-S and ConvNeXt-S were \(55.8{\pm}11.6\)% and \(62.1{\pm}10.5\)%, respectively, indicating considerable variability owing to the extremely limited dataset size. A one-sample \(t\)-test against random chance level (50%) confirmed that both results were statistically significant (EfficientNetV2-S: \(p =2.82\times10^{-6}\); ConvNeXt-S: \(p =7.35\times 10^{-20}\)). Nevertheless, the relatively large standard deviations indicate limited stability across different data splits. In addition to the dataset-related limitation, contractile capability cannot be directly determined from unstained static images alone. Although morphological features such as tissue compaction, cellular alignment, and organized myotube-like structures may be associated with contractile function, they do not confirm the functional contraction of the entire tissue. Thus, the present approach should be regarded as a supplementary, noninvasive screening method rather than a replacement for direct contractility assays. Together, these findings indicate that while functional identification from static morphology is feasible at the proof-of-concept level, larger labeled datasets and direct functional validation are required to improve classification reliability. As a practical target, future studies should collect at least several hundred labeled samples across independent culture batches to improve the classification performance and statistical reliability. In addition, future improvements may be achieved through data expansion, transfer learning, incorporation of temporal information from contraction videos, and a more comprehensive performance evaluation using complementary metrics.
4. Conclusion
This study investigated a deep learning-based framework for identifying culture progression and the presence of contractile motion in cultured skeletal muscle tissues using microscopic images. Several preparatory milestones, including precise tissue-region segmentation via U\(^2\)-Net and validation of the ensemble learning strategy via culture-day identification, were used to establish a systematic framework for isolating tissue regions and analyzing morphological features. The initial validation confirmed that while individual models identified early culture-stage images with high reliability, an ensemble of heterogeneous architectures further enhanced identification stability by capturing complementary morphological representations. By applying tissue segmentation and the feature extraction pipeline to contractile motion identification, we achieved an accuracy of 75.0% using ImageNet-pre-trained EfficientNetV2-S and a random forest classifier. Although performance gains from ensemble learning and SimSiam pre-training were limited in this functional task, primarily because of the extreme scarcity of labeled data, the results underscore the feasibility of functional identification from static images. While these findings are promising, there is significant room for improvement in classification confidence and discriminative power of contractile states. The errors near the decision boundary suggest that the morphological differences between the tissues with and without motion are subtle.
To address these challenges, future research should prioritize the expansion of labeled functional datasets to utilize the full potential of the validated ensemble and self-supervised learning strategies. Furthermore, incorporating temporal sequence analysis throughout the maturation process may provide deeper insight into the morphological precursors of contractile activity. In conclusion, this study provides a foundational methodology for noninvasively evaluating engineered tissues and offers a potential pathway for real-time, label-free monitoring in biohybrid systems and regenerative medicine. Although this study focused on C2C12-derived skeletal muscle tissues, the proposed framework could be adapted to other cultured tissues, cell types, or culture conditions by retraining or fine-tuning the segmentation and classification models with appropriately labeled images. Such adaptability may broaden the applicability of image-based deep learning approaches for noninvasively monitoring cultured tissues.
In addition, the proposed image-based deep-learning framework may be further enhanced by integration with sensing technologies in future engineered tissue and biohybrid systems. Although the present study estimated tissue states from the morphological information in microscopic images, intracellular or tissue-integrated sensors could provide complementary biochemical, mechanical, or electrical signals. Combining these sensor-derived signals with image-based morphological features may facilitate more comprehensive and reliable monitoring of tissue maturation and function. Such a multimodal approach could contribute to the development of noninvasive and data-driven evaluation strategies for cultured skeletal muscle tissues.
Acknowledgments
We thank Prof. Eiji Iwase of Waseda University for allowing us to use the parylene deposition system. This research was partially supported by the Japan Society for the Promotion of Science (JSPS) Grants-in-Aid for Scientific Research (KAKENHI) 24K00855 and JST Fusion Oriented Research for Disruptive Science and Technology JPMJFR222Q.
- [1] Z. Lin, T. Jiang, and J. Shang, “The emerging technology of biohybrid micro-robots: A review,” Bio-Des. Manuf., Vol.5, pp. 107-132, 2022. https://doi.org/10.1007/s42242-021-00135-6
- [2] R. Raman, “Biofabrication of living actuators,” Annu. Rev. Biomed. Eng., Vol.26, pp. 223-245, 2024. https://doi.org/10.1146/annurev-bioeng-110122-013805
- [3] J. S. H. Seah, S. Singh, L. P. Tan, and D. Choudhury, “Scaffolds for the manufacture of cultured meat,” Crit. Rev. Biotechnol., Vol.42, No.2, pp. 311-323, 2022. https://doi.org/10.1080/07388551.2021.1931803
- [4] D. Wilson, O. Tsigkou, L. Bosworth, and C. Jones, “Leather-like materials by cellular agriculture,” Text. Prog., Vol.55, No.1, 2023. https://doi.org/10.1080/00405167.2023.2188835
- [5] Y. Hirata, Y. Morimoto, E. Nam, and S. Takeuchi, “Portable biohybrid odorant sensors using cell-laden collagen micropillars,” Lab. on a Chip., Vol.19, No.11, pp. 1971-1976, 2019. https://doi.org/10.1039/c9lc00131j
- [6] M. Kawai, M. H. Nie, H. Oda, Y. Morimoto, and S. Takeuchi, “Living skin on a robot,” Matter-Us, Vol.5, No.7, pp. 2190-2208, 2022. https://doi.org/10.1016/j.matt.2022.05.019
- [7] M. Furuhashi, Y. Morimoto, A. Shima, F. Nakamura, H. Ishikawa, and S. Takeuchi, “Formation of contractile 3D bovine muscle tissue for construction of millimetre-thick cultured steak,” Npj. Sci. Food., Vol.5, Article No.6, 2021. https://doi.org/10.1038/s41538-021-00090-7
- [8] F. Louis, M. Furuhashi, H. Yoshinuma, S. Takeuchi, and M. Matsusaki, “Mimicking Wagyu beef fat in cultured meat: Progress in edible bovine adipose tissue production with controllable fatty acid composition,” Mater. Today Bio., Vol.21, Article No.100720, 2023. https://doi.org/10.1016/j.mtbio.2023.100720
- [9] X. Z. Ren, Y. Morimoto, and S. Takeuchi, “Biohybrid hand actuated by multiple human muscle tissues,” Sci. Robot., Vol.10, No.99, Article No.eadr5512, 2025. https://doi.org/10.1126/scirobotics.adr5512
- [10] Y. Morimoto, H. Yamada, B. Jo, M. H. Nie, and S. Takeuchi, “Multipole electrodes for driving biohybrid robots via selective muscle contraction,” Sensor Actuat B-Chem., Vol.448 (Part 2), Article No.138924, 2026. https://doi.org/10.1016/j.snb.2025.138924
- [11] X. K. Gao, K. Okasaki, H. Ohashi, T. Sakurai, and Y. Morimoto, “Jointless tongue-like bioactuator for multidirectional motion through directional electrical stimulation,” Adv. Intell. Syst.-Ger., Vol.8, No.4, Article No.e202501213, 2026. https://doi.org/10.1002/aisy.202501213
- [12] W. N. Bian, M. Juhas, T. W. Pfeiler, and N. Bursac, “Local tissue geometry determines contractile force generation of engineered muscle networks,” Tissue Engineering Part A, Vol.18, Nos.9-10, pp. 957-967, 2012. https://doi.org/10.1089/ten.tea.2011.0313
- [13] M. Juhas, G. C. Engelmayr, A. N. Fontanella, G. M. Palmer, and N. Bursac, “Biomimetic engineered muscle with capacity for vascular integration and functional maturation in vivo,” Proc. Natl. Acad. Sci. U.S.A., Vol.111, No.15, pp. 5508-5513, 2014. https://doi.org/10.1073/pnas.1402723111
- [14] H. Niioka, S. Asatani, A. Yoshimura, H. Ohigashi, S. Tagawa, and J. Miyake, “Classification of C2C12 cells at differentiation by convolutional neural network of deep learning using phase contrast images,” Hum. Cell, Vol.31, pp. 87-93, 2018. https://doi.org/10.1007/s13577-017-0191-9
- [15] A. Shakarchy, G. Zarfati, A. Hazak, R. Mealem, K. Huk, T. Ziv, O. Avinoam, and A. Zaritsky, “Machine learning inference of continuous single-cell state transitions during myoblast differentiation and fusion,” Mol. Syst. Biol., Vol.20, Article No.6, 2024. https://doi.org/10.1038/s44320-024-00010-3
- [16] M. Ali, V. Benfante, G. Basirinia, P. Alongi, A. Sperandeo, A. Quattrocchi, A. G. Giannone, D. Cabibi, A. Yezzi, D. D. Raimondo, A. Tuttolomondo, and A. Comelli, “Applications of artificial intelligence, deep learning, and machine learning to support the analysis of microscopic images of cells and tissues,” J. Imaging, Vol.11, No.2, Article No.59, 2025. https://doi.org/10.3390/jimaging11020059
- [17] Y. L. Wang and Y. C. Lin, “Traction force microscopy by deep learning,” Biophys. J., Vol.120, No.15, pp. 3079-3090, 2021. https://doi.org/10.1016/j.bpj.2021.06.011
- [18] H. H. Li, D. Matsunaga, T. S. Matsui, H. Aosaki, G. Kinoshita, K. Inoue, A. Doostmohammadi, and S. Deguchi, “Wrinkle force microscopy: A machine learning based approach to predict cell mechanics from images,” Commun. Biol., Vol.5, Article No.361, 2022. https://doi.org/10.1038/s42003-022-03288-x
- [19] Z. W. Lin, J. C. Garbern, R. Liu, Q. Li, E. M. Juncosa, H. L. T. Elwell, M. Sokol, J. Aoyama, U. S. Deumer, E. M. Hsiao, H. Sheng, R. T. Lee, and J. Liu, “Tissue-embedded stretchable nanoelectronics reveal endothelial cell-mediated electrical maturation of human 3D cardiac microtissues,” Sci. Adv., Vol.9, No.10, Article No.eade8513, 2023. https://doi.org/10.1126/sciadv.ade8513
- [20] W. Lee, C. M. Boghdady, V. Lelarge, R. L. Leask, L. McCaffrey, and C. Moraes, “Ultrasoft edge-labelled hydrogel sensors reveal internal tissue stress patterns in invasive engineered tumors,” Biomaterials, Vol.296, Article No.122073, 2023. https://doi.org/10.1016/j.biomaterials.2023.122073
- [21] J. Lee, H. Kim, H. R. Lim, Y. S. Kim, T. T. T. Hoang, J. Choi, G. J. Jeong, H. Kim, R. Herbert, I. Soltis, K. R. Kim, S. H. Lee, Y. Kwon, Y. Lee, Y. C. Jang, and W. H. Yeo, “Large-scale smart bioreactor with fully integrated wireless multivariate sensors and electronics for long-term in situ monitoring of stem cell culture,” Sci. Adv., Vol.10, No.7, Article No.eadk6714, 2024. https://doi.org/10.1126/sciadv.adk6714
- [22] Y. Morimoto, M. Kato-Negishi, H. Onoe, and S. Takeuchi, “Three-dimensional neuron-muscle constructs with neuromuscular junctions,” Biomaterials, Vol.34, No.37, pp. 9413-9419, 2013. https://doi.org/10.1016/j.biomaterials.2013.08.062
- [23] X. B. Qin, Z. C. Zhang, C. Y. Huang, M. Dehghan, O. R. Zaiane, and M. Jagersand, “U-Net: Going deeper with nested U-structure for salient object detection,” Pattern Recogn., Vol.106, Article No.107404, 2020. https://doi.org/10.1016/j.patcog.2020.107404
- [24] Z. Liu, H. Mao, C.-Y. Wu, C. Feichtenhofer, T. Darrell, and S. Xie, “A ConvNet for the 2020s,” Proc. of the IEEE/CVF Conf. on Computer Vision and Pattern Recognition (CVPR), pp. 11966-11976, 2022. https://doi.org/10.1109/CVPR52688.2022.01167
- [25] M. Tan and Q. V. Le, “EfficientNetV2: Smaller models and faster training,” Proc. of the 38th Int. Conf. on Machine Learning (ICML), Vol.139, pp. 10096-10106, 2021. https://doi.org/10.48550/arXiv.2104.00298
- [26] G. Huang, Z. Liu, L. V. D. Maaten, and K. Q. Weinberger, “Densely connected convolutional networks,” Proc. of the IEEE Conf. on Computer Vision and Pattern Recognition (CVPR), pp. 2261-2269, 2017. https://doi.org/10.1109/CVPR.2017.243
- [27] R. Díaz and A. Marathe, “Soft labels for ordinal regression,” Proc. of the IEEE/CVF Conf. on Computer Vision and Pattern Recognition (CVPR), pp. 4733-4742, 2019. https://doi.org/10.1109/CVPR.2019.00487
- [28] T.-Y. Lin, P. Goyal, R. Girshick, K. He, and P. Dollár, “Focal loss for dense object detection,” Proc. of the IEEE Int. Conf. on Computer Vision (ICCV), pp. 2999-3007, 2017. https://doi.org/10.1109/ICCV.2017.324
- [29] E. D. Cubuk, B. Zoph, J. Shlens, and Q. V. Le, “RandAugment: Practical automated data augmentation with a reduced search space,” Proc. of the IEEE/CVF Conf. on Computer Vision and Pattern Recognition Workshops (CVPRW), pp. 3008-3017, 2020. https://doi.org/10.1109/CVPRW50498.2020.00359
- [30] Z. Zhong, L. Zheng, G. Kang, S. Li, and Y. Yang, “Random erasing data augmentation,” Proc. of the AAAI Conf. on Artificial Intelligence, Vol.34, No.7, pp. 13001-13008, 2020. https://doi.org/10.1609/aaai.v34i07.7000
- [31] H. Zhang, M. Cisse, Y. N. Dauphin, and D. Lopez-Paz, “mixup: Beyond empirical risk minimization,” Proc. of the Int. Conf. on Learning Representations (ICLR), 2018.
- [32] S. Yun, D. Han, S. J. Oh, S. Chun, J. Choe, and Y. Yoo, “CutMix: Regularization strategy to train strong classifiers with localizable features,” Proc. of the IEEE/CVF Int. Conf. on Computer Vision (ICCV), pp. 6022-6031, 2019. https://doi.org/10.1109/ICCV.2019.00612
- [33] N. Moshkov, B. Mathe, A. Kertesz-Farkas, R. Hollandi, and P. Horvath, “Test-time augmentation for deep learning-based cell segmentation on microscopy images,” Sci. Rep-Uk, Vol.10, Article No.5068, 2020. https://doi.org/10.1038/s41598-020-61808-3
- [34] I. Loshchilov and F. Hutter, “Decoupled weight decay regularization,” Proc. of the Int. Conf. on Learning Representations (ICLR), 2019.
- [35] I. Loshchilov and F. Hutter, “SGDR: Stochastic Gradient Descent with Warm Restarts,” Proc. of the Int. Conf. on Learning Representations (ICLR), 2017.
- [36] X. Chen and K. He, “Exploring simple siamese representation learning,” Proc. of the IEEE/CVF Conf. on Computer Vision and Pattern Recognition (CVPR), pp. 15745-15753, 2021. https://doi.org/10.1109/CVPR46437.2021.01549
- [37] M. Lin, Q. Chen, and S. Yan, “Network in network,” Proc. of the Int. Conf. on Learning Representations (ICLR), 2014.
This article is published under a Creative Commons Attribution-NoDerivatives 4.0 Internationa License.