
Paper:
Analysis of Intracellular DNA Sensor Dynamics Around DNA-Coated Microbeads Designed as Interfaces for Controlling Cellular Molecular Communication
Shouhei Kobayashi
 , Kenta Arai, Kayoko Ujiie, Noriko Fukuta, and Chie Mori
Bio-ICT Collaboration Center, Advanced ICT Research Institute, National Institute of Information and Communications Technology (NICT)
588-2 Iwaoka, Iwaoka-cho, Nishi-ku, Kobe, Hyogo 651-2492, Japan

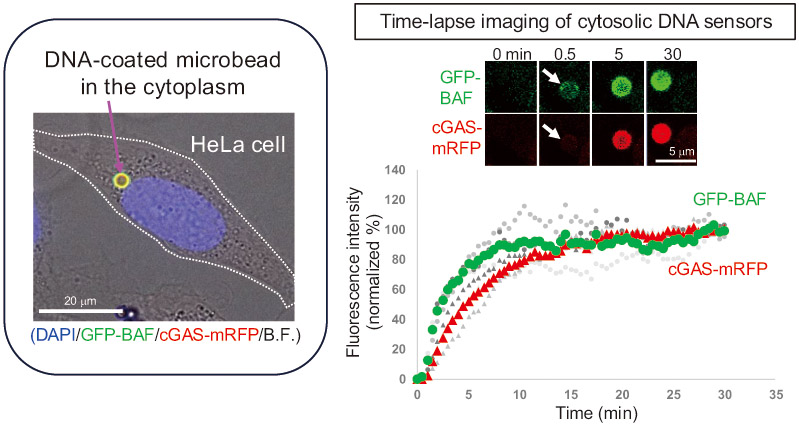
As a model system for interface technologies to artificially control molecule-mediated communication in living cells (molecular communication), we developed a methodology in which biomolecule-coated polystyrene beads are internalized into cells, enabling measurement and control of cellular responses in the vicinity of the beads. We demonstrate that the cytosolic DNA sensor proteins barrier-to-autointegration factor and cyclic GMP-AMP synthase exhibit distinct behaviors around linear double-stranded DNA-coated polystyrene beads (DNA-beads, 2.8 µm in diameter) introduced into the cytoplasm. These findings highlight the importance of understanding and controlling the early events following cytoplasmic introduction of DNA-beads when such bead-based bio-artificial interfaces are used to regulate molecular communication in cells.
Biomolecule-coated microbeads to control molecular communication
1. Introduction
Cells continuously sense and respond to information from the external environment via molecular communication, a mode of information transmission mediated by molecules. If molecular communication between cells can be measured and evaluated for interfacing and control through information and communication technologies, the associated benefits are expected to cover a wide range of fields, including healthcare and medicine 1,2,3. To achieve this, interface technologies can artificially perturb cells and control molecular communication between cells. As a model of this interface technology, we have developed an experimental system in which artificial microbeads (\(\ge 1\) μm) coated with biomolecules are introduced into living cells, thereby inducing targeted intracellular phenomena around the beads 4,5,6. An advantage of this approach is that the type of molecule bound to the bead surface and the bead size can be flexibly designed, enabling the analysis of a wide range of intracellular phenomena. Using this system, we have previously demonstrated the induction of autophagy, a cellular degradative mechanism, around artificial beads 4 and have also achieved the artificial formation of nuclear envelope-like membrane structures around the beads 5,6.
To enable biomolecule-coated beads to function effectively inside cells, it is essential to allow them to evade cellular defense mechanisms and be stably retained within the intracellular environment. With respect to the invasion of exogenous DNA, recent studies have shown that cytosolic DNA sensors, such as cyclic GMP-AMP synthase (cGAS), trigger innate immune responses against foreign DNA 7,8. However, because the DNA examined in conventional studies, such as plasmid DNA, is extremely small and difficult to observe using standard optical microscopy, it has been challenging to investigate the localization of cytoplasm-invading exogenous DNA and the associated structural changes and cytosolic DNA sensor dynamics at invasion sites. To address this, we have previously demonstrated that when polystyrene beads coated with linear double-stranded DNA (DNA-beads) are introduced into cells, the DNA-binding protein barrier-to-autointegration factor (BAF) 9,10 rapidly accumulates on the DNA-beads immediately after their escape from endosomes, thereby allowing the DNA beads to evade autophagic degradation 5.
In this study, we report a microscopy-based analysis focusing on the behavior of the DNA sensor proteins BAF and cGAS in the cytoplasmic region surrounding DNA-beads upon their introduction into cells. The insights obtained in this study, together with the associated artificial bead technologies 4,5,6, are expected to contribute to the development of interfaces between cells and artificial materials, enabling both the artificial regulation of cellular functions by exploiting the properties of artificial materials and the engineering of functional intracellular microenvironments for studying cellular processes.
2. Materials and Methods
2.1. Preparation of DNA-Beads
Beads with double-stranded DNA bound to their surface were prepared using the same method as previously reported 5. The pGADT7 plasmid (Clontech Laboratories, Mountain View, CA, USA; #K1612-1; 8 kbp) was amplified in Escherichia coli and purified using a plasmid purification kit. The plasmid was then linearized by restriction enzyme digestion, and biotinylation was performed at only one end of the linear DNA. Phosphorothioate-modified oligonucleotides were introduced at both ends to protect DNA from exonuclease-mediated degradation. The resulting biotinylated DNA was mixed with streptavidin-conjugated polystyrene beads (Dynabeads M-270; Invitrogen, Carlsbad, CA, USA; #65305; 2.8 μm in diameter) and incubated at room temperature for 3 h, resulting in the formation of DNA-beads in which one end of the DNA was immobilized on the bead surface through the strong biotin–streptavidin interaction. Unbound biotinylated DNA was removed by washing, and the beads were finally suspended in distilled water at a concentration of \(5 \times 10^7\) beads/mL. DNA binding to the beads was performed using the Dynabeads Kilobase Binder Kit (Invitrogen; #60101). Approximately 20 μg of biotinylated dsDNA was immobilized onto 50 μg of the beads (\(\sim\)75 pmoles of dsDNA per milligram of beads) as described previously 5.
2.2. Plasmid Construction
Plasmid DNA encoding cGAS-mRFP was prepared as follows. At first, to construct the PBEF1-MCS-mRFP-IRES-neo vector, the DNA fragment encoding mRFP was amplified from the plasmid encoding mRFP-BAF 5 using PCR by using the following primers: mRFP FWD InF PBEF1 Bam (5\('\)-ATTCGAATTTAAATCGGGATCCATGGCCTCCTCCGAGGACGT-3\('\)) and mRFP REV InF PBEF1 Bam (5\('\)-CTCAGCGGCCGCGGATCTTAGGCGCCGGTGGAGTGGC-3\('\)). The PCR product was digested with BamHI, and the fragment was inserted into the PB-EF1-MCS-IRES-neo cDNA expression vector (System Biosciences, Palo Alto, CA, USA; PB533A-2) after digestion with \({Bam}\)HI to obtain the PB-EF1-MCS-mRFP-IRES-neo vector.
Next, to construct the PBEF1-MCS-mRFP-zeo vector, a fragment corresponding to nucleotides 2,388–2,545 of the PBEF1-MCS-IRES-neo vector was amplified by PCR using the following primers: PBEF1 Kpn FWD (5\('\)-CTGAAGGATGCCCAGAAGGTCCCCATTGT-3\('\)) and PBEF1 KOZAK REV (5\('\)-TCCGGACGCCATGGTTGTGG-3\('\)). In addition, the zeocin resistance gene was amplified from the pcDNA3.1/zeo vector using the following primers: Zeocin FWD for PBEF1 KOZAK (5\('\)-ACAACCATGGCGTCCGGAATGGCCAAGTTGACCAGTGCCGTTCC-3\('\)) and Zeocin REV for PBEF1 SalI (5\('\)-TCCAGAGGTTGATTGTCGACTCAGTCCTGCTCCTCGGCCACGAA-3\('\)). The PBEF1-MCS-mRFP-IRES-neo vector was digested with \({Kpn}\)I and \({Sal}\)I to generate a linearized backbone fragment. The three fragments were assembled using the In-Fusion® HD Cloning Kit (Clontech; #639649) according to the manufacturer’s instructions, resulting in the PBEF1-MCS-mRFP-zeo vector.
The coding sequence of cGAS was PCR-amplified from a cDNA pool derived from HeLa cells using the following primers: hcGAS FWD RI InF PB (5\('\)-TCTAGAGCTAGCGAATTCGATGCAGCCTTGGCACGGAAA-3\('\); reverse primer) and hcGAS REV RI InF PB (5\('\)-CGATTTAAATTCGAATTCTCAAAATTCATCAAAAACTG-3\('\)).
The fragment was subcloned into the PBEF1-EGFP-MCS-neo vector 11. The coding sequence was then amplified using the hcGAS FWD RI InF primer and the hcGAS REV2 N RI InF PB primer (5\('\)-CGATTTAAATTCGAATTCAAATTCATCAAAAACTG-3\('\)), in which the stop codon (TCA) was omitted, and inserted into the pBEF1-MCS-mRFP-zeo vector to generate the PBEF1-cGAS-mRFP-zeo plasmid.
DNA constructs expressing cGAS-GFP and mRFP-BAF were generated by swapping the GFP and mRFP tags between the original GFP-BAF and cGAS-mRFP constructs, using the cloning strategy described above.
2.3. Cell Culture
HeLa cells were obtained from RIKEN Cell Bank (Tsukuba, Japan) and maintained in DMEM containing 10% (v/v) calf serum. HeLa cells expressing both GFP-BAF and cGAS-mRFP (HeLa/GFP-BAF/cGAS-mRFP) were obtained as follows: HeLa cells were first transfected with plasmid DNA encoding cGAS-mRFP (PBEF1-cGAS-mRFP-zeo) and incubated in the presence of Zeocin (Life Technologies, Carlsbad, CA, USA; #R250-01) to obtain HeLa/cGAS-mRFP cells. The HeLa/cGAS-mRFP cells were then transfected with a plasmid encoding GFP-BAF 12 under the EF1\(\alpha\) promoter and maintained in the presence of Zeocin (200 μg/mL) and Geneticin (200 μg/mL).
2.4. Bead Introduction into Living Cells
DNA-beads were introduced into HeLa cells using the Effectene-mediated method using the “enhancer reagent” equipped with the Effectene transfection reagent kit (Qiagen, Hilden, Germany; #301425) 5. One day before bead introduction, cells were seeded onto 35-mm glass-bottom culture dishes (MatTek) at a concentration of \(2 \times 10^{5}\) cells per dish. \(5 \times 10^{4}\) of the beads per dish were used in each experiment. After incubation at 37°C for 1 h, the cells were washed with culture medium to remove unattached beads, and then the cells were pre-stained with Hoechst33342 for DNA visualization prior to observation.
2.5. Indirect Immunofluorescence Staining
Indirect immunofluorescence staining was performed as previously described 4. Cells cultured in 35-mm glass-bottom culture dishes were fixed with 4% formaldehyde in PBS (pH 7.4) for 15 min. After washing with PBS, the cells were permeabilized with 0.1% Triton X-100 in PBS for 5 min, treated with 2% BSA in PBS for 1 h at room temperature for blocking, and then stained with specific antibodies against BAF and cGAS in 1% BSA/PBS for 20 h at 4°C. The primary antibodies used were anti-BANF1 mouse monoclonal antibody (Abnova, Taipei, Taiwan; #H00008815-M01) and anti-cGAS rabbit monoclonal antibody (Cell Signaling Technology, Danvers, MA, USA; #15102). Secondary antibodies labeled with Alexa Fluor 488 and 594 were purchased from Invitrogen (#A11029 and #A11037, respectively). After washing thrice with PBS, the cells were counterstained with 0.5 μg/mL DAPI for 15 min at room temperature. Fluorescence images were obtained using an Olympus oil-immersion objective lens PLAPON60xOSC (NA \(= 1.40\)) and a DeltaVision microscope.
2.6. Live-Cell Fluorescence Imaging and FRAP Analysis
DMEM (without phenol red) supplemented with 20 mM HEPES, 10% FBS, and 80 μg/mL kanamycin was used as the observation medium for live-cell imaging (1.5 mL/dish). A layer of mineral oil was overlaid on the medium to prevent the evaporation of the culture medium during observation. Time-lapse images were obtained through an Olympus oil-immersion objective lens UApo/340 (40\(\times\), NA \(= 1.35\)) on the DeltaVision microscope system (Applied Precision, Issaquah, WA, USA) placed in a temperature-controlled room (37°C).
Fluorescence recovery after photobleaching (FRAP) analysis was performed using a confocal laser-scanning microscope (LSM 880; Zeiss). A C-Apochromat 40\(\times\)/1.2 W Corr UV-VIS-IR water-immersion objective (Zeiss) was used.
DNA-beads positive for both GFP-BAF and cGAS-mRFP were photobleached using 488- and 561-nm lasers. Three pre-bleach images were acquired, and fluorescence recovery around the beads was monitored every 10 s. FRAP analysis was performed on DNA-beads that had escaped from the endosomes and were classified according to the elapsed time after escape as \(<10\) min (\(n = 4\)) or \(\ge 10\) min (\(n = 16\)). The fluorescence recovery curves were analyzed as described below.
For image analysis, the mean fluorescence intensity of the bleached region of interest (ROI) was measured at each time point and corrected for background fluorescence. The background-corrected fluorescence intensity, \({I}_\mathrm{corr}(t)\), was calculated as follows:
The fluorescence recovery curves were normalized by setting the average background-corrected fluorescence intensity of the three pre-bleach frames (\({I}_\mathrm{pre}\)) to 100% and the background-corrected fluorescence intensity immediately after photobleaching (\({I}_\mathrm{bleach}\)) to 0%. The normalized recovery fraction \({R_{f}}(t)\) was calculated as follows:
Normalized recovery curves were fitted by nonlinear regression using a single-exponential recovery model commonly used in FRAP analyses 13.
The half-recovery time (\({t}_{1/2}\)) was calculated from the fitted rate constants as follows:
2.7. 1,6-Hexanediol Treatment and CLEM Analysis
For medium exchange during time-lapse imaging, a live cell imaging fluidic system (Takasago Fluidic Systems, Nagoya, Japan) was used with minor modifications to allow mounting on the stage of the DeltaVision system. Medium exchange was performed by perfusing an observation medium containing 2.5% (v/v) 1,6-hexanediol into a glass-bottomed dish at a flow rate of 3 mL/min using two tubes, while an equivalent volume of the original medium was simultaneously removed from the opposite side. Statistical analyses were performed using R. A two-way repeated-measures ANOVA was conducted with fluorophores and treatment conditions as within-subject factors (Fig. 5(b)). Correlative light and electron microscopy (CLEM) of 2.5% (w/v) glutaraldehyde-fixed samples was performed as described previously 5. For quantitative analysis, the grayscale intensities within an annular region extending 550 nm from the bead surface were measured using Fiji. The measured intensities were normalized to the grayscale intensity of the corresponding beads and plotted for comparison between samples.
3. Results and Discussions
3.1. Intracellular Delivery of DNA-Beads and Accumulation of Endogenous Cytosolic DNA Sensors on the Beads
The experimental setup used in this study is illustrated in Fig. 1. We previously reported that when DNA-beads were introduced into HeLa cells using a transfection reagent, the cytosolic DNA sensor protein BAF rapidly accumulated on the beads immediately after endosomal membrane rupture, allowing the beads to evade autophagy 5. However, it has remained unclear whether cGAS (cyclic GMP-AMP synthase), which plays a critical role in the cGAS-STING pathway as an exogenous DNA 7,8, accumulates on DNA-beads.
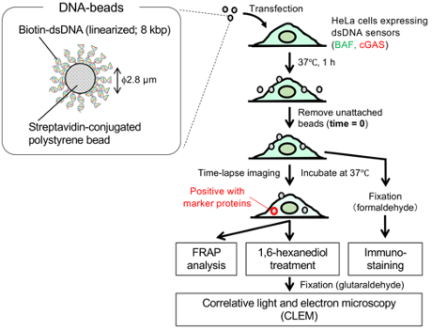
Fig. 1. Experimental scheme of this study.
Therefore, we first examined whether endogenous BAF and cGAS accumulated on DNA-beads through immunofluorescence staining using specific antibodies against BAF and cGAS. Accumulation of endogenous BAF and cGAS on DNA-beads was observed 4 h after washout of unattached beads (Fig. 2). In contrast, no accumulation of BAF or cGAS was detected on the beads without DNA.
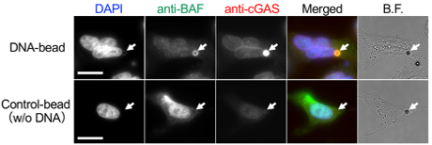
Fig. 2. Detection of DNA-beads by endogenous cytosolic DNA sensors in HeLa cells. Representative images of DNA-beads or control-beads at 4 h after removal of unattached beads are shown. Endogenous BAF and cGAS were stained with specific antibodies. Arrows indicate the position of the beads. B.F. represents bright field images. Bars: 20 μm.
3.2. Live-Cell Imaging of BAF and cGAS Accumulation on DNA-Beads
To examine the dynamics of BAF and cGAS in the vicinity of DNA-beads, we generated a stable cell line co-expressing GFP-BAF and cGAS-mRFP (HeLa/GFP-BAF/cGAS-mRFP). When DNA-beads were introduced into this cell line, all GFP-BAF-positive beads were also positive for cGAS-mRFP in the cytoplasm of the cell 4 h after washout of unattached beads (117 BAF-positive beads were examined in total across three glass-bottom dishes) (Fig. 3(a)). These results indicate that this stable cell line is suitable for analyzing the dynamics of BAF and cGAS around DNA beads in the cytoplasm.
Next, DNA-beads were introduced into HeLa/GFP-BAF/cGAS-mRFP cells and subjected to fluorescent time-lapse imaging. Both BAF and cGAS began to accumulate on the DNA-beads nearly simultaneously, and fluorescence signals on the beads reached about 80% of their final intensity within approximately 10 min (Figs. 3(b) and (c)). The fluorescence accumulation half-times of GFP-BAF and cGAS-mRFP were 2.2 and 4.9 min, respectively (Fig. 3(c)). Based on our previous report showing that the accumulation of BAF on DNA-beads starts immediately after endosomal membrane rupture 5, these results indicate that both BAF and cGAS rapidly bind to double-stranded DNA on beads following endosomal disruption. These results partially mimic the state in which both BAF and cGAS simultaneously localize to DNA exposed to the cytosol after nuclear envelope rupture 14.
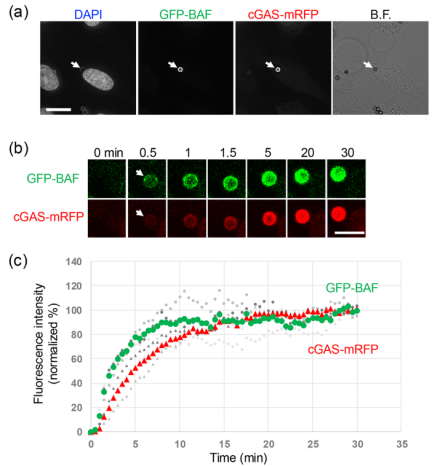
Fig. 3. Accumulation of GFP-BAF and cGAS-mRFP around DNA-beads. (a) Representative images of GFP-BAF and cGAS-mRFP around DNA-beads in HeLa/GFP-BAF/cGASmRFP cell at 4 h. Arrows indicate the position of the beads. Bar: 20 μm. (b) Time-lapse images of GFP-BAF and cGASmRFP around a single DNA-bead. Upper panels show representative images of GFP-BAF and cGAS-mRFP signals. Lower panels show time-dependent changes in the fluorescence intensity of GFP-BAF and cGAS-mRFP around the bead shown in the upper panels. Time-lapse observation was carried out every 0.5 min. Zero minutes indicate the time frame immediately before the gain of fluorescent signals around the bead. Bar: 5 μm. (c) Quantification of GFP-BAF and cGASmRFP accumulation around DNA-beads following endosomal escape. Fluorescence intensities were normalized to the mean fluorescence intensity of the final three time points for each DNA-bead. Gray symbols represent individual DNA-beads, whereas the large green circles (GFP-BAF) and red triangles (cGAS-mRFP) indicate the mean normalized fluorescence intensities at each time point.
3.3. FRAP-Based Analysis of BAF and cGAS Dynamics Around DNA-Beads
Previous studies have shown that nuclear envelope-like membrane structures containing the BAF-binding inner nuclear membrane protein emerin form around DNA-beads within \(\sim\)10 min after their escape from endosomes into the cytosol 5. To investigate whether the dynamics of the BAF and cGAS around the DNA beads changed over time after endosomal escape, we performed FRAP analysis. When photobleaching was performed 3 min after the beads became positive for both BAF and cGAS, the recovery of fluorescence signals corresponding to at least 30% of the prebleach intensity was observed within 5 min after bleaching for both BAF and cGAS (Fig. 4(a)). In contrast, when photobleaching was performed \(\ge 10\) min after endosomal escape, fluorescence recovery was markedly reduced (Fig. 4(b)). Quantitative analysis revealed no significant difference in the half-recovery time (\({t}_{1/2}\)) of either BAF or cGAS between the two groups (Fig. 4(c), upper panels). In contrast, the recovery fraction (\(R_{f}\)) of cGAS was significantly reduced in DNA-beads that had resided in the cytosol for \(\ge 10\) min compared with those analyzed within 10 min after endosomal escape (Fig. 4(c), lower- right panel). These findings suggest that the mobile fraction of cGAS decreases over time after endosomal escape, resulting in a more stable association with DNA-beads.
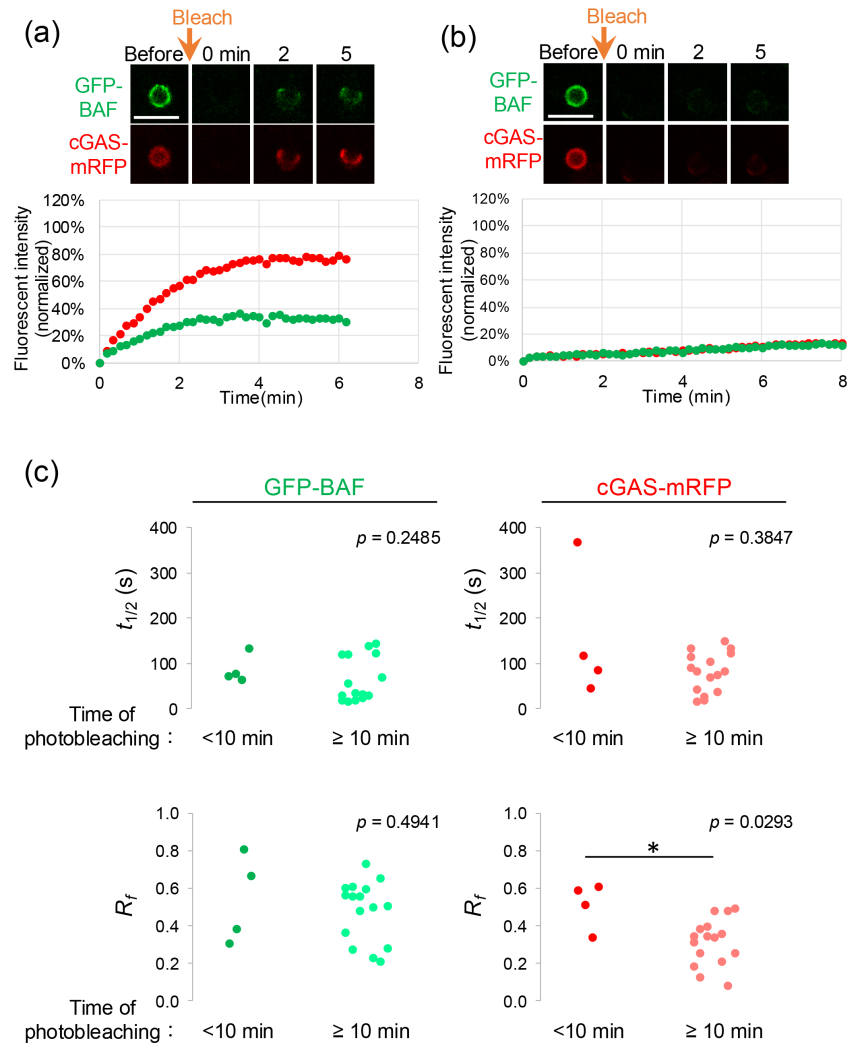
Fig. 4. FRAP analyses of GFP-BAF and cGAS-mRFP around DNA-beads. (a) Representative data of DNA-beads that escaped from endosome and became BAF- and cGAS-positive less than 10 min earlier. (b) Representative data of DNA-beads that escaped from endosome and became BAF- and cGAS-positive 10 min or more earlier. Time-lapse images were obtained every 10 s. Bars: 5 μm. (c) Half-recovery times (\(t_{1/2}\)) and recovery fractions (\(R_f\)) obtained from FRAP analyses of GFP-BAF and cGAS-mRFP surrounding DNA-beads. DNA-beads were classified into early (\(<10\) min, \(n = 4\)) and late (\(\ge 10\) min, \(n = 16\)) post-endosomal escape groups. Each dot represents an individual DNA-bead. Statistical comparisons between groups were performed using the Mann–Whitney U test. \(^{*}\): \(p < 0.05\).
3.4. Relationship Between 1,6-Hexanediol-Induced Localization Changes of cGAS-GFP and mRFP-BAF with Intracellular Structures Around DNA-Beads
Recent studies have reported that liquid–liquid phase separation (LLPS) is involved in the function of cGAS as a cytosolic DNA sensor 15. Therefore, we examined how treatment with 1,6-hexanediol, which is known to disrupt LLPS, affects the localization of BAF and cGAS on DNA beads. As the HeLa/GFP-BAF/cGAS-mRFP cell line was not sufficiently tolerant to 1,6-hexanediol treatment for quantitative analysis, we used a cell line in which the fluorophores were swapped between BAF and cGAS (cGAS-GFP and mRFP-BAF). Time-lapse imaging was performed to monitor the localization dynamics of BAF and cGAS during treatment with 2.5% (v/v) 1,6-hexanediol, which was delivered to the culture medium using a fluidic control device. Upon hexanediol treatment, the BAF signal associated with DNA-beads gradually decreased over time, whereas the cGAS signal remained largely unchanged (Fig. 5(a)). Quantitative analysis of the fluorescence intensities confirmed this observation. The fluorescence intensity of mRFP-BAF was significantly reduced at 10 min after exposure to 2.5% hexanediol and remained low after washout, whereas the fluorescence intensity of cGAS-GFP did not exhibit a significant change throughout the observation period (Fig. 5(b)). A two-way repeated-measures ANOVA revealed significant effects of fluorophore (\({F}(1,6) = 93.81\), \({p} = 6.95\times10^{-5}\)) and condition (\({F} (2,12) = 34.41\), \({p} = 1.07\times10^{-5}\)), as well as a significant fluorophore \(\times\) condition interaction (\({F} (2,12) = 30.75\), \({p} = 1.9\times10^{-5}\)). These results indicated that cGAS-GFP and mRFP-BAF exhibited distinct fluorescence intensity changes in response to hexanediol treatment and washout. Taken together, these results suggest that although both BAF and cGAS bind to double-stranded DNA coated on beads that enter the cytosol, they exist in distinct states with different sensitivities to 1,6-hexanediol.
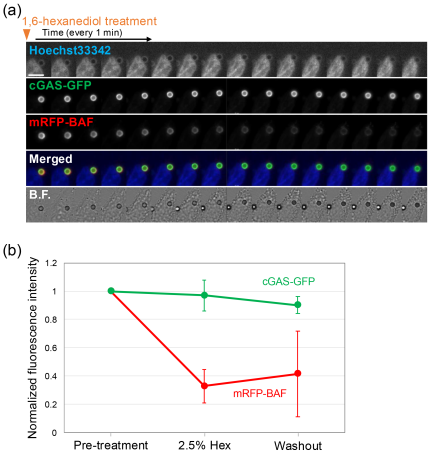
Fig. 5. Effect of 1,6-hexanediol treatment on BAF/cGAS localization around DNA-beads. Time-lapse images of the indicated fluorescent markers were obtained every 1 min. Bar: 10 μm. (b) Changes in the normalized fluorescence intensities of cGAS-GFP and mRFP-BAF. Fluorescence intensities were measured in the same cells before hexanediol treatment (pre-treatment), 10 min after reaching 2.5% hexanediol (2.5% hex), and after washout at a total observation time of 50 min (washout). Fluorescence intensities were normalized to the pre-treatment values. Data are presented as mean \(\pm\) SD (\(n = 7\) DNA-beads). A two-way repeated-measures ANOVA was performed with fluorophore (RFP vs. GFP) and condition (pre-treatment, 2.5% hex, and washout) as within-subject factors.
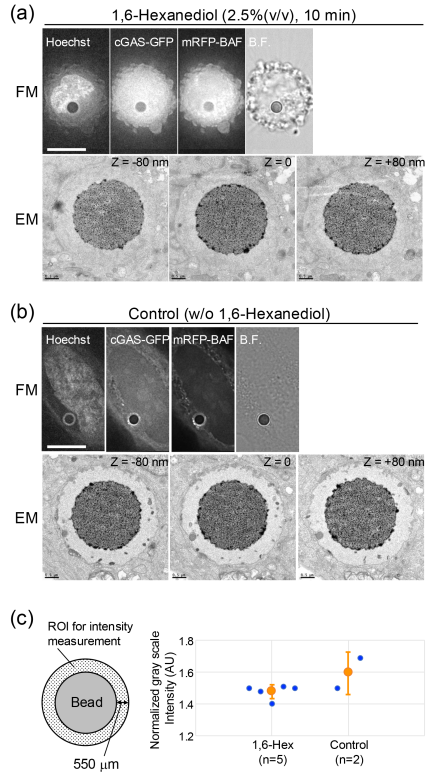
Fig. 6. CLEM analyses of the DNA-beads after the addition of 1,6-hexanediol. After the addition of 1,6-hexanediol, CLEM analyses of DNA-beads in HeLa/GFP-LC3/mRFP-BAF cells. Representative FM and EM images of the DNA-beads fixed at 10 min after the addition (a) or without the addition (b) of 1,6-hexanediol. The same bead was observed in FM and EM. Bars: 10 μm (FM) and 0.5 μm (EM). For the EM images, three serial ultrathin sections (80 nm in thickness) are shown. (c) Quantification of electron density surrounding DNA-beads in transmission electron micrographs. Electron density was estimated from the grayscale intensity measured within the annular region surrounding each bead, as illustrated on the left. Higher normalized intensity values indicate lower electron density. Each blue dot represents an individual DNA-bead, and orange circles indicate the mean \(\pm\) SD (1,6-hexanediol, \(n = 5\); control, \(n = 2\)).
We conducted a TEM analysis to examine whether the loss of BAF from the DNA-beads was accompanied by changes in the ultrastructure. Previous studies have shown that, after sufficient time following washout of unattached beads, DNA-beads introduced into cells become surrounded by nuclear envelope-like membrane structures, with an electron-lucent region between the bead and the surrounding membrane, distinct from the cytosolic region 5. Under these conditions, the beads subjected to 1,6-hexanediol treatment were chemically fixed with glutaraldehyde and examined by TEM. Compared with untreated samples, the electron density of the DNA-containing region between the beads and the nuclear envelope-like structures was markedly increased (Figs. 6(a) and (b)), becoming indistinguishable from that of the surrounding cytosol. Quantification of the electron density surrounding DNA-beads revealed lower normalized grayscale intensity following 1,6-hexanediol treatment compared to untreated controls (Fig. 6(c)). As lower normalized intensity values indicate higher electron density, these findings suggest that hexanediol treatment induces the accumulation of electron-dense molecules around the DNA-beads. As BAF has been reported to bridge double-stranded DNA molecules 16, the decrease in BAF associated with DNA-beads induced by hexanediol treatment may have altered the local DNA architecture, potentially permitting the accumulation of other intracellular factors around the beads. Taken together with the observed reduction in the BAF signals around the beads upon 1,6-hexanediol treatment (Fig. 5), these results suggest that BAF plays a role in restricting the access of cytosolic factors to the DNA on the beads.
Previous studies have shown that BAF efficiently binds to and bridges double-stranded DNA and outcompetes cGAS in DNA binding under certain conditions 14,16. In addition, BAF recruits the LEM-domain inner nuclear membrane protein, emerin, to the exposed DNA and contributes to the formation of nuclear envelope-like membrane structures around the cytosolic DNA 5. Consistent with these observations, the rapid accumulation of BAF observed in this study may have facilitated the initial organization of the DNA-bead-associated structures. Furthermore, the progressive decrease in the mobile fraction of cGAS after endosomal escape suggests the stabilization of cGAS-DNA interactions over time. The reduced mobile fraction of cGAS observed at later time points (Fig. 4(c)) may, therefore, reflect the formation of a BAF-dependent nuclear envelope-like membrane structure around DNA-beads, which could contribute to the stable retention of cGAS within the DNA-associated compartment. Interestingly, although 1,6-hexanediol treatment reduced the accumulation of BAF around DNA-beads, cGAS localization was largely unaffected. Although the underlying mechanism remains unclear, this difference may reflect distinct modes of retention around DNA-beads, with cGAS remaining associated through direct DNA binding, whereas BAF accumulation may depend, in part, on higher-order DNA-associated assemblies or membrane-associated structures that are more sensitive to 1,6-hexanediol.
4. Conclusions
In this study, we demonstrated that two cytosolic DNA sensors, BAF and cGAS, exhibit distinct behaviors upon accumulation on micrometer-scale DNA-beads introduced into the cytoplasm of living cancer cells. A deeper understanding and precise control of the events occurring around DNA beads in the interval between the recognition of exogenous DNA by cytosolic DNA sensors and the activation of innate immune responses through the cGAS-STING pathway will pave the way for novel technologies to artificially manipulate intracellular phenomena, including engineered gene expression from DNA coated on beads. Furthermore, by exploring artificial beads composed of materials that respond to physical stimuli, such as light or magnetic fields, artificial beads could serve as interfaces not only for manipulating single-cell processes, but also for controlling the collective behavior of cell populations.
Acknowledgments
The DNA construct encoding the mRFP gene was a gift from Dr. Roger Tsien.
- [1] T. Nakano, Y. Okaie, S. Kobayashi, T. Hara, Y. Hiraoka, and T. Haraguchi, “Methods and applications of mobile molecular communication,” Proc. of the IEEE, Vol.107, No.7, pp. 1442-1456, 2019. https://doi.org/10.1109/JPROC.2019.2917625
- [2] M. Egan, M. Kuscu, M. T. Barros, M. Booth, A. Llopis-Lorente, M. Magarini, D. P. Martins, M. Schäfer, and P. Stano, “Toward interdisciplinary synergies in molecular communications: Perspectives from synthetic biology, nanotechnology, communications engineering and philosophy of science,” Life, Vol.13, No.1, Article No.208, 2023. https://doi.org/10.3390/life13010208
- [3] J. Su, Y. Song, Z. Zhu, X. Huang, J. Fan, J. Qiao, and F. Mao, “Cell–cell communication: New insights and clinical implications,” Signal Transduction and Targeted Therapy, Vol.9, Article No.196, 2024. https://doi.org/10.1038/s41392-024-01888-z
- [4] S. Kobayashi, T. Kojidani, H. Osakada, A. Yamamoto, T. Yoshimori, Y. Hiraoka, and T. Haraguchi, “Artificial induction of autophagy around polystyrene beads in nonphagocytic cells,” Autophagy, Vol.6, No.1, pp. 36-45, 2010. https://doi.org/10.4161/auto.6.1.10324
- [5] S. Kobayashi, T. Koujin, T. Kojidani, H. Osakada, C. Mori, Y. Hiraoka, and T. Haraguchi, “BAF is a cytosolic DNA sensor that leads to exogenous DNA avoiding autophagy,” Proc. Natl. Acad. Sci. U.S.A., Vol.112, No.22, pp. 7027-7032, 2015. https://doi.org/10.1073/pnas.1501235112
- [6] Ş. Bilir, T. Kojidani, C. Mori, H. Osakada, S. Kobayashi, T. Koujin, Y. Hiraoka, and T. Haraguchi, “Roles of Nup133, Nup153 and membrane fenestrations in assembly of the nuclear pore complex at the end of mitosis,” Genes to Cells, Vol.24, No.5, pp. 338-353, 2019. https://doi.org/10.1111/gtc.12677
- [7] L. Sun, J. Wu, F. Du, X. Chen, and Z. J. Chen, “Cyclic GMP-AMP Synthase Is a Cytosolic DNA Sensor That Activates the Type I Interferon Pathway,” Science, Vol.339, No.6121, pp. 786-791, 2013. https://doi.org/10.1126/science.1232458
- [8] Q. Chen, L. Sun, and Z. J. Chen, “Regulation and Function of the cGAS–STING Pathway of Cytosolic DNA Sensing,” Nat. Immunol., Vol.17, No.10, pp. 1142-1149, 2016. https://doi.org/10.1038/ni.3558
- [9] M. S. Lee and R. Craigie, “A previously unidentified host protein protects retroviral DNA from autointegration,” Proc. Natl. Acad. Sci. U.S.A., Vol.95, No.4, pp. 1528-1533, 1998. https://doi.org/10.1073/pnas.95.4.1528
- [10] H. Chen and A. Engelman, “The barrier-to-autointegration protein is a host factor for HIV type 1 integration,” Proc. Natl. Acad. Sci. U.S.A., Vol.95, No.26, pp. 15270-15274, 1998. https://doi.org/10.1073/pnas.95.26.15270
- [11] M. Tsuchiya, H. Ogawa, T. Koujin, C. Mori, H. Osakada, S. Kobayashi, Y. Hiraoka, and T. Haraguchi, “p62/SQSTM1 promotes rapid ubiquitin conjugation to target proteins after endosome rupture during xenophagy,” FEBS Open Bio, Vol.8, No.3, pp. 470-480, 2018. https://doi.org/10.1002/2211-5463.12385
- [12] T. Haraguchi, T. Koujin, M. Segura-Totten, K. K. Lee, Y. Matsuoka, Y. Yoneda, K. L. Wilson, and Y. Hiraoka, “BAF is required for emerin assembly into the reforming nuclear envelope,” J. Cell Sci., Vol.114, No.24, pp. 4575-4585, 2001. https://doi.org/10.1242/jcs.114.24.4575
- [13] N. Lorén, J. Hagman, J. K. Jonasson, H. Deschout, D. Bernin, F. Cella-Zanacchi, A. Diaspro, J. G. McNally, M. Ameloot, N. Smisdom, M. Nydén, A.-M. Hermansson, M. Rudemo, and K. Braeckmans, “Fluorescence recovery after photobleaching in material and life sciences: Putting theory into practice,” Quarterly Reviews of Biophysics, Vol.48, No.3, pp. 323-387, 2015. https://doi.org/10.1017/S0033583515000013
- [14] B. Guey, M. Wischnewski, A. Decout, K. Makasheva, M. Kaynak, M. S. Sakar, B. Fierz, and A. Ablasser, “BAF restricts cGAS on nuclear DNA to prevent innate immune activation,” Science, Vol.369, No.6505, pp. 823-828, 2020. https://doi.org/10.1126/science.aaw6421
- [15] M. Du and Z. J. Chen, “DNA-Induced Liquid Phase Condensation of cGAS Activates Innate Immune Signaling,” Science, Vol.361, No.6403, pp. 704-709, 2018. https://doi.org/10.1126/science.aat1022
- [16] R. Zheng, R. Ghirlando, M. S. Lee, K. Mizuuchi, M. Krause, and R. Craigie, “Barrier-to-autointegration factor (BAF) bridges DNA in a discrete, higher-order nucleoprotein complex,” Proc. Natl. Acad. Sci. U.S.A., Vol.97, No.16, pp. 8997-9002, 2000. https://doi.org/10.1073/pnas.150240197
This article is published under a Creative Commons Attribution-NoDerivatives 4.0 Internationa License.