
Paper:
Electrically Induced Bubble-Assisted Substance Delivery into Intact Plant Cells and Tissues
Yuudai Aokusa*
 , Kei Tateishi*, Nobutoshi Ota*
, Mayu Nakahigashi*, Shigeaki Miura*, Yasuhiro Moriizumi**, So Makabe**, and Yoko Yamanishi*
*Department of Mechanical Engineering, Kyushu University
744 Motooka, Nishi-ku, Fukuoka, Fukuoka 819-0395, Japan
**BEX Corporation
2-61-14 Itabashi, Itabashi-ku, Tokyo 173-0004, Japan

Substance injection into plant cells is typically performed using protoplasts, in which the cell wall has been removed. However, the process of removing the cell wall imposes significant stress on the cells, making injection into tissue-like structures difficult. Injecting substances into plants not only streamlines plant breeding but also enables the introduction of sensors for detecting plant hormone responses, thereby facilitating the understanding and control of plant physiological states. This study proposes a method for injecting molecules into plants without removing the cell wall by utilizing the cavitation effect of electrically induced bubbles. The proposed device consists of a metal wire positioned inside a glass tube. By varying the diameter of the metal wire, the electrical and mechanical stimulation applied to the target can be controlled. Using this method, successful gene delivery was confirmed by fluorescence observation and RT-PCR analysis in plant cells (Tobacco BY-2 cells, Nicotiana tabacum L.) and plant tissue (Arabidopsis thaliana, hereafter referred to as Arabidopsis) without removing the cell wall. Considering the limited efficiency of gene delivery into plants using conventional electroporation, these results suggest that combining mechanical stimulation with electrical stimulation is an effective approach for substance delivery. Furthermore, because the delivery conditions can be tuned by adjusting the electrical and mechanical parameters, the proposed method has the potential to be applied to a wide range of plant and animal tissues.
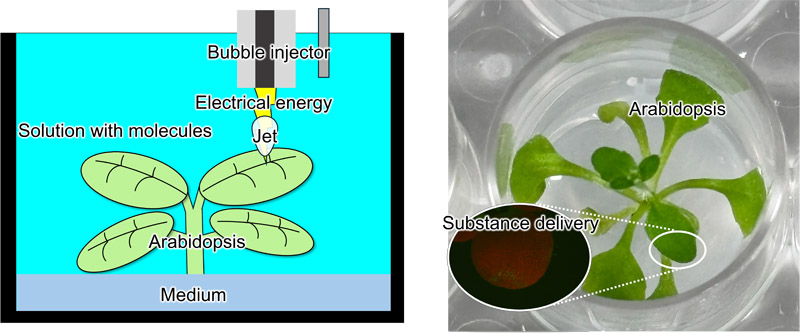
Substance delivery to plants by a bubble injector
1. Introduction
1.1. Background
The global population reached 7.7 billion in 2019 1,2. This rapid population growth is believed to contribute not only to environmental destruction and desertification but also to critical issues that threaten humanity’s survival, including energy depletion and food shortages. With respect to food, it has been argued that, to ensure human well-being, food production must increase at a rate that exceeds population growth 3. Amid the rising food demand accompanying population growth, the outlook for a food supply sufficient to meet future population increases remains uncertain because of various factors, including crop failures caused by climate change and increased demand for new crops such as biofuel feedstocks. In response to these projections, efforts are underway to develop crop varieties with higher yields or improved adaptability to harsh conditions through breeding. Additionally, sensors are being incorporated into crops to obtain hormonal information for optimizing growth control and evaluating responses to stress and environmental conditions 4.
Efficient molecular delivery into plant cells is a key technology supporting both plant breeding and plant sensing applications.
1.2. Methods for Introducing Substances
Methods for introducing substances such as genes or sensors into crops (plants) include the Agrobacterium-mediated method, which uses Agrobacterium, a pathogen that causes diseases in dicotyledonous plants 5,6; the electroporation method, which applies a high voltage to cells to create reparable micro-pores through which molecules are introduced 7; and the particle gun method 8,9, in which target molecules are adsorbed onto submicron-sized metal particles (e.g., gold or tungsten) and propelled at high speed using high-pressure helium or explosives to perforate cell tissues and introduce the molecules into cells.
The Agrobacterium-mediated method enables efficient and stable genetic transformation in plants susceptible to Agrobacterium infection 10. However, it presents challenges in plants resistant to infection, where transformation efficiency is lower, and substances other than genes are difficult to introduce. Electroporation creates pores in target cells to facilitate molecular delivery, enabling the introduction of substances other than genes. However, in plant cells, this method requires the preparation of protoplasts by removing the cell wall. Regenerating whole plants from protoplasts is impossible or inefficient 11,12. Furthermore, optimal conditions for cell wall removal and processing time must be determined for each cell type, making the procedure cumbersome. The particle gun method has the advantage of being applicable to a wide range of plant species, but it also has the drawback of causing substantial damage to the target tissue, resulting in low transformation efficiency 13. Therefore, understanding the respective contributions of electrical and mechanical stimuli is important for developing an effective transformation technology for plant cells and tissues.
In this study, we propose a novel method for forming perforations in plant cell walls and membranes to facilitate molecular delivery. The method combines mechanical stimulation imparted by the jet generated during the collapse of electrically induced bubbles with electrical stimulation from the voltage applied for bubble generation. First, the influence of device structure on the magnitude of the mechanical and electrical stimuli was investigated. Next, genes were introduced into plant cells and tissues, and differences in delivery characteristics associated with variations in device structure were evaluated.
2. Concept
Figure 1 shows the substance delivery system for plants proposed in this study. The system consists of a bubble injector with an active electrode (metal wire) inserted into a dielectric capillary, a counter electrode, an ionic solution containing the suspended substance, and a pulse power supply. When the bubble injector and counter electrode are immersed in the ionic solution and a pulsed voltage is applied, a high electric field is generated at the tip of the device 14. This rapidly increases the local temperature at the tip, resulting in bubble formation 15. The growth and collapse of these bubbles generate a jet 16,17. The mechanical stimulation from this jet impacting the target, combined with the electrical stimulation from the applied voltage, forms perforations in the cell walls and membranes of plant cells, thereby enabling the introduction of substances into the cells. This combined effect is expected to overcome the limitations of conventional electroporation for plant cells with rigid cell walls.
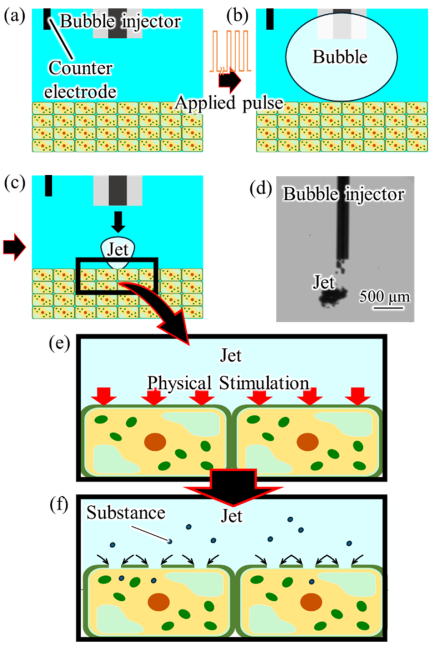
Fig. 1. Schematic illustration of the plant substance introduction system using jet-based mechanical stimulation and electrical stimulation. (a) The bubble injector and counter electrode are inserted into the ionic solution. (b) Bubbles are generated upon application of a pulsed voltage. (c) A jet is generated by bubble collapse and impacts the target. (d) Appearance of the generated jet. (e) Mechanical stimulation by the jet and electrical stimulation by voltage application are applied to the target. (f) Pores are formed in the cell wall and plasma membrane, enabling substance introduction.
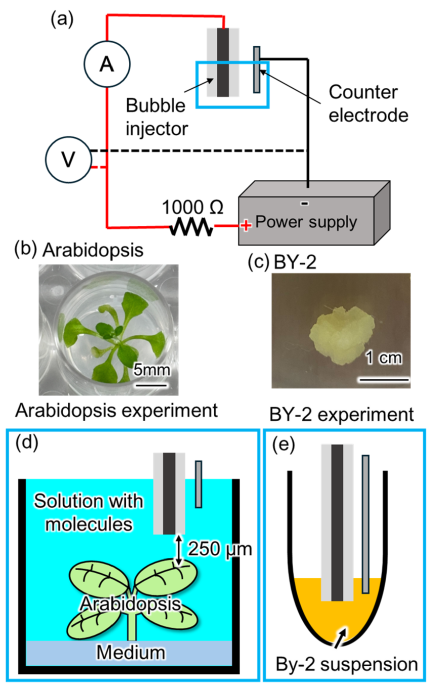
Fig. 2. Experimental setup. (a) Schematic diagram of the electrical circuit. (b) Arabidopsis after two weeks of cultivation. (c) BY-2 callus. (d) Experimental setup for Arabidopsis. The distance between the bubble injector and the target was 250 μm. (e) Experimental setup for BY-2 cells.
3. Experiments
3.1. Experimental Setup
The experimental setup is shown in Fig. 2. In this system, the voltage and current between the bubble injector and the counter electrode were measured using an oscilloscope (DS5614A, Iwatsu Electric Corporation, Japan). The behavior of the generated bubbles was observed using a high-speed camera (HPV-X2, Shimadzu Corporation, Japan). Arabidopsis and BY-2 cells were used as the targets for genetic transformation. A pulse power supply (PLT1500, BEX Corporation, Japan) was employed as the power source, forming an electrical circuit in which the bubble injector, counter electrode, and a 1 k\(\Omega\) resistor (HS75 1K J, Arcol, UK) were connected in series. The bubble injector was connected as the anode, while the counter electrode served as the cathode. The counter electrode was positioned 10–20 mm from the tip of the bubble injector and immersed approximately 10 mm into the solution. Because the counter electrode was located sufficiently far from the injector tip, the electric field distribution was primarily determined by the geometry in the vicinity of the injector tip 14. Therefore, the counter electrode could be approximated as an electrode located at an effectively infinite distance. The voltage waveform between the bubble injector and the counter electrode was measured using a high-voltage probe. The current waveform was measured using a current probe installed in the electrical circuit. Both voltage and current signals were recorded using an oscilloscope. The microscopy observation conditions were as follows. Fluorescence observations were performed using a stereomicroscope (SMZ800N, Nikon Corporation, Japan) equipped with a fluorescence adapter (OLFAS, BEX Corporation, Japan) and a Royal Blue excitation filter. A long-pass filter was used for fluorescence imaging. Band-pass filter observations were performed using an inverted microscope (ECLIPSE Ti series, Nikon Corporation, Japan). For green fluorescent protein (GFP) fluorescence observation, the inverted microscope was equipped with a GFP filter set. The optical characteristics of this filter set consisted of an excitation wavelength of 495 nm and an emission wavelength of 505 nm, corresponding to the absorption and emission peaks of GFP, respectively. All fluorescence images were captured under identical imaging conditions.
3.2. Genetic Transformation Experiments in Arabidopsis
The preparation procedure for the solid medium used for Arabidopsis culture is described as follows. First, 5 g of MES (MES, FUJIFILM Corporation, Japan) was dissolved in 80 mL of ultrapure water (hereinafter referred to as the MES solution). Next, 5.85 g of KOH was dissolved in 95 mL of ultrapure water. This solution was added dropwise to the MES solution to adjust the pH to 5.7, yielding the MES-KOH solution. In this study, 2 L of culture medium was prepared. One package of Murashige and Skoog Medium Mixed Salts (for 1 L, FUJIFILM Corporation, Japan), 10 mL of MES-KOH solution, 200 mg of myo-inositol, 20 g of sucrose, and 30 g of agar powder were added. The total volume was adjusted to 2 L with ultrapure water. The resulting mixture was sterilized by autoclaving at 120°C for 20 min. After sterilization, 2 mL of the medium was dispensed into each well of a 24-well plate (Multiple Well Plate, 24-well, flat bottom, Corning) and allowed to cool and solidify at room temperature. Arabidopsis seeds were surface-sterilized before sowing. The seeds were placed in a tube, and 1 mL of 70% ethanol was added. The suspension was mixed by pipetting and allowed to stand for 15 min. The ethanol was then removed, and 1 mL of 90% ethanol was added. After mixing by pipetting, the suspension was allowed to stand for 10 min. The ethanol was then removed, and one seed was sown onto the surface of the medium in each well. After seeding, the plates were sealed, wrapped with aluminum foil to protect them from light, and stored at 5°C for at least 3 days for cold treatment. Following the cold treatment, the plates were transferred to an incubator (LH-60PFD12-DT, Nippon Medical & Chemical Instruments Corporation, Japan) and cultured at 22°C under a 14 h light period for 2 weeks (Fig. 2(a)).
The transformation solution was prepared as follows. For simplicity, 2 L of solution was prepared in this study. One package of Murashige and Skoog Medium Mixed Salts was added, together with KCl and mannitol to achieve final concentrations of 0.2 mol/L and 1 mol/L, respectively. The total volume was adjusted to 2 L with ultrapure water. A plasmid solution (pCR4_p35S::\(\Omega\)::GFP, pCR4_p35S::\(\Omega\)::GFP-NLS, BEX Corporation, Japan) was added to the wells containing cultured Arabidopsis at a final concentration of 100 μg/mL. One Arabidopsis plant cultured in a single well was defined as one sample. Using the bubble injector, bubbles were generated twice, and a jet stream was applied once to each of the two true leaves to achieve genetic transformation. After treatment, the samples were observed using a fluorescence microscope equipped with a long-pass filter. Subsequently, the presence or absence of gene expression was confirmed by reverse transcription PCR (RT-PCR), as described later. Transformation efficiency was calculated as the percentage of wells exhibiting gene expression among the total number of Arabidopsis plants (4 wells) subjected to transformation in each experiment. The experiment was repeated three times, and the average value was used as the transformation efficiency.
3.3. RT-PCR Method
First, total RNA was isolated from Arabidopsis. The leaves were homogenized using a BioMasher II (Nippi, Japan). The Arabidopsis leaves were placed into the BioMasher II tube, and 10 μL of RAI solution from the RNA isolation kit (NucleoSpin RNA Plant, Macherey-Nagel, Germany) was added. The pestle was then rotated manually to crush the leaf tissue. Subsequently, RNA was isolated from the resulting leaf lysate using the RNA isolation kit according to the manufacturer’s instructions. The cDNA Synthesis Kit (PrimeScript II 1st Strand cDNA Synthesis Kit, Takara Bio, Japan) was used to convert the isolated RNA into cDNA (reverse transcription reaction). For cDNA library construction, oligo(dT) primers were used to prime cDNA synthesis. PCR amplification of the first-strand cDNA was performed using oligo(dT) primers with a TaKaRa PCR Thermal Cycler Dice Standard TP650. A 10 μL reaction was performed in a 0.2 mL PCR tube by combining 1 μL of mRNA (100–250 ng), 1 μL of 10 mM each dNTP, 1 μL of 50 μM oligo(dT), and RNase free water to make up the final volume. The tube was incubated at 65°C for 5 min. It was then removed and immediately chilled on ice. To the mixture, 4 μL of 5\(\times\) PrimeScript™ II Buffer, 0.5 μL of RNase Inhibitor (40 U/μl), and 1 μl of PrimeScript™ II RTase (200 U/μl) were added. The reaction was performed at 42°C for 60 min, followed by enzyme inactivation by incubation at 95°C for 5 min and subsequent cooling on ice.
PCR amplification of GFP and Actin was performed using gene-specific primers and cDNA as the template with a thermocycler (TP650). The reaction mixture consisted of 5 μL of KOD One PCR Master Mix (TOYOBO, Japan), 0.5 μL of a gene-specific primer mix (BEX Co., Ltd.), 1 μL of template cDNA, and distilled water to make up a final volume of 10 μL. PCR was programmed for 30 cycles consisting of denaturation at 98°C for 10 s, annealing at 60°C for 5 s, and elongation at 68°C for 10 s, followed by cooling on ice. After the reaction, one-tenth of the assay mixture was subjected to agarose gel electrophoresis (Mupid®-2plus, ADVANCE Co., Japan) using 1\(\times\) TAE buffer following the usual procedure. The size and amounts of the PCR products were estimated by analyzing 1 μL samples using 1.5% agarose gel (wt/vol) electrophoresis followed by GelRed staining (Biotium, Inc., U.S.A.).
3.4. Genetic Transformation Experiments in BY-2 Cells
For simplicity, 100 mL of solid medium was prepared in this study. First, two bags of Murashige and Skoog Medium Mixed Salts were dissolved in ultrapure water at a rate of two bags per 1 L, and 50 mL of the resulting solution was aliquoted.
Next, 3 g of sucrose, 400 mg of myo-inositol, and 4 mg of thiamine hydrochloride were dissolved in ultrapure water to prepare a total volume of 10 mL, and 250 μL of this solution was added. Subsequently, 250 μL of an 80 mg/mL KH\(_2\)PO\(_4\) solution and 45.2 μL of a 2 mmol/L 2,4-dichlorophenoxyacetic acid (2,4-D) solution were added. The 2,4-D solution was prepared by dissolving the compound in a small amount of ethanol, followed by dilution to the desired volume with ultrapure water. Next, 0.7 g of agar powder was added, and the total volume was adjusted to 100 mL with ultrapure water. The pH was then adjusted to 5.7 using KOH, and the mixture was sterilized by autoclaving at 120°C for 20 min. After sterilization, the solution was dispensed into Petri dishes and allowed to cool at room temperature until solidified.
After solidification, approximately one teaspoon of BY-2 cells was inoculated onto the surface of the medium and cultured at 25°C in an incubator (Personal Cool Incubator, Nippon Medical Instrument Corporation, Japan). When liquid medium was used, it was prepared using the same composition but without agar. Approximately 4 teaspoons of callus from the cultured BY-2 cells were collected and suspended in 1 mL of liquid medium. The suspension was then centrifuged at \(500 \times g\) for 5 min using a centrifuge (Tabletop Refrigerated Centrifuge Model 2000, Kubota Corporation, Japan).
After centrifugation, the supernatant was carefully removed without aspirating the cells. Subsequently, 240 μL of transformation solution was added to adjust the cell suspension volume to approximately 500 μL. Then, 5 μL of plasmid solution was added to achieve a final concentration of 100 μg/mL. After thorough mixing by pipetting, the suspension was aliquoted into four PCR tubes at 30 μL per tube. In this study, each PCR tube was treated as a single sample. Transformation was subsequently performed by introducing bubbles into each suspension 10 times using a bubble injector. After treatment, the cells were cultured under static conditions for one day and then observed using a fluorescence microscope equipped with a bandpass filter and a long-pass filter. Transformation was defined as “present” if one or more fluorescently expressing cells were observed within a single sample. Transformation efficiency was calculated as the percentage of samples exhibiting fluorescent expression among the four samples subjected to transformation in each experiment. This experiment was repeated three times, and the average value was used as the transformation efficiency.
3.5. Power Supply Condition
The power supply conditions used to generate a single bubble are shown in Fig. 3. The applied voltage, pulse width, and pulse interval were set to 700 V, 10 μs, and 2 μs, respectively. A single bubble was generated by applying electrical pulses to the bubble injector 25 times under these conditions.
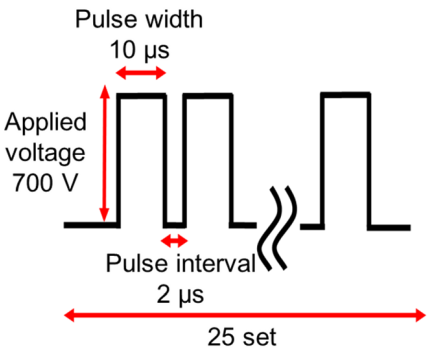
Fig. 3. Electrical power supply conditions.
4. Results
4.1. Bubble Growth Behavior
In this study, two types of bubble injectors were used. The first consisted of a glass tube with an outer diameter of 1010 μm and an inner diameter of 500 μm, into which a tungsten wire with a diameter of 400 μm was inserted, with the tip positions aligned (hereafter referred to as the electrical injector). The second consisted of a glass tube with an outer diameter of 300 μm and an inner diameter of 110 μm, into which a tungsten wire with a diameter of 100 μm was inserted, with the tip positions aligned (hereafter referred to as the mechanical injector). The rationale for referring to these as the electrical injector and the mechanical injector is described in Section 4.2.
Figure 4 shows the bubble injector tip and the bubble growth process observed using a high-speed camera for the electrical injector, whereas Fig. 5 shows the corresponding results for the mechanical injector. The figures also display the bubble growth curve over time together with the time-dependent changes in voltage and current between the bubble injector and the counter electrode. As shown in Figs. 4 and 5, the electrical injector generated bubbles with a smaller maximum volume than the mechanical injector, whereas the time required for bubble generation was longer. These results indicate that, in the electrical injector, the active tungsten wire electrode remained in contact with the solution for a longer period, delaying bubble-induced current interruption (Fig. 4(b), 0.15 ms; Fig. 5(b), 0.01 ms). Consequently, a state conducive to current flow was maintained. This result indicates that the electrical injector consumed a larger amount of electrical energy during bubble generation. Furthermore, the larger bubble observed with the mechanical injector may be attributed to the earlier onset of electrical discharge. Previous studies have reported that electrical discharge occurs when the tip of the tungsten wire becomes completely covered by a bubble 18,19. Because the thinner tungsten wire used in the mechanical injector was covered by the bubble more rapidly than that used in the electrical injector, electrical discharge was considered to occur earlier. As electrical discharge supplied additional energy for bubble expansion, the earlier onset of discharge may have contributed to the larger maximum bubble volume observed with the mechanical injector.
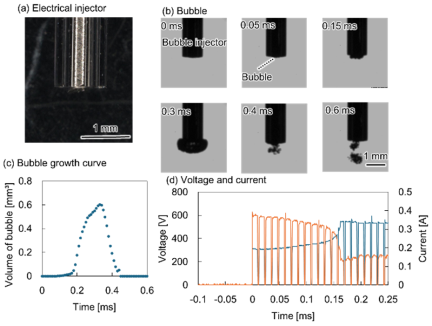
Fig. 4. Electrical injector. (a) Bubble injector consisting of a tungsten wire (diameter: 400 μm) inserted into a glass tube (outer diameter: 1010 μm; inner diameter: 500 μm), with the tips aligned. (b) Bubble condition at the injector tip. (c) Bubble growth curve. (d) Voltage and current waveforms measured between the bubble injector and the counter electrode. Blue line: voltage; orange line: current.
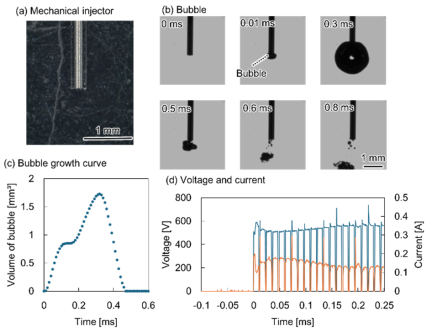
Fig. 5. Mechanical injector. (a) Bubble injector consisting of a tungsten wire (diameter: 100 μm) inserted into a glass tube (outer diameter: 300 μm; inner diameter: 110 μm), with the tip aligned. (b) Bubble condition at the injector tip. (c) Bubble growth curve. (d) Voltage and current waveforms measured between the bubble injector and the counter electrode. Blue line: voltage; orange line: current.
4.2. Quantification of Electrical and Mechanical Stimuli
As described in Section 4.1, the terms “electrical injector” and “mechanical injector” are used throughout this study for convenience. The electrical injector denotes the injector exhibiting relatively higher current magnitude and electrical energy, whereas the mechanical injector denotes the injector exhibiting relatively higher kinetic energy. These designations are intended solely to distinguish the dominant characteristics of the injectors and do not imply a complete separation of electrical and mechanical effects.
To quantify the stimulus levels delivered by the electrical injector and mechanical injector, the electrical stimulus was characterized in terms of electrical energy, while the mechanical stimulus was characterized in terms of kinetic energy.
Electrical energy \(E_{e}\) was calculated using Eq. (1):
On the other hand, the kinetic energy \(E_{k}\) was calculated using Eq. (2):
The jet mass, m, was calculated from the solution density and the maximum bubble volume. It was assumed that, upon bubble collapse, a volume of solution equal to the maximum bubble volume is drawn into the tip of injector and forms the jet. Accordingly, the jet mass \(m\) is expressed by Eq. (3):
Substituting Eq. (3) into Eq. (2) yields Eq. (4).
From Eq. (1), the electrical energy \(E_{e}\) supplied during bubble generation was calculated to be 0.024 J for the electrical injector and 0.019 J for the mechanical injector. In contrast, the kinetic energy \(E_{k}\) imparted to the target by the bubble injector was calculated using Eq. (4). Although the jet velocities of the electrical and mechanical injectors were nearly identical (5\(\pm\)0.2 m/s and 5\(\pm\)0.3 m/s, respectively), the kinetic energies differed because of the difference in the maximum bubble volume \(V_{b}\). As a result, the kinetic energy was calculated to be 6.25 μJ for the electrical injector and 22.5 μJ for the mechanical injector. Therefore, the electrical injector delivered a greater amount of electrical energy to the system.
4.3. Results of Genetic Transformation Experiments in Arabidopsis
The results of the genetic transformation experiments in Arabidopsis are shown in Fig. 6. Figs. 6(a) and (b) show fluorescence images of Arabidopsis obtained after the experiments. In Fig. 6(b), green fluorescence, presumed to indicate GFP expression, was observed within the region outlined by the black line. However, similar green fluorescence was occasionally observed in the control samples. This fluorescence is likely attributable to the autofluorescence of plant tissues. Therefore, gene expression analysis was performed following RNA isolation and cDNA synthesis, and the results are shown in Fig. 6(c). Fig. 6(c) shows the amplification band obtained using gene-specific primers. Lanes 1, 3, 5, and 7 correspond to amplification with Actin primers, whereas lanes 2, 4, 6, and 8 correspond to amplification with GFP primers. The Actin primers produced a 657-bp amplicon and were used as a positive control for RNA isolation and RT-PCR. Lanes 1, 2, 5, and 6 represent PCR reactions performed using RNA extracted from the plant samples as the template. In contrast, lanes 3, 4, 7, and 8 represent PCR reactions performed using cDNA synthesized by reverse transcription of RNA extracted from the plant samples as the template. Lanes 1–4 correspond to the control samples, which were not subjected to genetic transformation, whereas lanes 5–8 correspond to the transformed samples. These results suggest that GFP was expressed in the transformed cells. Furthermore, as shown in Fig. 6(c), samples in which the 720-bp band was detected in lane 8 were defined as having undergone “successful transformation of GFP.” The transformation efficiencies calculated based on this criterion are shown in Fig. 6(d). Comparison of the electrical and mechanical injectors revealed that the electrical injector achieved a higher gene transformation efficiency in Arabidopsis.
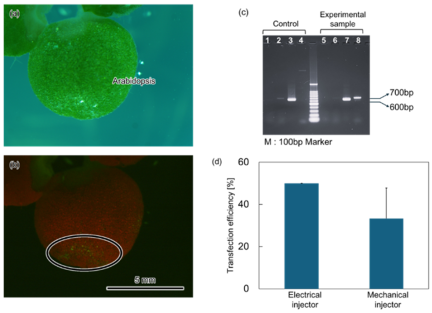
Fig. 6. Results of genetic transformation in Arabidopsis. (a) Bright-field image. (b) Fluorescence image acquired using a long-pass filter. (c) Agarose gel electrophoresis of PCR products obtained from the control and transformed samples. (d) Comparison of the genetic transformation efficiencies achieved using the electrical injector and the mechanical injector.
4.4. Results of Genetic Transformation Experiments in BY-2 Cells
The results of the genetic transformation experiments in BY-2 cells are shown in Fig. 7. Fig. 7(a) shows fluorescence microscopy images acquired using a long-pass filter. Green fluorescence was observed within the cells in the region indicated by the red frame. Higher-magnification observations of this region obtained using a band-pass filter and a 20\(\times\) objective lens are shown in Figs. 7(b) and (c). As shown in Fig. 7(c), BY-2 cells exhibiting bright fluorescence throughout the cell were observed. Subsequently, genetic transformation experiments were performed on BY-2 cells using both the electrical injector and the mechanical injector. The transformation efficiencies obtained with the two injectors are compared in Fig. 7(d). As shown in Fig. 7(d), the electrical injector achieved a higher transformation efficiency in BY-2 cells than the mechanical injector.
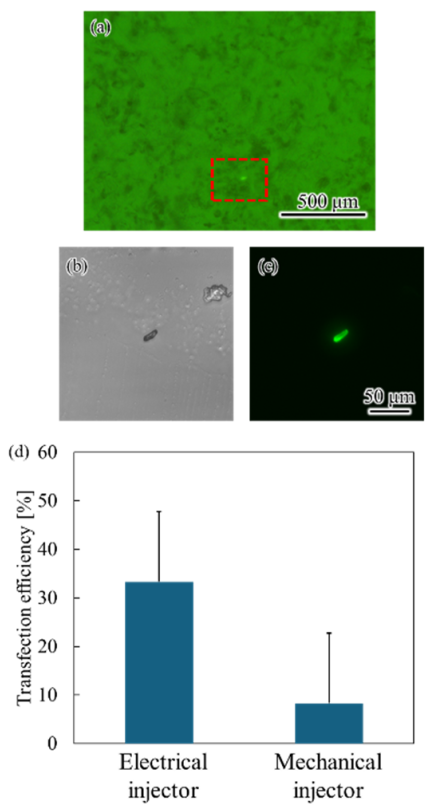
Fig. 7. Results of genetic transformation experiments in BY-2 cells. (a) Fluorescence image acquired using a long-pass filter. (b) Bright-field image. (c) Fluorescence image acquired using a band-pass filter. (d) Comparison of the genetic transformation efficiencies achieved using the electrical injector and the mechanical injector.
5. Discussion
This study focused on the development of a method for genetic transformation in plants and proposed a novel transformation technique that combines jets generated by the collapse of electrically induced bubbles with electrical stimulation. By varying the diameters of the tungsten wire and the bubble injector, the electrical and mechanical energies applied to the target can be controlled. In addition, the injector geometry influenced the bubble growth process. The mechanical injector produced larger bubbles, which may be attributable to the earlier onset of discharge resulting from more rapid bubble coverage of the thinner tungsten wire. Genetic transformation experiments in BY-2 cells and Arabidopsis demonstrated that the injector exhibiting a higher current magnitude and greater electrical energy achieved a higher transformation efficiency than the injector generating larger kinetic energy. Because the plant tissue was positioned between the bubble injector and the counter electrode, electrical current was presumed to pass through the plant tissue along the applied electric field during voltage application. Therefore, the higher current magnitude observed for the electrical injector may have contributed to its superior transformation efficiency.
This effect is thought to occur because, similar to electroporation, electrical stimulation increases cell membrane permeability. However, previous studies have reported that, in plant cells, the presence of the cell wall surrounding the cell membrane limits the transformation efficiency achievable by electrical stimulation alone 11,12,20. Therefore, although electrical stimulation enhances membrane permeability, a mechanical driving force is still required to facilitate the introduction of substances into the cell interior. In the proposed method, the kinetic energy of the jet generated by bubble collapse is thought to produce a flow that generates the cell wall, thereby facilitating the transport of substances through the openings formed in the cell membrane. These findings suggest that electrical energy is the primary factor governing transformation efficiency, whereas kinetic energy functions as an auxiliary factor that promotes intracellular substance transport.
6. Conclusion
This study proposes a genetic transformation method for plants that combines jets generated by the collapse of electrically induced bubbles with electrical stimulation. Genetic transformation experiments using BY-2 cells and Arabidopsis thaliana demonstrated that electrical energy is the primary factor governing transformation efficiency, whereas the kinetic energy of the jets plays a supplementary role in facilitating the introduction of substances into cells. Furthermore, this method enables genetic transformation of plant tissues through a simple procedure without requiring cumbersome pretreatments, such as protoplast preparation. Notably, in the electrical injector, electrical energy was the dominant factor influencing transformation efficiency regardless of the jet momentum, which is considered to contribute to the higher transformation efficiency achieved by this injector. In summary, the proposed method provides an effective approach for achieving efficient genetic transformation in plants by primarily utilizing electrical stimulation supplemented with mechanical stimulation. Future optimization of the electrical and mechanical stimulation conditions may enable the development of a substance delivery technique tailored to specific plant tissues. Although this study demonstrated gene delivery, the proposed method is not limited to nucleic acids and has the potential to introduce a wide range of substances, including functional sensors, proteins, crystalline or particulate materials.
Acknowledgments
This work was supported by JST Moonshot R&D (JPMJMS2217-3-1) and JSPS KAKENHI Grant Number JP 25K24703, and Japan patent JP5526345.
- [1] J. D. Durand, “The Modern Expansion of World Population,” Proc. Am. Philos. Soc., Vol.111, No.3, pp. 136-159, 1967.
- [2] E. S. Deevey Jr., “The Human Crop,” Sci. Am., Vol.195, No.4, pp. 105-115, 1956. https://doi.org/10.1038/SCIENTIFICAMERICAN0456-105
- [3] T. Malthus, “An Essay on the Principle of Population, as it Affects the Future Improvement of Society, with Remarks on the Speculations of Mr. Godwin, M. Condorcet, and Other Writers,” K. A. Morrison (Ed.), “Charity and Philanthropy in Nineteenth-Century Britain,” Routledge, 2025.
- [4] K. Jiang and T. Asami, “Chemical regulators of plant hormones and their applications in basic research and agriculture,” Biosci. Biotechnol. Biochem., Vol.82, No.8, pp. 1265-1300, 2018. https://doi.org/10.1080/09168451.2018.1462693
- [5] J. R. Zupan and P. Zambryski, “Transfer of T-DNA from Agrobacterium to the plant cell,” Plant Physiol., Vol.107, No.4, pp. 1041-1047, 1995. https://doi.org/10.1104/pp.107.4.1041
- [6] S. Sabu, S. Khanam, and A. J. Subitsha, “Agrobacterium-Mediated Transformation in Oryza Sativa (Rice) to Improve Crop Yield: A Review,” Int. J. of Scientific Research and Engineering Development, Vol.3, No.6, pp. 762-770, 2020.
- [7] X. Du, J. Wang, Q. Zhou, L. Zhang, S. Wang, Z. Zhang, and C. Yao, “Advanced physical techniques for gene delivery based on membrane perforation,” Drug Delivery, Vol.25, No.1, pp. 1516-1525, 2018. https://doi.org/10.1080/10717544.2018.1480674
- [8] Y. Acanda, C. Wang, and A. Levy, “Gene Expression in Citrus Plant Cells Using Helios® Gene Gun System for Particle Bombardment,” A. F. Catara, M. Bar-Joseph, and G. Licciardello (Eds.), “Citrus Tristeza Virus: Methods and Protocols,” pp. 219-228, Springer, 2019. https://doi.org/10.1007/978-1-4939-9558-5_16
- [9] P. Vain, N. Keen, J. Murillo, C. Rathus, C. Nemes, and J. J. Finer, “Development of the Particle Inflow Gun,” Plant Cell Tissue Organ Cult., Vol.33, No.3, pp. 237-246, 1993. https://doi.org/10.1007/BF02319007
- [10] K. Akama, H. Shiraishi, S. Ohta, K. Nakamura, K. Okada, and Y. Shimura, “Efficient transformation of Arabidopsis thaliana: Comparison of the efficiencies with various organs, plant ecotypes and Agrobacterium strains,” Plant Cell Rep., Vol.12, No.1, pp. 7-11, 1992. https://doi.org/10.1007/BF00232413
- [11] M. R. Davey, P. Anthony, K. C. Lowe, and J. B. Power, “Plant protoplast technology: Current status,” Acta Physiol. Plant., Vol.26, No.3 suppl., pp. 245-246, 2004.
- [12] T. Eeckhaut, P. S. Lakshmanan, D. Deryckere, E. Van Bockstaele, and J. Van Huylenbroeck, “Progress in plant protoplast research,” Planta, Vol.238, No.6, pp. 991-1003, 2013. https://doi.org/10.1007/s00425-013-1936-7
- [13] A. B. Ghaghelestany, A. Jahanbakhshi, and E. Taghinezhad, “Gene transfer to German chamomile (L chamomilla M) using cationic carbon nanotubes,” Sci. Hortic., Vol.263, Article No.109106, 2020. https://doi.org/10.1016/j.scienta.2019.109106
- [14] Y. Yamashita, S. Sakuma, and Y. Yamanishi, “On-Demand Metallization System Using Micro-Plasma Bubbles,” Micromachines, Vol.13, No.8, Article No.1312, 2022. https://doi.org/10.3390/mi13081312
- [15] K. Ichikawa, N. Basaki, Y. Yamashita, and Y. Yamanishi, “Plasma-Induced Bubble Microjet Metallization of Elastomer,” Micromachines, Vol.10, No.6, Article No.389, 2019. https://doi.org/10.3390/mi10060389
- [16] K. Ichikawa, S. Maeda, and Y. Yamanishi, “Evaluation of Invasiveness by Breakdown Phenomena of Electrically Induced Bubbles for a Needle-Free Injector,” J. Microelectromechanical Syst., Vol.27, No.2, pp. 305-311, 2018. https://doi.org/10.1109/JMEMS.2018.2793314
- [17] Y. Ma, W. Huang, N. Tottori, and Y. Yamanishi, “Development of Repetitive Mechanical Oscillation Needle-Free Injection through Electrically Induced Microbubbles,” Cyborg and Bionic Systems, Vol.6, Article No.0225, 2025. https://doi.org/10.34133/cbsystems.0225
- [18] Y. Aokusa et al., “A needle-free bubble injector enabling depth-controlled isotropic and anisotropic perforation using electrically induced bubbles and heat generated by electric discharge,” Biomedical Microdevices, Vol.28, No.2, Article No.45, 2026. https://doi.org/10.1007/s10544-026-00819-9
- [19] Y. Minami et al. “Synthesis of Alumina Nanoparticles Using Plasma-Induced Microbubbles,” Micromachines, Vol.17, No.5, Article No.527, 2026. https://doi.org/10.3390/mi17050527
- [20] H. R. Azencott, G. F. Peter, and M. R. Prausnitz, “Influence of the Cell Wall on Intracellular Delivery to Algal Cells by Electroporation and Sonication,” Ultrasound Med. Biol., Vol.33, No.11, pp. 1805-1817, 2007. https://doi.org/10.1016/j.ultrasmedbio.2007.05.008
This article is published under a Creative Commons Attribution-NoDerivatives 4.0 Internationa License.