
Paper:
Method for Evaluating Cell Deformability Using Forced Flow Cessation in Microchannels
Mitsuhiro Horade*,†
 , Kotaro Tsujimoto*, and Hiroaki Ito**
*Faculty of Science and Engineering, Setsunan University
17-8 Ikeda-nakamachi, Neyagawa, Osaka 572-8508, Japan
†Corresponding author
**Chiba University
1-33 Yayoicho, Inage-ku, Chiba, Chiba 263-8522, Japan

The characteristics of red blood cells (RBCs) strongly correlate with disease, making measurement techniques valuable for diagnostics. This study focused on RBC deformability and developed an image-based evaluation method using a microfluidic device that applies stress by forcibly stopping flow. Unlike biochemical analyses, such as polymerase chain reaction, which provide averaged data, this method enables single-cell mechanical property assessment. It is also simple, requiring minimal specialized equipment and manual operation. RBCs were confirmed to deform upon forced stopping. We discussed deformation behavior and load estimation, confirming that wall shear stress, not inertial force, dominates deformation. Normal RBCs deformed by 31.5%, whereas adenosine triphosphate (ATP)-depleted RBCs, modeling diseased states, deformed by only 11.1%. The difference was statistically significant (p=0.025). We validated reproducibility by quantifying variability from manual syringe operation, showing consistent deformation measurements across operators. Sensitivity analyses confirmed that assumptions in shear stress estimation, such as gap size and viscosity, had minimal impact. The deformation metric was defined and shown to be robust against image processing variations. Statistical rigor was improved by adding effect sizes, confidence intervals, and power analysis. We discussed the biological relevance and limitations of the ATP depletion model, noting the need for validation with pathological samples. Finally, we highlighted the method’s contribution to intracellular sensor research, positioning mechanical deformability assessment as complementary to molecular intracellular sensing. These results suggest the potential of the method for evaluating blood diseases and related conditions.
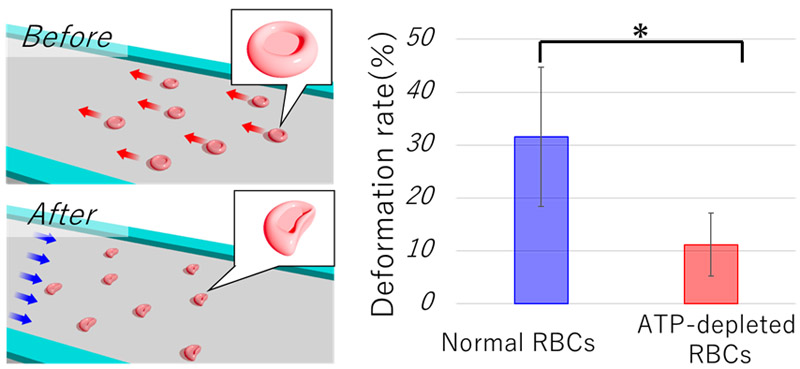
Comparison of RBC images before and after deformation
1. Introduction
Numerous studies have been conducted to measure cellular characteristics to obtain insights into cellular behavior and disease prediction 1,2,3. In the case of the red blood cells (RBCs) used in this experiment, a strong correlation has been reported between the characteristics of RBCs and diseases 4,5,6. A representative example is blood testing 7,8,9, in which established methods evaluate blood components, such as blood glucose levels and hemoglobin concentration 10,11,12. In this study, we focused on the cellular characteristics that could not be detected through component-based analyses, specifically the mechanical properties of individual cells. The reason for focusing on individuals is that it is known that cells have individuality 13,14,15. For example, variations in cell size, deformability, and growth have been reported at the single-cell level 16,17,18. Furthermore, with an increasing number of reports indicating the existence of individuality within cells, there has been a recent increase in reports on cell sorting techniques for isolating and collecting specific cells 19,20. This growing interest highlights the importance of single-cell analysis techniques that can capture heterogeneity that is otherwise masked by population-averaged methods 21,22.
In this study, we evaluated the deformability of individual RBCs as specific measurement targets. The reason for focusing on the deformability of RBCs is that their size and deformability are strongly correlated with diseases 23,24. For instance, vascular occlusion caused by blood cells is considered a factor that leads to cardiovascular and cerebrovascular diseases 25. Even if only one of 10000 RBCs has poor deformability, it may cause vascular blockage. Therefore, measuring individual deformability, which cannot be captured by average-based evaluations such as polymerase chain reaction or genetic analysis, represents a unique research approach. For a specific approach for measuring deformability, we investigated an approach in which a load was applied to RBCs, and the deformation was evaluated based on image information. This requires the establishment of a cell manipulation technology that enables highly reproducible operations and load applications. Previous studies have reported high-precision cell manipulation techniques using robotic arms 26,27 and methods using microfluidic devices to apply loads with high throughput 28,29. Various deformation-inducing approaches using microfluidic devices have been demonstrated, including constriction-based 30, shear-flow-based 31, and optical stretching techniques 32. In contrast, the present method features a simpler fabrication process and minimal equipment requirements, which may enable robust and reproducible single-cell deformability measurements with a relatively high throughput, positioning it as a potentially distinctive and valuable approach in this field. Furthermore, this study contributes to this special issue by advancing microfluidic measurement technologies that integrate mechanical loading with image-based sensing, enabling label-free, sensor-based cellular analysis with high throughput and practical accessibility.
This study is based on measuring the characteristics of individual cells using microfluidic devices. However, by optimizing the channel design, we considered shapes that did not require line-width fabrication on a one-digit micron scale. Additionally, the manipulation method was designed manually. The key technical features of this study are as follows: (1) a microchannel design with low fabrication complexity and (2) a simple manipulation method that does not require specialized skills. This is a novel and useful single-cell deformability evaluation technique that combines high practicality and excellent reproducibility. It can be fabricated with submillimeter-level precision, requiring only minimal semiconductor processing equipment, which offers advantages in terms of cost and ease of manufacture. Additionally, multiple cells within the field of view of the microscope can be measured simultaneously, enabling relatively high throughput while maintaining reproducible measurements. Furthermore, advances in single-cell genomic technologies have enabled molecular-level single-cell analyses 21,22. However, the method presented in this paper applies mechanical loading to directly assess the physical properties of cells, providing information distinct from molecular analyses. Therefore, these approaches are complementary 33.
2. Materials and Methods
2.1. Device Concept
RBCs have a biconcave disk shape with a diameter of approximately 7–8 μm and a thickness of approximately 2 μm at the periphery and approximately 1 μm at the central concave region. This characteristic morphology underpins our device concept of a microfluidic channel designed to evaluate RBC deformability by observing its behavior as it passes through a narrow constriction. The device geometry aims to induce measurable deformation while minimizing artifacts, such as cell tilting or wall effects.
Figure 1 illustrates the experimental setup. As shown in Fig. 1(a), the cell suspension flowed from the inlet well on the right side to the outlet well on the left side. An opposing flow was generated from the outlet side, causing the cells to decelerate rapidly or reverse their flow, as shown in Fig. 1(b). This flow manipulation applied a mechanical load to the cells within the microfluidic channel, inducing observable deformations.
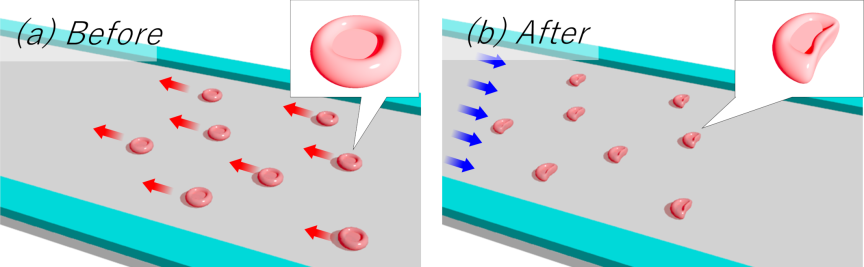
Fig. 1. Schematic of the experimental concept. (a) State before load application. The cell suspension flows through the channel in the microfluidic device from right to left, as shown in the diagram above. (b) State during load application. A reverse flow is generated from left to right to forcibly apply a load. RBCs in the suspension temporarily stop and then move in the reverse direction. The image corresponding to the maximum deformation is analyzed.
2.2. Design Rationale
Based on preliminary experiments and previous reports, the channel height was fixed at 2.0 μm to prevent RBC tilting along the height direction, which complicates the deformation analysis. Although a height of 20 μm suppressed tilt, deformation became less pronounced, complicating evaluation. The RBC deformation is also smaller near the channel walls; therefore, a sufficiently wide channel is preferred to reduce wall effects. However, excessively wide channels risk sagging of the ceiling, which may contact the glass substrate, given the low channel height.
Through prototyping, a channel width of 200 μm was confirmed to maintain a stable height of 2.0 μm without sagging. RBCs were observed in an 80 μm region near the center where wall influence was minimal. The channel had a simple straight geometry with a distance of 10.0 mm between the inlet and outlet wells. Fig. 2(a) shows the channel dimensions, including a height of 2.0 μm, a width of 200 μm, a length of 10 mm, and a central observation region of 80 μm.
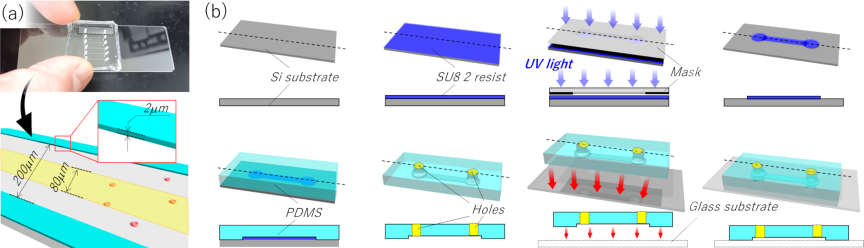
Fig. 2. Schematic of the microfluidic device. (a) Dimensions of the microfluidic device. The channel has a straight geometry with a height of 2.0 μm, a width of 200 μm, and a length of 10 mm. RBCs passing through the central 80 μm region are analyzed. (b) Fabrication process. A resist is coated to a thickness of 2.0 μm, and the channel pattern is created via photolithography. The device is then molded using PDMS, and two wells are punched. Finally, the PDMS is bonded to a glass substrate.
2.3. Device Fabrication
Figure 2(b) shows the fabrication process. The device was fabricated using soft lithography. SU-8 2 resist (Kayaku Advanced Materials Inc., Tokyo, Japan) was spin-coated to a thickness of 2.0 μm and patterned via photolithography to define the channel geometry. Polydimethylsiloxane (PDMS) (Silpot 184, DuPont Toray Specialty Materials K.K.) was molded onto the master and peeled off after curing. Inlet and outlet wells (1.5 mm diameter) were created by punching the PDMS. Bonding to a glass substrate was achieved via air plasma treatment using a hydrophilization device (PIB-20, Vacuum Device Inc., Ibaraki, Japan) at a vacuum of 90 Pa and a current of 40 mA for 30 s, followed by thermal bonding at 95 °C for 5 min. To enable a high-magnification observation of RBCs (7–8 μm diameter), a thin glass substrate (0.13–0.16 mm thick) was used to minimize the working distance of the microscope objective.
2.4. Experimental Setup
The experimental system (Fig. 3) consisted of an inverted microscope (IX-73, Evident Corporation, Tokyo, Japan), a microfluidic device, a syringe pump (MSPE-1, AS ONE Corporation, Osaka, Japan), and a high-speed camera (HAS-U2, DITECT Co., Ltd., Tokyo, Japan). The cell suspension was injected into the inlet well via tubing connected to a syringe pump. This setup maintained a steady flow, and air was introduced at the outlet. Imaging was performed at a resolution of \({1280\times 768}\) pixels and 500 fps, with a shutter speed of \(1/10000\) s to avoid motion blur. The spatial resolution was 0.119 μm/pixel, which is sufficient for RBC deformation analysis and comparable to or better than the resolutions reported in previous studies 34, ensuring accurate quantification of subtle morphological changes.
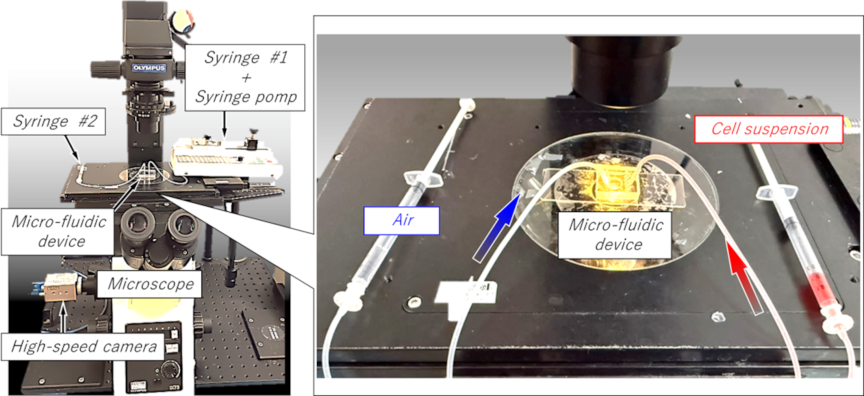
Fig. 3. External view of the experimental equipment. The main components are an inverted microscope, a microfluidic device, a high-speed camera, and a syringe pump. One syringe injects the cell suspension, with the syringe pump controlling the flow rate. The other syringe is filled with air and is used to apply pressure to the cells in the channel.
Blood samples were collected from healthy volunteers after informed consent was obtained. The samples were diluted in physiological saline to a concentration of less than \(1/1000\). All the procedures were approved by the Ethics Review Committee for Medical Research Involving Human Subjects at Setsunan University (Approval No.2025-034). Flow reversal was induced by manually pushing the syringe at the outlet well to observe the RBC behavior during deceleration and reverse flow. The dynamics were recorded using a high-speed camera.
The primary objective of this study was to evaluate cell deformability. Therefore, comparative experiments were conducted using RBCs with intentionally reduced deformability. Specifically, adenosine triphosphate (ATP) depletion was induced in RBCs. Previous studies have reported that ATP levels are correlated with deformability and blood-related diseases, such as aging 35, sepsis 36, sickle cell disease 37, diabetes mellitus 38, malaria 39, and chronic kidney disease 40. To minimize ATP degradation over time, all the samples were processed within 1 h of blood collection. ATP depletion was achieved by incubating the cell suspensions (adjusted with saline) at 37 °C for 8 h. The experiments were conducted within 1 h of incubation. Samples from the same donor collected on the same day were used to minimize other variations. This approach allows a direct comparison of the mechanical deformability of healthy and disease-mimicking RBCs using the proposed microfluidic technique. Importantly, ATP depletion serves as a widely accepted in vitro model to mimic the impaired deformability observed in pathological conditions, such as sickle cell disease, diabetes mellitus, and other hemorheological disorders 35,36,37,38,39,40.
3. Result
3.1. Cell Behavior Results
Figure 4 shows a typical example of a cell manipulated within a channel. Time-lapse images at intervals of 10 ms are presented; however, the actual acquisition interval was 2 ms. In the figure, the RBC initially moves from right to left, decelerates, stops, and subsequently reverses direction to move from left to right. The moment at which the direction changes is defined as 0 ms. The scale bar indicates 10 μm.
Before deformation, the RBCs exhibited circular shapes. A magnified image at \(-40\) ms, along with the extracted cell region, is shown. A magnified image at 30 ms, when the cell exhibited maximum deformation, is also presented. As shown in Fig. 4, the RBC does not deform maximally at the instant of flow reversal; rather, the maximum deformation occurs after the cell has traveled approximately 15 μm in the reverse direction. This behavior was consistently observed in all the manipulation experiments, not only in the example shown in Fig. 4. Furthermore, even when varying the initial velocity under steady flow conditions and the magnitude of the manual syringe operation applied from the outlet side, the maximum deformation consistently occurred after the onset of reverse motion.
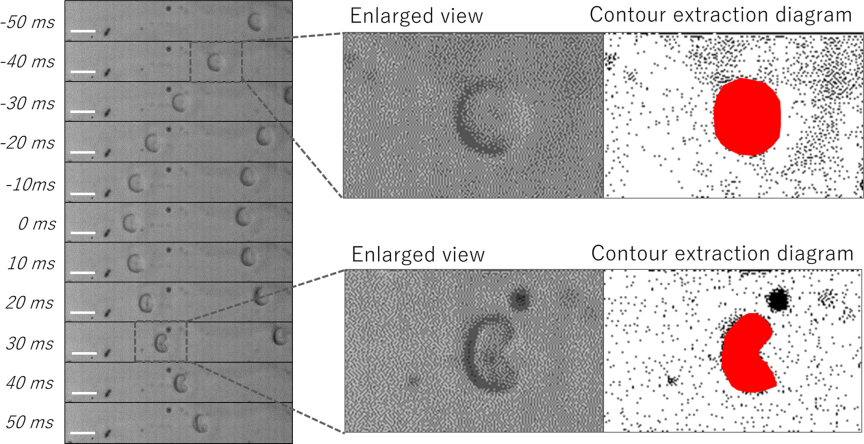
Fig. 4. Representative manipulation results. Time-lapse images taken at intervals of 10 ms are shown on the left. The time point at which the flow direction reverses is defined as 0 ms. The scale bar represents 10 μm. Enlarged views and segmented cell regions at \(-40\) ms and 30 ms are also presented.
3.2. Behavioral Analysis
Trajectory analysis was performed based on the acquired time-lapse images. Fig. 5(a) shows the same sample as that shown in Fig. 4. As indicated in the figure, the time at which the direction change occurred was defined as 0 ms, and the position of the cell region closest to the outlet well was set as the origin. The direction toward the inlet well was defined as positive. In all the images, the position of the cell region closest to the outlet well was plotted. Fig. 5(b) shows these positions at intervals of 2 ms. Based on these positional data, the velocity and acceleration were calculated, as shown in Figs. 5(c) and (d), respectively.
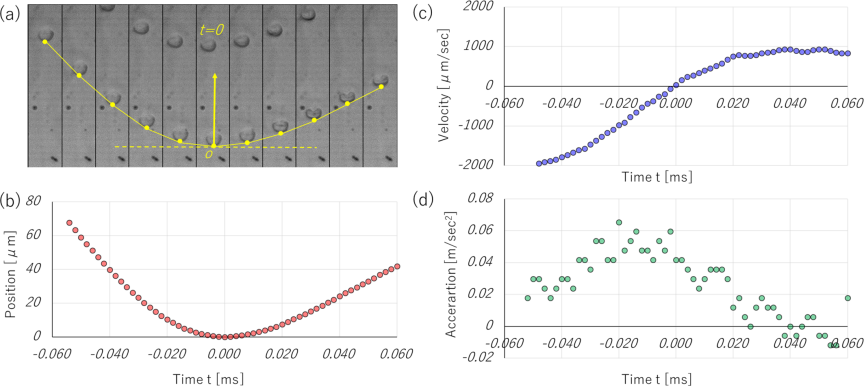
Fig. 5. Cell behavior analysis results. (a) Schematic of position definition for analysis. The upper side corresponds to the inlet well, and the position closest to the outlet well is plotted. (b) Relationship between time and position. The time of flow direction change is set to 0 ms. (c) Relationship between time and velocity. (d) Relationship between time and acceleration.
3.3. Estimation of Applied Load
Regarding the deformation behavior of the RBCs, the cells maintained a highly circular shape from before load application up to the moment of flow reversal. After reversing this direction, the RBCs gradually deformed into arc-like shapes. In this study, the deformation was evaluated by comparing the cell shape before and at the point of maximum deformation. The numerical calculation software MATLAB was used for the image evaluation. The evaluation method is illustrated in Fig. 6. First, the contour of the RBC before deformation was extracted, and its area was calculated. The reference circle diameter \(D\) is defined as the diameter of a circle with the same area. Similarly, for the deformed RBC, the contour was extracted, and the major axis length \(L\) and minor axis length \(S\) were obtained. In MATLAB, contour extraction was performed using the region of interest method, and the principal axis was determined using principal component analysis (PCA). The accuracy and stability of the PCA-based axis extraction were evaluated by comparing measurements with and without PCA. For instance, the major axis length with PCA was \(9.5{\pm}0.7\) μm and the minor axis was \(7.7{\pm}1.2\) μm, whereas without PCA, they were \(9.6{\pm}0.7\) μm and \(7.5{\pm}1.1\) μm, respectively. The circularity values were \(0.64{\pm}0.16\) with PCA and \(0.77{\pm}0.1\) without PCA. These small differences and low variability indicate that PCA provides stable and reliable axis extraction for shape analysis. Future studies may incorporate additional shape metrics, such as elongation index and circularity, to further validate and complement these findings.
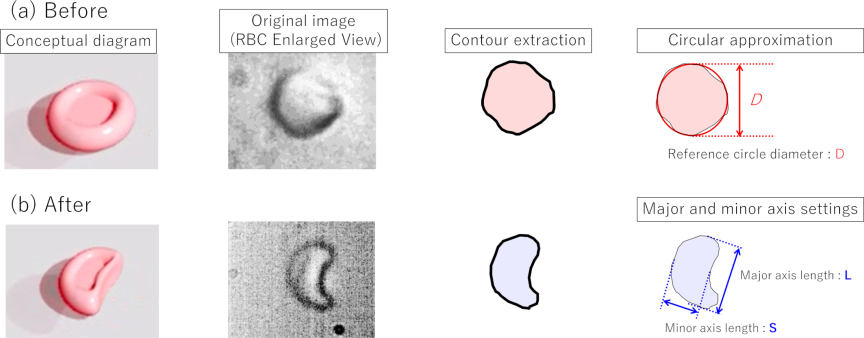
Fig. 6. Schematic of deformability evaluation. Before deformation, the RBCs exhibited a nearly circular shape. After deformation, they adopted an arc-like shape. The reference circle diameter is defined by approximating the RBC region to a circle before deformation. Following deformation, the major and minor axis lengths of the arc-like shape were measured for analysis.
The deformation rate is defined by the following equation:
In the example shown in Fig. 4, the deformation rate is 39.11%. The experiments were conducted under various initial velocity and syringe operation conditions. For the 16 samples, the deformation rate was \(31.11{\pm}5.40\)%. The relationship among the applied load originating from the inertial force, shear stress, and deformation rate was also analyzed. The inertial force can be expressed using Eq. (2) below.
Here, \(m\) represents the mass of a single RBC, calculated as 90 pg (\({9.0\times 10^{-14}}\) kg). The acceleration \(\alpha\) was approximated at the point of directional change. For example, in Fig. 5(d), an acceleration of 0.036 m/s\(^2\) was obtained from an approximation curve, resulting in an inertial force of 3.64 fN. Similar calculations were performed for all 16 samples. The relationship between the inertial force and the deformation rate is shown in Fig. 7.
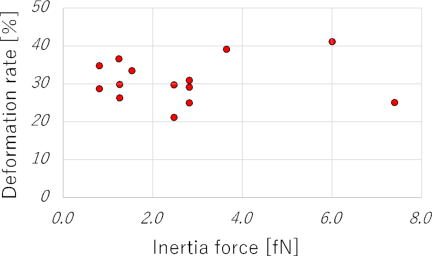
Fig. 7. Correlation between inertial force and deformation rate. The inertial force was calculated based on the deceleration of RBCs and the assumed mass of a single RBC (90 pg).
To quantitatively verify that the shear stress dominates the inertial forces, we calculated the relevant dimensionless numbers. Using a channel height of approximately 2 μm, a flow velocity of approximately 2 mm/s, a fluid viscosity of approximately 1 mPa \(\cdot\) s, and a fluid density of approximately 1000 kg/m\(^3\), the Reynolds number (\(\mathit{Re}\)) is estimated as follows:
Instead, the dominant factor is the wall shear stress generated between the channel and the RBCs. In previous experiments with a channel height of 1 μm, direct physical contact between the RBCs and the channel walls was observed, confirming that the RBC thickness (\(\sim\)2 μm) can lead to contact in sufficiently narrow channels 44. Experimental observations in the current study confirmed that there is no physical contact between the RBCs and the channel walls at the channel height of 2 μm. Although both the RBC thickness and channel height are approximately 2.0 μm, a thin lubrication gap of approximately 10–100 nm is presumed to exist based on microscopic observations and cell deformation behavior.
The viscosity \(\mu\) is assumed to be 1 mPa \(\cdot\) s, which approximates the viscosity of water at 25 °C under the experimental conditions. The gap was set to 100 nm. Using the initial steady flow velocity of 2.012 mm/s from Fig. 5, the shear rate (velocity gradient) near the wall is estimated as follows:
Thus, the wall shear stress \(\tau\) can be approximated as
In the example shown in Fig. 5, the initial steady flow velocity was 2.012 mm/s, and the projected cell area was 56.65 μm\(^2\). Based on these values, the load owing to the shear force was estimated to be 1140 pN. Similar calculations were performed for all 16 samples. The relationship between the shear-stress-derived load and the deformation rate is shown in Fig. 8. The shear stress is the dominant factor compared with the inertial force. However, the magnitude of the shear-induced load does not significantly affect the deformation rate. For example, the deformation rate showed a value of approximately 30% in a wide range from below 200 pN to above 2000 pN. This indicated that variations in the steady flow velocity and manual syringe operation did not significantly influence the results. Therefore, the proposed method can be implemented using a relatively simple experimental setup.
A sensitivity analysis involving repeated measurements of the same RBC under varying load conditions was not performed in this study. This is mainly due to the inherent heterogeneity in cell size and shape, as reflected by the projected cell area of 62.18\(\pm\)8.4 μm\(^2\) across the 16 samples. Even among cells of similar sizes, variability in the deformation rate was observed, indicating significant individual differences in mechanical response. The ability to detect cell–cell heterogeneity is a notable feature of this method. Consequently, although no significant variation in the deformation rate was observed within the estimated load range of 200–2000 pN, it appears that biological variability, rather than load variation, predominantly contributed to the observed spread in deformation rates. Future studies will focus on controlled sensitivity analyses to more precisely quantify the effect of the applied load magnitude on RBC deformability and to separate load effects from intrinsic cellular variability.
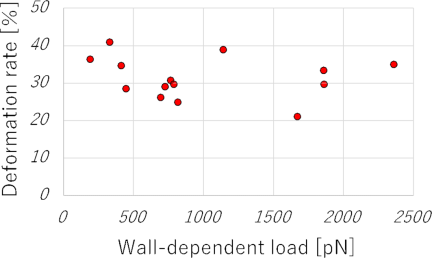
Fig. 8. Correlation between wall-shear-stress-induced load and deformation ratio. The gap between the RBC and the channel wall was assumed to be 100 nm. The load was estimated from the initial velocity and the projected area of the RBC.
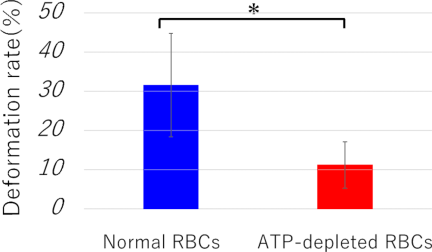
Fig. 9. Comparison of deformation ratios between normal RBCs and ATP-depleted RBCs.
3.4. Evaluation of Deformation
Based on the findings in Section 3.3, no significant variation in the deformation rate was observed within the load range of 200–2000 pN. The deformation rate was calculated experimentally when a load was applied within this range. In the present study, experiments were conducted using normal and ATP-depleted RBCs. Six samples were analyzed for each condition. The results are shown in Fig. 9. The deformation rate for normal RBCs was \(31.5{\pm}11.8\)%, whereas that for ATP-depleted RBCs was \(11.1{\pm}5.3\)%. These results confirmed that ATP depletion reduced deformability. A statistical analysis was performed using an independent two-sample \(t\)-test, assuming equal variances, because tests for the equality of variances support this approach. Additionally, 95% confidence intervals were calculated to assess the variability of group means: for normal RBCs, \(31.5{\pm}16.38\)% (95% CI: 15.12 to 47.88), and for ATP-depleted RBCs, \(11.1{\pm}7.33\)% (95% CI: 3.77 to 18.43). The \(p\)-value between the two groups was 0.025, indicating a statistically significant difference. The calculated Cohen’s \(d\) value was 1.86, indicating a significant effect. Although the sample size was limited to six per group, the observed significant difference and large effect size suggest meaningful biological relevance. Future studies with larger sample sizes are warranted to confirm and generalize these findings. Before deformation, both had high circularity and no significant difference was confirmed, even when using the reference circle diameter as an indicator. Therefore, the deformability of individual RBCs can be evaluated by applying a load.
Additional experiments were conducted using a channel height of 3.6 μm to investigate the effect of microchannel dimensions on RBC deformability. Under these conditions, the deformation rates for normal RBCs was \(11.4{\pm}6.9\)%, and ATP-depleted RBCs were \(10.3{\pm}8.3\)%. No statistically significant differences were observed between the two groups (\({p>0.05}\)). This suggests that increasing the channel height reduces the wall shear stress applied to the RBCs, thereby decreasing the effective mechanical loading and limiting cell deformation. These findings highlight the importance of precise control of microchannel dimensions when designing experiments to evaluate the mechanical properties of RBCs.
4. Discussion
4.1. RBC Deformation Mechanism and Response Delay
The deformation behavior observed in this study suggests that wall shear stress, rather than inertial force, is the dominant factor contributing to RBC deformation. It is possible that the wall shear stress generated during steady flow was released upon flow cessation, thereby inducing deformation. However, the maximum deformation did not occur immediately during the flow reversal but after a short period during reverse motion.
This delay may have resulted from several interacting factors. First, the elastic properties of the silicone materials used in tubing and microfluidic devices may cause a temporal lag in force transmission 45. Second, transient flow dynamics, such as fluid inertia and pressure wave propagation within the microchannel, can contribute to the temporal delay. Third, RBCs exhibit viscoelastic behavior by combining elastic and viscous properties, which likely contribute to the delayed deformation response 46. Additionally, slight variations in channel height from the nominal value of 2.0 μm owing to pressure changes induced by syringe operation may affect the deformation. Although the precise quantification of these factors is difficult, considering them provides a more comprehensive understanding of the observed deformation dynamics. However, these explanations remain speculative interpretations based on plausible physical reasoning and relevant literature. No direct experimental measurements were conducted to quantitatively verify the individual contributions of tubing elasticity, transient flow dynamics, or RBC viscoelasticity to the observed delay. Future studies involving detailed flow and pressure measurements, mechanical characterization of device materials, and rheological studies of RBCs under dynamic conditions are necessary to substantiate and refine these hypotheses.
In particular, the observed delay between flow reversal and maximum deformation likely arises from multiple interacting factors. The elasticity of the silicone tubing and microfluidic device may act as a mechanical filter, causing a time lag between the sudden change in flow direction and shear stress transmitted to the cells. Thus, although the flow reverses instantaneously, the effective mechanical load on the RBCs builds over a short period owing to the elastic deformation and relaxation of the device materials. Additionally, transient flow dynamics, such as fluid inertia and pressure wave propagation within the microchannel, may contribute to this temporal delay by delaying the establishment of steady shear stress conditions after reversal. The viscoelastic nature of RBCs further compounds this delay, as the cells require a finite time to respond to changing mechanical stimuli owing to cytoskeletal remodeling and membrane viscosity. Together, these mechanisms explain why the maximum deformation occurs shortly after flow reversal rather than immediately after. Although the precise quantification of each contribution is challenging, considering these factors provides a comprehensive understanding of the observed deformation dynamics.
4.2. Experimental Setup Robustness and Practicality
Despite these complexities, the current experimental setup is simple and enables a relatively high-throughput application of mechanical loads in the piconewton to nanonewton range, making it a practical tool for assessing RBC deformability under controlled stimuli. Manual syringe operation to induce reverse flow introduces some variability; however, the direct observation and quantification of cell deformation via high-speed imaging at the single-cell level effectively accounts for these variations in the results. Our results show consistent deformation despite minor manual differences, demonstrating the practical robustness of the proposed method. Although automation can improve reproducibility, the current approach offers a simple and reliable method for assessing RBC deformability.
4.3. Channel Geometry and Mechanical Loading Limitations
Although this method is simple and robust, it has some limitations. Mechanical loading and the resulting deformation are sensitive to the channel geometry, particularly the channel height, which determines the gap between the cells and the channel walls. The channel height was set considering the flattened shapes of the RBCs. When a larger channel height of 3.6 μm was tested, smaller deformation was observed, suggesting that the channel geometry should be adjusted to match the target cell size and shape. Although the gap estimations were based on nominal dimensions, slight variations in fabrication or pressure may have affected the actual geometry and mechanical load. The assumptions in the gap and shear stress calculations simplify the complex fluid–cell interactions in confined microchannels. Although this study focused on RBCs owing to their high deformability and clinical relevance, the method could potentially be applied to other cell types by tailoring the channel geometry accordingly. Future studies should explore these adaptations to broaden the applicability of this approach.
4.4. Biological Variability and ATP Depletion Model Considerations
Furthermore, our findings highlight the inherent biological variability among RBCs, as indicated by the spread of deformation responses under similar loading conditions. This emphasizes the importance of single-cell analysis for capturing heterogeneity that bulk measurements may overlook. The ability of the present method to detect such cell-to-cell differences could prove valuable for diagnostic applications, for example, in identifying pathological changes in RBC mechanics associated with diseases such as sickle cell anemia and malaria.
However, ATP depletion is a simplified surrogate model for the impaired RBC deformability observed in various diseases. Although it mimics the metabolic abnormalities seen in conditions such as diabetes and sickle cell disease, the actual pathological states involve multiple complex factors, including oxidative stress, membrane protein alterations, and inflammatory responses that are not captured by ATP depletion alone. Therefore, although our findings are promising, they remain preliminary until they can be validated using clinical patient samples. Future studies should test this method using pathological specimens to confirm its diagnostic relevance. Additionally, evaluating the sensitivity and specificity for detecting subtle clinical variations in RBC deformability is crucial.
Future studies should focus on refining the load control, possibly through automated syringe pumps or microfluidic flow controllers, to reduce variability and enable systematic sensitivity analyses. Integrating molecular or biochemical markers with mechanical measurements can provide deeper insights into the mechanisms underlying RBC deformability. Extending this approach to other cell types or cells under different physiological or pathological conditions may broaden its applicability and impact in biomedical research.
5. Conclusion
In this study, we developed an experimental system to apply mechanical loads to cells using a microfluidic device and measured their responses. The load application method involves applying a braking force opposite to the movement of the cell as it flows through the channel at a constant velocity. The wall shear stress, rather than the inertial force, was confirmed as the dominant factor influencing deformation.
The system consistently induced approximately 30% deformation in highly deformable RBCs, regardless of variations in the initial flow velocity or manual syringe operation. This robustness highlighted the reliability and reproducibility of the proposed loading method under practical experimental conditions. Moreover, a channel height of approximately 2.0 μm, which avoids physical contact between the RBCs and the channel walls, was suggested as optimal.
When ATP-depleted RBCs mimicking blood disease conditions were tested, a statistically significant difference in deformability was detected using a vision-based approach. Given that ATP depletion is an established model for the pathological reduction in RBC deformability observed clinically, this indicates its potential applicability in diagnostics 47. This sensitivity suggests that clinically relevant variations in cell mechanics can be effectively monitored 48. Furthermore, the simplicity of the experimental setup, combined with quantitative image analysis, enables efficient single-cell-level assessment, which is advantageous for detecting cell-to-cell heterogeneity in terms of deformability. Specific deformation behaviors can be correlated with individual cell properties, facilitating detailed mechanobiological studies and potentially personalized diagnostics.
Finally, the applicability of this method depends on careful consideration of the device geometry and experimental parameters. The channel height used here was optimized for the flattened shape of RBCs; the deformation decreased when a larger height (3.6 μm) was used, suggesting that the channel dimensions should be adapted for other cell types. Considering these factors, this technique has potential beyond RBCs by modifying the microfluidic design accordingly. Understanding these limitations and possibilities will guide future optimization and expand the applications of mechanobiology and diagnostics. This method aligns with the focus of this special issue by providing a novel sensor-based microfluidic platform that facilitates the mechanical phenotyping of cells through direct mechanical loading and image sensing, thus contributing to the development of practical and scalable cellular measurement technologies.
Acknowledgments
This study was supported by JKA through promotion funds from the KEIRIN RACE.
- [1] M. Battistelli et al., “Skeletal muscle cell behavior after physical agent treatments,” Curr. Pharm. Des., Vol.21, No.25, pp. 3665-3672, 2015. https://doi.org/10.2174/1381612821666150122123412
- [2] K.-A. Hansson and E. Eftestøl, “Scaling of nuclear numbers and their spatial arrangement in skeletal muscle cell size regulation,” Mol. Biol. Cell, Vol.34, No.8, Article No.pe3, 2023. https://doi.org/10.1091/mbc.E22-09-0424
- [3] A. Jögi, M. Vaapil, M. Johansson, and S. Påhlman, “Cancer cell differentiation heterogeneity and aggressive behavior in solid tumors,” Upsala J. Med. Sci., Vol.117, No.2, pp. 217-224, 2012. https://doi.org/10.3109/03009734.2012.659294
- [4] C. A. Moxon, G. E. Grau, and A. G. Craig, “Malaria: Modification of the red blood cell and consequences in the human host,” Br. J. Haematol., Vol.154, No.6, pp. 670-679, 2011. https://doi.org/10.1111/j.1365-2141.2011.08755.x
- [5] J. Pernow, A. Mahdi, J. Yang, and Z. Zhou, “Red blood cell dysfunction: A new player in cardiovascular disease,” Cardiovasc. Res., Vol.115, No.11, pp. 1596-1605, 2019. https://doi.org/10.1093/cvr/cvz156
- [6] H. H. Patel, H. R. Patel, and J. M. Higgins, “Modulation of red blood cell population dynamics is a fundamental homeostatic response to disease,” Am. J. Hematol., Vol.90, No.5, pp. 422-428, 2015. https://doi.org/10.1002/ajh.23982
- [7] B. George-Gay and K. Parker, “Understanding the complete blood count with differential,” J. Perianesth. Nurs., Vol.18, No.2, pp. 96-117, 2003. https://doi.org/10.1053/jpan.2003.50013
- [8] S. Sen et al., “Early clinical complete blood count changes in severe burn injuries,” Burns, Vol.45, No.1, pp. 97-102, 2019. https://doi.org/10.1016/j.burns.2018.09.004
- [9] L. Agnello et al., “The value of a complete blood count (CBC) for sepsis diagnosis and prognosis,” Diagnostics, Vol.11, No.10, Article No.1881, 2021. https://doi.org/10.3390/diagnostics11101881
- [10] M. Aghaei et al., “Evaluation of complete blood count parameters in patients with diabetes mellitus: A systematic review,” Health Sci. Rep., Vol.8, No.2, Article No.e70488, 2025. https://doi.org/10.1002/hsr2.70488
- [11] K. Wisanuvej et al., “Comparison between blood hemoglobin concentration determined by point-of-care device and complete blood count in adult patients with dengue,” PLOS Negl. Trop. Dis., Vol.15, No.8, Article No.e0009692, 2021. https://doi.org/10.1371/journal.pntd.0009692
- [12] G. Hao et al., “Association of blood glucose and lipid levels with complete blood count indices to establish a regression model,” Biomed. Rep., Vol.6, No.3, pp. 339-345, 2017. https://doi.org/10.3892/br.2017.852
- [13] R. Poonperm et al., “scRepli-RamDA-seq: A multi-omics technology enabling the analysis of gene expression dynamics during S-phase,” Nat. Commun., Vol.16, No.1, Article No.10902, 2025. https://doi.org/10.1038/s41467-025-64688-1
- [14] S. V. Avery, “Microbial cell individuality and the underlying sources of heterogeneity,” Nat. Rev. Microbiol., Vol.4, No.8, pp. 577-587, 2006. https://doi.org/10.1038/nrmicro1460
- [15] J. Zhao, “Cell individuality: A basic multicellular phenomenon and its role in the pathogenesis of disease,” Med. Hypotheses, Vol.44, No.5, pp. 400-402, 1995. https://doi.org/10.1016/0306-9877(95)90267-8
- [16] M. B. Ginzberg, R. Kafri, and M. Kirschner, “On being the right (cell) size,” Science, Vol.348, No.6236, Article No.1245075, 2015. https://doi.org/10.1126/science.1245075
- [17] M. Horade, C.-H. D. Tsai, and M. Kaneko, “On-chip cell incubator for simultaneous observation of culture with and without periodic hydrostatic pressure,” Micromachines, Vol.10, No.2, Article No.133, 2019. https://doi.org/10.3390/mi10020133
- [18] Asadullah et al., “Combined heterogeneity in cell size and deformability promotes cancer invasiveness,” J. Cell Sci., Vol.134, No.7, Article No.jcs250225, 2021. https://doi.org/10.1242/jcs.250225
- [19] X. He, H. Kimura, and T. Fujii, “A high-throughput device for patterned differentiation of embryoid bodies,” J. Robot. Mechatron., Vol.25, No.4, pp. 623-630, 2013. https://doi.org/10.20965/jrm.2013.p0623
- [20] C. W. Shields IV, C. D. Reyes, and G. P. López, “Microfluidic cell sorting: A review of the advances in the separation of cells from debulking to rare cell isolation,” Lab Chip, Vol.15, No.5, pp. 1230-1249, 2015. https://doi.org/10.1039/c4lc01246a
- [21] F. Tang et al., “mRNA-Seq whole-transcriptome analysis of a single cell,” Nat. Methods, Vol.6, No.5, pp. 377-382, 2009. https://doi.org/10.1038/nmeth.1315
- [22] E. Z. Macosko et al., “Highly parallel genome-wide expression profiling of individual cells using nanoliter droplets,” Cell, Vol.161, No.5, pp. 1202-1214, 2015. https://doi.org/10.1016/j.cell.2015.05.002
- [23] E. Danese, G. Lippi, and M. Montagnana, “Red blood cell distribution width and cardiovascular diseases,” J. Thorac. Dis., Vol.7, No.10, pp. E402-E411, 2015. https://doi.org/10.3978/j.issn.2072-1439.2015.10.04
- [24] M. Tonelli et al., “Relation between red blood cell distribution width and cardiovascular event rate in people with coronary disease,” Circulation, Vol.117, No.2, pp. 163-168, 2008. https://doi.org/10.1161/CIRCULATIONAHA.107.727545
- [25] G. L. Thompson and D. Kavanagh, “Diagnosis and treatment of thrombotic microangiopathy,” Int. J. Lab. Hematol., Vol.44, No.S1, pp. 101-113, 2022. https://doi.org/10.1111/ijlh.13954
- [26] K. Inoue, D. Nishi, T. Takubo, T. Tanikawa, and T. Arai, “Performance evaluation of teleoperation for manipulating micro objects using two-fingered micro hand,” J. Robot. Mechatron., Vol.19, No.5, pp. 577-584, 2007. https://doi.org/10.20965/jrm.2007.p0577
- [27] Y. Tanaka, “Double-arm optical tweezer system for precise and dexterous handling of micro-objects in 3D workspace,” Opt. Lasers Eng., Vol.111, pp. 65-70, 2018. https://doi.org/10.1016/j.optlaseng.2018.07.019
- [28] S. Sakuma and F. Arai, “Cellular force measurement using a nanometric-probe-integrated microfluidic chip with a displacement reduction mechanism,” J. Robot. Mechatron., Vol.25, No.2, pp. 277-284, 2013. https://doi.org/10.20965/jrm.2013.p0277
- [29] Y. Yamanishi et al., “Design and fabrication of all-in-one unified microfluidic chip for automation of embryonic cell manipulation,” J. Robot. Mechatron., Vol.22, No.3, pp. 371-379, 2010. https://doi.org/10.20965/jrm.2010.p0371
- [30] A. Raj and A. K. Sen, “Entry and passage behavior of biological cells in a constricted compliant microchannel,” RSC Adv., Vol.8, No.37, pp. 20884-20893, 2018. https://doi.org/10.1039/C8RA02763C
- [31] J. Chen, X. Zou, D. C. Spencer, and H. Morgan, “Single-cell electro-mechanical shear flow deformability cytometry,” Microsyst. Nanoeng., Vol.10, No.1, Article No.173, 2024. https://doi.org/10.1038/s41378-024-00810-5
- [32] T. Yang, F. Bragheri, and P. Minzioni, “A comprehensive review of optical stretcher for cell mechanical characterization at single-cell level,” Micromachines, Vol.7, No.5, Article No.90, 2016. https://doi.org/10.3390/mi7050090
- [33] H. T. K. Tse et al., “Quantitative diagnosis of malignant pleural effusions by single-cell mechanophenotyping,” Sci. Transl. Med., Vol.5, No.212, Article No.212ra163, 2013. https://doi.org/10.1126/scitranslmed.3006559
- [34] S. Sakuma et al., “High resolution cell positioning based on a flow reduction mechanism for enhancing deformability mapping,” Micromachines, Vol.5, No.4, pp. 1188-1201, 2014. https://doi.org/10.3390/mi5041188
- [35] M. L. Racine and F. A. Dinenno, “Reduced deformability contributes to impaired deoxygenation-induced ATP release from red blood cells of older adult humans,” J. Physiol., Vol.597, No.17, pp. 4503-4519, 2019. https://doi.org/10.1113/JP278338
- [36] Y. Li, J. Zhou, I. Burkovskiy, P. Yeung, and C. Lehmann, “ATP in red blood cells as biomarker for sepsis in humans,” Med. Hypotheses, Vol.124, pp. 84-86, 2019. https://doi.org/10.1016/j.mehy.2019.02.014
- [37] D. S. Parekh, W. A. Eaton, and S. L. Thein, “Recent developments in the use of pyruvate kinase activators as a new approach for treating sickle cell disease,” Blood, Vol.143, No.10, pp. 866-871, 2024. https://doi.org/10.1182/blood.2023021167
- [38] D. H. Bonfanti et al., “ATP-dependent potassium channels and type 2 diabetes mellitus,” Clin. Biochem., Vol.48, Nos.7-8, pp. 476-482, 2015. https://doi.org/10.1016/j.clinbiochem.2014.12.026
- [39] G. Ramdani and G. Langsley, “ATP, an extracellular signaling molecule in red blood cells: A messenger for malaria?,” Biomed. J., Vol.37, No.5, pp. 284-292, 2014. https://doi.org/10.4103/2319-4170.132910
- [40] X. Zhang, E. Agborbesong, and X. Li, “The role of mitochondria in acute kidney injury and chronic kidney disease and its therapeutic potential,” Int. J. Mol. Sci., Vol.22, No.20, Article No.11253, 2021. https://doi.org/10.3390/ijms222011253
- [41] H. Bruus, “Theoretical microfluidics,” Oxford University Press, 2007. https://doi.org/10.1093/oso/9780199235087.001.0001
- [42] A. Link, I. L. Pardo, B. Porr, and T. Franke, “AI based image analysis of red blood cells in oscillating microchannels,” RSC Adv., Vol.13, No.41, pp. 28576-28582, 2023. https://doi.org/10.1039/d3ra04644c
- [43] A. R. Pries, D. Neuhaus, and P. Gaehtgens, “Blood viscosity in tube flow: Dependence on diameter and hematocrit,” Am. J. Physiol. Heart Circ. Physiol., Vol.263, No.6, pp. H1770-H1778, 1992. https://doi.org/10.1152/ajpheart.1992.263.6.H1770
- [44] M. Horade, M. Moriga, and S. Murakami, “Cell size and deformation measurement using constrictions integrated into a microfluidic device,” Phys. Scr., Vol.99, No.7, Article No.075007, 2024. https://doi.org/10.1088/1402-4896/ad5060
- [45] K. Mizoue, K. Teramura, C.-H. D. Tsai, and M. Kaneko, “Transfer function of macro-micro manipulation on a PDMS microfluidic chip,” Micromachines, Vol.8, No.3, Article No.80, 2017. https://doi.org/10.3390/mi8030080
- [46] M. Puig-de-Morales-Marinkovic, K. T. Turner, J. P. Butler, J. J. Fredberg, and S. Suresh, “Viscoelasticity of the human red blood cell,” Am. J. Physiol. Cell Physiol., Vol.293, No.2, pp. C597-C605, 2007. https://doi.org/10.1152/ajpcell.00562.2006
- [47] M. Liang et al., “Pathophysiological associations and measurement techniques of red blood cell deformability,” Biosensors, Vol.15, No.9, Article No.566, 2025. https://doi.org/10.3390/bios15090566
- [48] G. Tomaiuolo, “Biomechanical properties of red blood cells in health and disease towards microfluidics,” Biomicrofluidics, Vol.8, No.5, Article No.051501, 2014. https://doi.org/10.1063/1.4895755
This article is published under a Creative Commons Attribution-NoDerivatives 4.0 Internationa License.