
Paper:
Electrical Impedance Spectroscopy-Based Characterization of Cell Spheroids Using Microelectrode Arrays
Takahiro Himuro*, Kenichi Yoshikawa**, Yusuke Yoshida**, Hisashi Hisatomi**
 , and Yoji Saito**
*National Institute of Technology, Kure College
2-2-11 Agaminami, Kure, Hiroshima 737-8506, Japan
**Graduate School of Science and Engineering, Seikei University
3-3-1 Kichijoji-Kitamachi, Musashino, Tokyo 180-8633, Japan

Cell spheroids are three-dimensional in vitro models that, compared with conventional two-dimensional cultures, more accurately reproduce the physiological properties of multicellular tissues. In this paper, we present a label-free method for evaluating cell spheroids using electrical impedance spectroscopy (EIS) with microelectrode arrays. A thin-film microelectrode array was fabricated on a glass substrate and integrated with a polydimethylsiloxane chamber to enable stable placement of spheroids on the electrodes. Impedance was measured over a frequency range of 1 kHz to 5 MHz using an alternating current voltage of 0.1 V. HEK293T spheroids exhibited impedance values that differed by approximately one order of magnitude from those of the culture medium. Equivalent circuit analysis allowed estimation of extracellular and intracellular resistances. Impedance also increased with spheroid size, reflecting differences in the number of cells contained within the spheroids. Cancer cell spheroids (DLD-1 and HepG2) showed electrical characteristics distinct from those of HEK293T spheroids, indicating sensitivity to cell type. Surfactant-induced membrane disruption resulted in a decrease in membrane capacitance, corresponding to loss of cell viability. These results demonstrate that EIS enables noninvasive, quantitative evaluation of cell spheroids, with potential applications in drug screening and biomedical diagnostics.
Impedance characterization of a cell spheroid
1. Introduction
Tissue engineering has emerged as a promising next-generation approach for regenerating damaged tissues and organs using a patient’s own cells 1. This field has advanced significantly through the integration of stem cell biology, regenerative medicine, and microfabrication technologies, enabling precise control of the cellular microenvironment 2,3. Artificial tissues or organoids can be constructed by expanding a small number of cells derived from a target organ and assembling them ex vivo into functional biological structures that can subsequently be used in regenerative therapies.
Cell spheroids formed through three-dimensional (3D) culture have attracted considerable attention 4,5. These spheroids are spherical aggregates composed of several thousand cells formed through cell–cell adhesion. They preserve cell–cell interactions and serve as in vitro models that more closely mimic multicellular structures, including human tissues. Because experiments can be conducted under physiologically relevant conditions, cell spheroids have been widely used in cell therapy 6 and drug screening 7,8. Various approaches have been developed to improve the microenvironment within spheroids, which is critical for maintaining cellular functions. For example, enhancing oxygen supply and suppressing necrotic core formation in multicellular spheroids using gas-permeable culture systems and embedded hydrogel beads has been reported 9. Furthermore, spheroid-based approaches have been applied to restore liver function using hepatocyte spheroids 10. In addition, tumor spheroids composed of MCF-7 cells have been used in drug screening studies to demonstrate the effectiveness of combination therapies 11. Currently, the state of individual cells, such as viability, is commonly evaluated using flow cytometry and fluorescence imaging 12,13. However, flow cytometry requires extensive sample preparation and costly instrumentation. Furthermore, fluorescent labeling reagents are often cytotoxic, making long-term observation of live cells difficult. Therefore, there is a strong demand for simple, noninvasive, label-free evaluation methods.
Electrical impedance spectroscopy (EIS) has attracted attention as a promising technique for such applications 14,15. EIS measures the electrical properties of materials and their interfaces over a wide frequency range and analyzes their spectral characteristics. Biological systems can be represented by equivalent electrical circuit models consisting of elements such as resistances and capacitances, enabling quantitative interpretation of their structural and functional properties 16,17,18. Although EIS has conventionally been applied to single-cell and monolayer cultures, previous studies have demonstrated that impedance increases with cell proliferation because of the increase in cell number 19. These findings suggest that EIS has the potential to evaluate multicellular structures such as spheroids.
In this study, various cell spheroids were placed on microelectrode arrays fabricated on glass substrates by photolithography and impedance measurements were performed using alternating current (AC) signals. HEK293T cells (human embryonic kidney cells), which are immortalized cells derived from normal cells and widely used in cell biology research, were cultured as spheroids and used as models for normal cells 20. In addition, the cancer cell lines DLD-1 (human colorectal cancer cells) 21 and HepG2 (human hepatocellular carcinoma cells) 22 were cultured as spheroids and evaluated. The electrical characteristics of normal and cancer cell spheroids were compared and analyzed. Furthermore, to investigate the relationship between impedance and cell death, the spheroids were treated with the surfactant Triton X-100, and the resulting changes in electrical properties were evaluated. This approach enables quantitative evaluation of multicellular systems based on their electrical properties. The remainder of this paper is organized as follows. Section 2 describes the experimental methods, Section 3 presents the impedance characteristics of cell spheroids, and Section 4 summarizes the conclusions of this study.
2. Experimental Methods
2.1. Device Configuration for Spheroid Evaluation
The device consisted of thin-film electrodes patterned on a glass substrate, and a polydimethylsiloxane (PDMS) cover used for cell placement (Fig. 1). The electrodes were fabricated using standard microfabrication processes, including thin-film deposition by vacuum evaporation, photolithographic patterning with a photoresist and ultraviolet exposure, and wet etching to define the electrode structures. The PDMS cover was prepared by mixing a silicone elastomer (KE-106, Shin-Etsu Chemical Co., Ltd.) with a curing agent. The mixture was degassed under vacuum in a desiccator to remove air bubbles, and then poured onto a silicon wafer to a thickness of approximately 5 mm. After curing at 60° C, the solidified PDMS was cut into cubic blocks of appropriate size. A cylindrical through-hole with a diameter of 4 mm was formed at the center of each PDMS block using a biopsy punch. The PDMS cover was then aligned and bonded to the glass substrate, so that the through-hole was positioned directly above the electrode array.
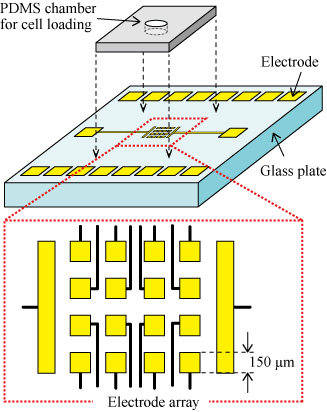
Fig. 1. Schematic of the device structure. A \(4 \times 4\) array of square electrodes (\(150~\mathrm{{\mu}m} \times 150~\mathrm{{\mu}m}\)) and two rectangular electrodes (\(300~\mathrm{{\mu}m} \times 1~\mathrm{mm}\)) are fabricated on a glass substrate. Contact pads are arranged at the periphery. A PDMS chamber is aligned over the electrode array for spheroid placement.
2.2. Electrical Impedance Measurement of Cell Spheroids
The HEK293T, DLD-1, and HepG2 cells were cultured as 3D spheroids. The spheroids were collected from culture dishes using a micropipette together with approximately 30 μL of culture medium and introduced into the through-hole of the PDMS structure. Before measurement, the presence of spheroids on the electrode array was confirmed using an inverted microscope. Impedance measurements were performed in a two-electrode configuration using the array electrode on which the spheroid was placed and the nearest rectangular counter electrode, minimizing the effect of electrode spacing on the measured impedance. An AC voltage of 0.1 V was applied over a frequency range of 1 kHz to 5 MHz using an impedance analyzer, and the impedance (\(Z\)) and phase angle (\(\theta\)) were measured. The complex impedance was plotted from these data. Based on the shape of the complex impedance plot, curve fitting was performed using an equivalent circuit model to extract the spheroid’s electrical parameters. A photograph of the experimental setup for the impedance measurements is shown in Fig. 2.
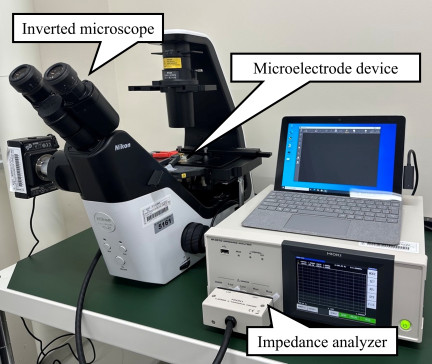
Fig. 2. Photograph of the experimental setup used for impedance measurements. The microelectrode device mounted on an inverted microscope is connected to an impedance analyzer via probe tips that contact the electrode pads.
2.3. Evaluation of Cell Viability Using Surfactant Treatment
Surfactant treatment experiments were performed using Triton X-100 to evaluate changes in cell viability through electrical measurements. Because surfactants disrupt phospholipid bilayers through hydrophobic interactions, treatment with Triton X-100 causes membrane damage and loss of cell viability. In this experiment, HEK293T spheroids were first placed on the electrode array using a micropipette, and impedance measurements were conducted after their positions were confirmed with an inverted microscope. Subsequently, approximately 10 μL of 10% Triton X-100 solution was added to the spheroids, and impedance measurements were repeated to evaluate changes in electrical characteristics during cell membrane disruption.
3. Results
3.1. Frequency Response of Cell Spheroids on Microelectrodes
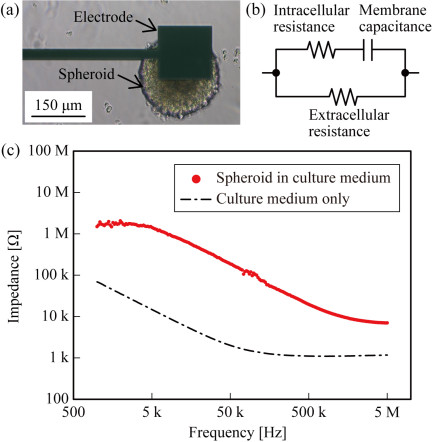
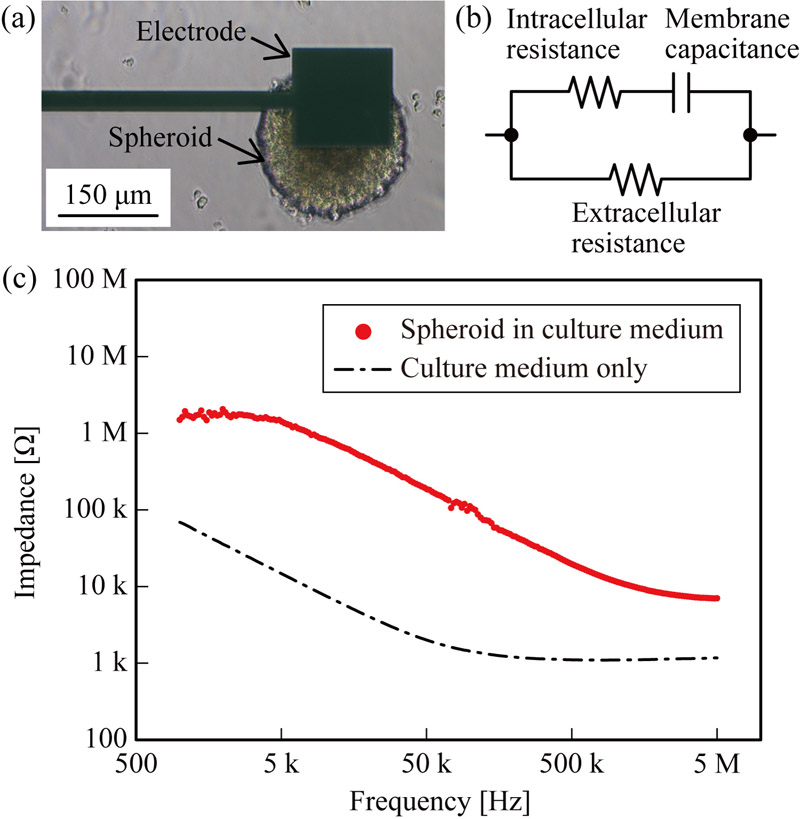
Fig. 3. (a) Microscopic image of a HEK293T cell spheroid positioned on the microelectrode array. (b) Equivalent circuit model used in this study, consisting of extracellular resistance, intracellular resistance, and membrane capacitance. (c) Frequency-dependent impedance characteristics measured for culture medium alone and for culture medium containing a cell spheroid.
The frequency-dependent impedance characteristics of HEK293T cell spheroids with diameters of 200 μm measured on the microelectrode array are shown in Fig. 3. Fig. 3(a) shows a microscopic image of a spheroid positioned on the electrode array, and Fig. 3(b) shows the equivalent circuit model used for fitting in this study. The measured frequency-dependent impedance characteristics are presented in Fig. 3(c). For comparison, measurements obtained using only the culture medium are also shown. When a spheroid was present on the electrode array, the impedance remained approximately constant at about 2 MΩ up to approximately 7 kHz, then decreased sharply with increasing frequency. In contrast, when only the culture medium was present, the impedance decreased monotonically from 1 kHz to approximately 200 kHz and then plateaued at around 1 kΩ. A clear difference of approximately one order of magnitude was observed between the spheroid- and medium-only conditions across the measured frequency range. This result indicated that the fabricated microelectrode device could distinguish the electrical characteristics of cell spheroids from those of the surrounding medium. The complex impedance plot derived from the frequency characteristics shown in Fig. 3(c) is presented in Fig. 4. The measured data were well fitted by a semicircular arc with a diameter of approximately 2 MΩ. Based on the equivalent circuit model shown in Fig. 3(b), the total impedance \(Z\) can be expressed as:
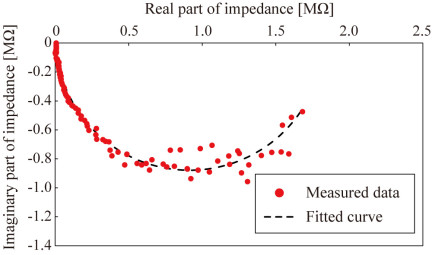
Fig. 4. Complex impedance plot derived from the frequency-dependent impedance data shown in Fig. 3(c), together with the fitted curve obtained using the equivalent circuit model.
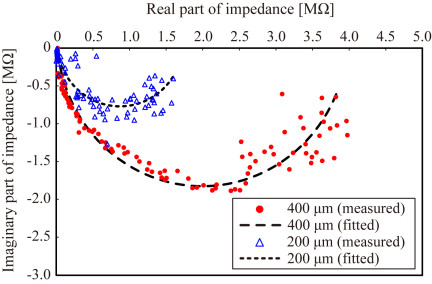
Fig. 5. Comparison of complex impedance plots for HEK293T cell spheroids with diameters of 400 μm (red circles) and 200 μm (blue triangles). The corresponding fitted curves, based on the equivalent circuit model, are shown as dashed and finely dashed lines, respectively.
3.2. Effect of Spheroid Size on Impedance Characteristics
To evaluate the effect of spheroid size on electrical properties, impedance measurements were performed on HEK293T spheroids with diameters of 200 μm and 400 μm. The spheroids used in this study were distinct from those described in the previous section. The corresponding complex impedance plots for both spheroid sizes are shown in Fig. 5. The complex impedance plot for the 200 μm spheroid exhibits a semicircle with a diameter of approximately 2 MΩ, whereas the plot for the 400 μm spheroid shows a larger semicircle with a diameter of approximately 4 MΩ. Equivalent circuit analysis revealed that the extracellular resistance was approximately 1.9 MΩ and the intracellular resistance was approximately 5 kΩ for the 200 μm spheroid. In contrast, the 400 μm spheroid exhibited an extracellular resistance of approximately 3.9 MΩ and an intracellular resistance of approximately 18 kΩ. These results indicate that both extracellular and intracellular resistance increase with spheroid size. This trend is attributed to the increased number of constituent cells and the resulting expansion of the overall conductive pathways, which leads to a higher impedance in larger spheroids. For the spectra shown in Fig. 5, the RMSE values were approximately 0.17 MΩ (real) and 0.20 MΩ (imaginary) for the 200 μm spheroid, and 0.14 MΩ (real) and 0.10 MΩ (imaginary) for the 400 μm spheroid. Considering the impedance magnitudes of approximately 2 MΩ and 4 MΩ, respectively, these values correspond to relative errors ranging from approximately 3% to 10%. Although these results indicate good agreement between the experimental data and the equivalent circuit model, it should be noted that spheroids are inherently heterogeneous, and the impedance parameters obtained from EIS measurements are influenced by multiple factors, including cell density, internal organization, contact conditions between the spheroid and the electrode surface, and spheroid size. Consequently, a unique and quantitative correspondence between the impedance parameters and spheroid size cannot always be established. Although a general relationship between spheroid size and impedance was observed in this study, the results indicate that impedance parameters should be interpreted with caution when used for absolute size estimation or precise structural characterization.
3.3. Cell-Type Dependence of Impedance Characteristics
To examine the dependence of electrical properties on the cell type, impedance measurements were performed using cancer cell spheroids (DLD-1 and HepG2) and compared with HEK293T spheroids. Microscopic images of spheroids are shown in Figs. 6(a)–(c), where HEK293T, DLD-1, and HepG2 spheroids exhibited diameters of approximately 130 μm, 130 μm, and 120 μm, respectively. The frequency-dependent impedance characteristics showed that both DLD-1 and HepG2 spheroids followed similar trends, with impedance remaining nearly constant (\(\sim\)300 kΩ) at low frequencies and decreasing monotonically with increasing frequency to approximately 20 kΩ at 5 MHz. The overall impedance values of the cancer cell spheroids were lower than those of the HEK293T spheroids. The corresponding complex impedance plots, represented by fitted curves based on the equivalent circuit model, are shown in Fig. 6(d). For clarity, only the fitted curves are shown. The plots displayed semicircular characteristics with diameters of approximately 0.3 MΩ for both DLD-1 and HepG2 spheroids. The lower impedance observed in cancer cell spheroids may be attributed to differences in intrinsic cellular properties. Cancer cells exhibit altered membrane composition and increased membrane permeability 23, which can affect membrane capacitance and resistance. In addition, weaker cell–cell adhesion and a less compact cellular arrangement in cancer spheroids may facilitate ionic conduction through intercellular spaces 24. These factors can lead to an overall decrease in impedance compared with spheroids derived from normal HEK293T cells. These results suggest that impedance characteristics are influenced not only by spheroid size but also by intrinsic cellular properties.
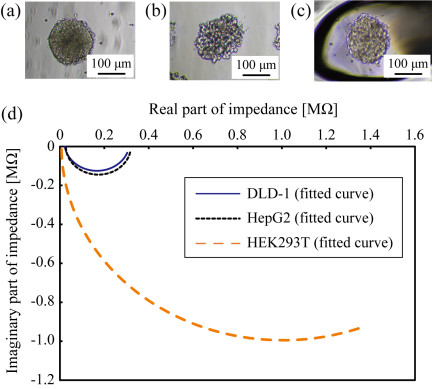
Fig. 6. Microscopic images of cell spheroids composed of (a) HEK293T, (b) DLD-1, and (c) HepG2 cells. (d) Comparison of the corresponding complex impedance plots based on fitted curves obtained using the equivalent circuit model for each spheroid type.
3.4. Evaluation of Spheroid Viability Using Surfactant Treatment
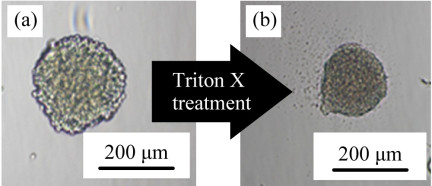
Fig. 7. Microscopic images of a HEK293T cell spheroid (200 μm diameter) (a) before and (b) after Triton X-100 treatment for 20 min.
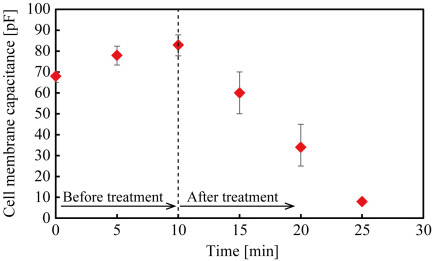
Fig. 8. Time-dependent changes in membrane capacitance of HEK293T cell spheroids before and after Triton X-100 treatment (\(n = 3\)).
To investigate whether cell viability can be assessed through electrical measurements, spheroids were treated with the surfactant Triton X-100, and their structural and electrical changes were evaluated. Microscopic observations (Fig. 7) show that spheroids with an initial diameter of approximately 250 μm shrank to about 190 μm after exposure to Triton X-100. After 20 min of treatment, dispersed individual cells were observed around the spheroids, indicating disruption of cell–cell adhesion due to membrane damage. Time-dependent changes in the electrical properties were further analyzed using an equivalent circuit model. The estimated cell membrane capacitance is shown in Fig. 8. Triton X-100 was introduced after 10 min in the measurement, as indicated on the time axis. A slight increase in membrane capacitance was observed prior to Triton X-100 treatment. This increase is unlikely to reflect an actual enlargement of the cell membrane surface area and may instead result from minor changes in the physical contact between the spheroid and the electrode surface over time. After surfactant application, a significant decrease in capacitance was observed. The membrane capacitance fell from approximately 80 pF to less than 10 pF after 15 min of Triton X-100 treatment. Assuming the specific membrane capacitance remains constant, this decrease corresponds to a reduction in the effective membrane surface area to less than one-eighth of the initial value. However, Triton X-100 induces membrane permeabilization and structural disruption, altering the membrane’s electrical properties. Consequently, the observed decrease in capacitance should be interpreted as reflecting not only a reduction in effective membrane area but also changes in membrane integrity and spheroid structure. These results indicate that impedance-based measurements can capture dynamic changes associated with cell membrane damage and loss of viability in spheroids. In the present study, Triton X-100 was used to induce membrane disruption and to evaluate the sensitivity of impedance measurements to changes in cellular integrity. However, it should be noted that Triton X-100 causes rapid and extensive membrane permeabilization, leading to disruption of cell–cell adhesion and structural disintegration of the spheroid. Therefore, this model represents an acute perturbation rather than a typical physiological cell death process. Consequently, the impedance changes observed in this study cannot be attributed solely to changes in cell viability and likely reflect a combination of viability loss and structural alterations within the spheroid. Further investigation using more physiologically relevant models, such as drug-induced apoptosis or hypoxia-related cell death, is necessary to distinguish these contributions and establish a more rigorous relationship between impedance signals and cell viability.
4. Conclusion
In this study, a microelectrode-based EIS system was developed for label-free evaluation of cell spheroids. The method successfully distinguished spheroids from the culture medium, with impedance values differing by approximately one order of magnitude. Size-dependent impedance variations were also characterized, with larger spheroids exhibiting increased extracellular and intracellular resistance. Distinct differences in electrical properties were identified between normal-derived and cancer cell spheroids, with cancer spheroids exhibiting lower overall impedance. In addition, surfactant-induced membrane disruption experiments showed that membrane disruption could be detected by impedance measurements through a marked decrease in membrane capacitance. These results indicate that EIS is a powerful tool for noninvasive, quantitative analysis of multicellular structures. However, because the impedance parameters are influenced by multiple physical and biological factors, the present approach is more suitable for comparative analyses—such as evaluating relative differences between experimental conditions, assessing treatment effects, or monitoring temporal changes within the same sample set—rather than for precise estimation of absolute structural parameters. The proposed technique shows strong potential for applications in drug screening, tissue engineering, and disease diagnostics. Future work will focus on improving measurement reproducibility and parameter estimation, and on correlating impedance measurements with structural characterization methods to establish more robust relationships between electrical parameters and the underlying biological states.
Acknowledgments
This work was partially supported by JSPS KAKENHI, Grant Numbers 23K13653 and 26K07525.
- [1] R. Langer and J. P. Vacanti, “Tissue Engineering,” Science, Vol.260, Issue 5110, pp. 920-926, 1993. https://doi.org/10.1126/science.8493529
- [2] K. Takahashi and S. Yamanaka, “Induction of Pluripotent Stem Cells from Mouse Embryonic and Adult Fibroblast Cultures by Defined Factors,” Cell, Vol.126, Issue 4, pp. 663-676, 2006. https://doi.org/10.1016/j.cell.2006.07.024
- [3] R. Nasiri, A. Sankaranthi, and G. Pratx, “Organ-on-a-chip systems for modeling tumor and normal tissue microenvironments in radiotherapy research,” Trends in Biotechnology, Vol.44, Issue 2, pp. 333-350, 2026. https://doi.org/10.1016/j.tibtech.2025.07.002
- [4] A. M. Bratt-Leal, R. L. Carpenedo, and T. C. McDevitt, “Engineering the embryoid body microenvironment to direct embryonic stem cell differentiation,” Biotechnology Progress, Vol.25, Issue 1, pp. 43-51, 2009. https://doi.org/10.1002/btpr.139
- [5] S. F. Abu-Absi, J. R. Friend, L. K. Hansen, and W.-S. Hu, “Structural Polarity and Functional Bile Canaliculi in Rat Hepatocyte Spheroids,” Experimental Cell Research, Vol.274, Issue 1, pp. 56-67, 2002. https://doi.org/10.1006/excr.2001.5467
- [6] C. S. Ong, X. Zhou, J. Han, C. Y. Huang, A. Nashed, S. Khatri, G. Mattson, T. Fukunishi, H. Zhang, and N. Hibino, “In vivo therapeutic applications of cell spheroids,” Biotechnology Advances, Vol.36, Issue 2, pp. 494-505, 2018. https://doi.org/10.1016/j.biotechadv.2018.02.003
- [7] S. Sant and P. A. Johnston, “The production of 3D tumor spheroids for cancer drug discovery,” Drug Discovery Today: Technologies, Vol.23, pp. 27-36, 2017. https://doi.org/10.1016/j.ddtec.2017.03.002
- [8] G. H. Underhill and S. R. Khetani, “Bioengineered Liver Models for Drug Testing and Cell Differentiation Studies,” Cellular and Molecular Gastroenterology and Hepatology, Vol.5, Issue 3, pp. 426-439, 2018. https://doi.org/10.1016/j.jcmgh.2017.11.012
- [9] H. Mihara, M. Kugawa, K. Sayo, F. Tao, M. Shinohara, M. Nishikawa, Y. Sakai, T. Akama, and N. Kojima, “Improved Oxygen Supply to Multicellular Spheroids Using a Gas-permeable Plate and Embedded Hydrogel Beads,” Cells, Vol.8, Issue 6, Article No.525, 2019. https://doi.org/10.3390/cells8060525
- [10] G. Mai, N. T. Huy, P. Morel, J. Mei, A. Andres, D. Bosco, R. Baertschiger, C. Toso, T. Berney, P. Majno, G. Mentha, D. Trono, and L. H. Buhler, “Treatment of fulminant liver failure by transplantation of microencapsulated primary or immortalized xenogeneic hepatocytes,” Xenotransplantation, Vol.12, Issue 6, pp. 457-464, 2005. https://doi.org/10.1111/j.1399-3089.2005.00248.x
- [11] S. Pengnam, S. Plianwong, P. Patrojanasophon, W. Radchatawedchakoon, B. Yingyongnarongkul, P. Opanasopit, and P. Charoensuksai, “Synergistic Effect of Doxorubicin and siRNA-Mediated Silencing of Mcl-1 Using Cationic Niosomes against 3D MCF-7 Spheroids,” Pharmaceutics, Vol.13, Issue 4, Article No.550, 2021. https://doi.org/10.3390/pharmaceutics13040550
- [12] L. F. E. Huerta-Nuñez, G. Gutierrez-Iglesias, A. Martinez-Cuazitl, M. M. Mata-Miranda, V. D. Alvarez-Jiménez, V. Sánchez-Monroy, A. Golberg, and C. A. González-Díaz, “A biosensor capable of identifying low quantities of breast cancer cells by electrical impedance spectroscopy,” Scientific Reports, Vol.9, Article No.6419, 2019. https://doi.org/10.1038/s41598-019-42776-9
- [13] Y. Hiraoka, T. Shimi, and T. Haraguchi, “Multispectral Imaging Fluorescence Microscopy for Living Cells,” Cell Structure and Function, Vol.27, Issue 5, pp. 367-374, 2002. https://doi.org/10.1247/csf.27.367
- [14] B. Eker, R. Meissner, A. Bertsch, K. Mehta, and P. Renaud, “Label-Free Recognition of Drug Resistance via Impedimetric Screening of Breast Cancer Cells,” PLOS ONE, Vol.8, Issue 3, Article No.e57423, 2013. https://doi.org/10.1371/journal.pone.0057423
- [15] A. Filipiak-Duliban, K. Brodaczewska, A. Kajdasz, and C. Kieda, “Spheroid Culture Differentially Affects Cancer Cell Sensitivity to Drugs in Melanoma and RCC Models,” Int. J. of Molecular Sciences, Vol.23, Issue 3, Article No.1166, 2022. https://doi.org/10.3390/ijms23031166
- [16] T. Himuro and Y. Saito, “Assessment of Deoxyribonuclease Activity Using DNA Molecules Immobilized Between Microelectrodes,” J. of Electronic Materials, Vol.50, No.2, pp. 537-542, 2021. https://doi.org/10.1007/s11664-020-08596-8
- [17] T. Himuro, S. Tsukamoto, and Y. Saito, “Fabrication of a Deoxyribonuclease Sensor Based on the Electrical Characteristics of DNA Molecules,” ACS Omega, Vol.7, Issue 27, pp. 23549-23554, 2022. https://doi.org/10.1021/acsomega.2c02069
- [18] Y. Wang, H. Wu, Y. Geng, Z. Zhang, J. Fu, J. Ouyang, and Z. Zhu, “Equivalent Circuit Modeling and Analysis for Microfluidic Electrical Impedance Monitoring of Single-Cell Growth,” Biosensors, Vol.15, Issue 2, Article No.113, 2025. https://doi.org/10.3390/bios15020113
- [19] F. Zhang, T. Jin, Q. Hu, and P. He, “Distinguishing skin cancer cells and normal cells using electrical impedance spectroscopy,” J. of Electroanalytical Chemistry, Vol.823, pp. 531-536, 2018. https://doi.org/10.1016/j.jelechem.2018.06.021
- [20] K. Iuchi, K. Oya, K. Hosoya, K. Sasaki, Y. Sakurada, T. Nakano, and H. Hisatomi, “Different morphologies of human embryonic kidney 293T cells in various types of culture dishes,” Cytotechnology, Vol.72, pp. 131-140, 2020. https://doi.org/10.1007/s10616-019-00363-w
- [21] C.-W. Huang, Y.-C. Lin, C.-H. Hung, H.-M. Chen, J.-T. Lin, C.-J. Wang, and S.-H. Kao, “Adenine inhibits the invasive potential of DLD-1 human colorectal cancer cell via the AMPK/FAK axis,” Pharmaceuticals, Vol.14, Issue 9, Article No.860, 2021. https://doi.org/10.3390/ph14090860
- [22] R. Negoro, M. Tasaka, S. Deguchi, K. Takayama, and T. Fujita, “Generation of HepG2 Cells with High Expression of Multiple Drug-Metabolizing Enzymes for Drug Discovery Research Using a PITCh System,” Cells, Vol.11, Issue 10, Article No.1677, 2022. https://doi.org/10.3390/cells11101677
- [23] M. Inbar, “Fluidity of membrane lipids: A single cell analysis of mouse normal lymphocytes and malignant lymphoma cells,” FEBS Letters, Vol.67, Issue 2, pp. 180-185, 1976. https://doi.org/10.1016/0014-5793(76)80361-4
- [24] E. Di Gregorio, S. Israel, M. Staelens, G. Tankel, K. Shankar, and J. A. Tuszyński, “The distinguishing electrical properties of cancer cells,” Physics of Life Reviews, Vol.43, pp. 139-188, 2022. https://doi.org/10.1016/j.plrev.2022.09.003
This article is published under a Creative Commons Attribution-NoDerivatives 4.0 Internationa License.