
Paper:
Plasmonic Coupling and Raman Enhancement in Two-Dimensional Arrays of Octahedral Au Nanoparticles
Xu Li*
 , Takeru Mizutani**, Manato Yoshikawa**, Satoshi Ogawa*
, Makoto Kuwahara*
, and Miho Tagawa*
*Institute of Materials and Systems for Sustainability, Nagoya University
Furo-cho, Chikusa-ku, Nagoya, Aichi 464-8603, Japan
**Department of Materials Science and Engineering, Nagoya University
Furo-cho, Chikusa-ku, Nagoya, Aichi 464-8603, Japan

Surface-enhanced Raman scattering (SERS) has been widely investigated as a sensitive technique for chemical and biological sensing. For applications such as intracellular sensing, nanoparticles used as SERS probes must be of an appropriate size to be introduced into cells while maintaining strong Raman enhancement. In this study, two-dimensional assemblies of octahedral gold nanoparticles (AuNPs) were investigated as a plasmonic sensing platform. The morphology and assembly structure of the octahedral AuNPs were characterized using scanning electron microscopy and scanning transmission electron microscopy. Localized plasmon modes in the nanoparticle assemblies were analyzed using electron energy loss spectroscopy. The results show that strong plasmon localization occurs in the gaps between neighboring octahedral AuNPs, indicating the formation of plasmonic hotspots. Raman measurements demonstrate that the assembled octahedral AuNPs provide clear SERS signals at analyte concentrations down to 100 nM, with a signal-to-noise ratio of 17.5 for the characteristic peak. Compared with conventional spherical nanoparticle systems, the faceted geometry of octahedral AuNPs enables smaller interparticle gaps and efficient plasmon coupling without requiring additional shell structures, or complex gap-engineering processes. These results suggest that shell-free assemblies of octahedral AuNPs provide a simple platform for correlating nanoscale LSPR localization with Raman enhancement and may serve as a basis for compact SERS probes toward future cellular sensing applications.
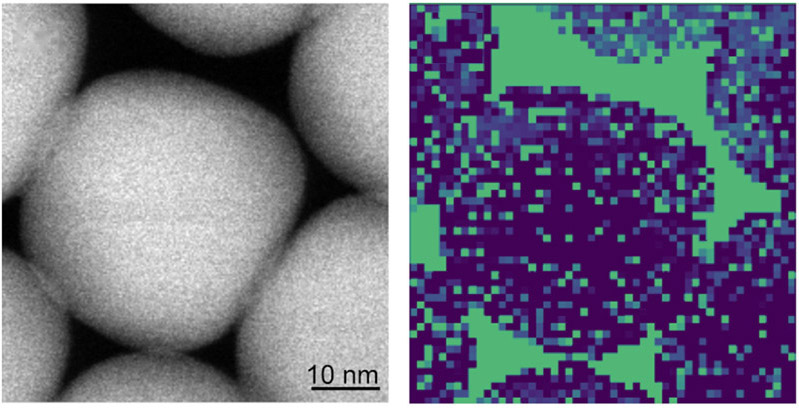
LSPR mapping of octahedral AuNPs
1. Introduction
Localized surface plasmon resonance (LSPR) in metallic nanoparticles has attracted considerable attention because of its ability to generate strong localized electromagnetic fields at the nanoscale 1,2. These plasmonic properties have been widely investigated for applications in sensing, spectroscopy, and nano-optics 3. Surface-enhanced Raman scattering (SERS) is an important application of plasmonic nanostructures. The enhancement of Raman signals originates from the localized electromagnetic fields generated by plasmon excitation in metallic nanostructures 4. The enhancement is particularly strong at nanoscale junctions between closely spaced nanoparticles, often referred to as plasmonic “hotspots.”
In many SERS systems, metallic nanoparticles are used to generate localized plasmonic hotspots. In particular, assemblies of spherical nanoparticles have been widely investigated 5,6,7. Owing to its high sensitivity and molecular selectivity, SERS has attracted significant attention as a powerful technique for chemical and biological sensing 5,8,9. However, strong Raman enhancement typically requires extremely small interparticle gaps, which are often achieved by introducing additional structures such as Ag shells or through complex nanofabrication processes 10,11. These approaches increase the complexity of substrate fabrication. Moreover, for applications such as intracellular SERS probes, the size of nanoparticles that can be introduced into cells is limited. Therefore, it is desirable to achieve strong SERS enhancement within a small nanoparticle volume.
Recently, anisotropic nanoparticles and nanoparticle plates with well-defined facets have attracted interest for plasmonic applications 12,13,14,15. Polyhedral gold nanocrystals such as cubes, octahedra, and rhombic dodecahedra exhibit well-defined crystal planes including the {100}, {111}, and {110} planes, which influence both their plasmonic properties and molecular adsorption behavior 16. Previous studies have shown that the SERS activity of gold nanocrystals is strongly shape-dependent because sharp edges and corners can generate localized electric-field enhancement under optical excitation 17. These studies primarily focused on evaluating the SERS performance using colloidal nanocrystals dispersed in a solution. Octahedral gold nanoparticles (AuNPs) are particularly attractive plasmonic building blocks because their sharp vertices and well-defined {111} facets promote strong electromagnetic field localization and enable the formation of highly ordered assemblies with controllable interparticle junctions. These features can enhance local electromagnetic fields and improve SERS performance 18,19,20. However, such systems often require hollow architecture, Ag shells, residual Ag bridges, or three-dimensional assembly processes. Furthermore, the relationship between the LSPR modes and the resulting SERS enhancement in ordered nanoparticle assemblies has not been sufficiently clarified.
In this study, we investigated shell-free two-dimensional assemblies of octahedral AuNPs as compact plasmonic sensing platforms. Compared with conventional spherical nanoparticles, polyhedral nanoparticles can form smaller interparticle gaps owing to their faceted geometries. In addition, their electronic structures are expected to enhance the SERS effect further. Therefore, two-dimensional assemblies of octahedral AuNPs were investigated as plasmonic sensing substrates. The nanoparticle assemblies were characterized by scanning electron microscopy (SEM) and scanning transmission electron microscopy (STEM), and the plasmonic enhancement was evaluated using SERS measurements. The localized plasmon modes were directly visualized using STEM-electron energy loss spectroscopy (EELS) mapping, revealing LSPR localization correlated with the observed SERS response. The results demonstrate that the octahedral AuNP arrays generate plasmon hotspots without requiring additional shell structures, indicating their potential as simple plasmon-based sensing platforms.
2. Experimental
2.1. Synthesis of Octahedral AuNP
Octahedral AuNPs were synthesized via a seed-mediated growth method 21,22,23. Gold seed particles were first prepared by the rapid reduction of tetrachloroauric acid (HAuCl\(_{4}\)) using freshly ice-cooled sodium borohydride (NaBH\(_{4}\)) in a cetyltrimethylammonium chloride (CTAC) aqueous solution. Reduction was performed by vigorous stirring at 30 °C. After hydrogen evolution subsided, the seed solution was aged and subsequently diluted with a CTAC solution to control the effective seed concentration.
For octahedral growth, a growth solution containing CTAC, HAuCl\(_{4}\), and ascorbic acid (AA) was prepared. AA acted as a mild reducing agent, reducing Au\(^{3+}\) to Au\(^{+}\), whereas the final reduction occurred preferentially on the seed surface. A two-step growth process was employed in this study. In the first stage, CTAC was used as a surfactant to promote controlled growth. In the second stage, cetyltrimethylammonium bromide (CTAB) was introduced to modulate facet stabilization. Prior to use, the CTAB solution was heated to 40 °C–50 °C until it became fully transparent to ensure complete dissolution of crystalline domains. The seed solution was injected into the growth solution and maintained at 30 °C without mechanical disturbance. After aging overnight, the resulting octahedral AuNPs were collected by centrifugation and washed twice with Milli-Q water before being redispersed in a 1 mM CTAB solution.
2.2. SEM and STEM-EELS Observation and Analysis
An aliquot (1 μL) of the as-prepared AuNP dispersion was drop-cast onto TEM grids coated with collodion support films (Ouken Shoji Co., Ltd.) and allowed to dry under ambient conditions. No additional conductive coatings were applied. SEM observations were performed using SU9000 (Hitachi High-Tech) and JSM-IT800 (JEOL) field-emission scanning electron microscopes. Samples were examined at an accelerating voltage of 15 kV. The probe current was adjusted between 5 μA and 20 μA, depending on the sample conditions, to optimize image contrast and minimize charging effects. STEM-EELS observations were performed using a JEM-ARM200F cold field-emission transmission electron microscope (JEOL) operated at an accelerating voltage of 200 kV. To visualize the spatial distribution of LSPR, EELS mapping of the AuNP samples was performed in the low-loss region. Each spectrum in the EELS dataset was fitted using five spectral components according to Eq. (1).
Component 0 corresponds to the zero-loss peak. Prior to the full fitting procedure, a pre-fitting step was carried out to optimize \({Ec}_0\), \(w_0\) and \(\eta\) for the zero-loss peak. Subsequently, the remaining parameters were refined. This fitting procedure was applied to every pixel in the EELS mapping dataset. Details of the EELS spectral fitting are provided in Fig. 4 in Appendix A.
2.3. inVia Raman Microscopy
Rhodamine B (RhB) solutions of \({1.0 \times 10^{-4}}\) M and \({1.0 \times 10^{-5}}\) M were prepared by dissolving RhB in Milli-Q water and diluting the solution to the desired concentrations. The AuNP dispersion in \({1.0 \times 10^{-3}}\) M CTAB solution was mixed with RhB solutions of \({1.0 \times 10^{-4}}\) M and \({1.0 \times 10^{-5}}\) M to achieve the target concentration and then stirred. One microliter of each sample was drop-cast onto a silicon substrate and allowed to dry. Raman spectra were recorded using an inVia Raman microscope (Renishaw). A 532 nm solid-state laser was used as the excitation source for SERS. A \({100{\times}}\) objective lens was used to focus the excitation light on an area that appeared to be a two-dimensional assembly and to collect the scattered light. The excitation power was optimized for all measurements. The exposure time during the measurement was 1.0 s. Fluorescence was removed by baseline subtraction using WiRE spectrometer software to obtain the Raman spectra of RhB.
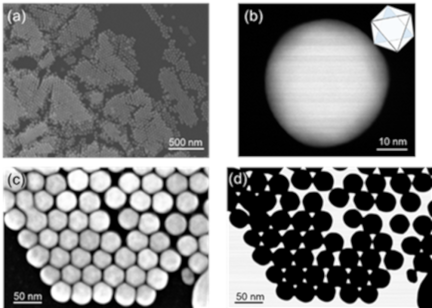
Fig. 1. (a, c) SEM and (b, d) STEM images of octahedral AuNPs.
3. Results
3.1. SEM Observations of Octahedral AuNPs
Figure 1 shows the morphology and assembly of the synthesized octahedral AuNPs. In Fig. 1(a), the low-magnification SEM image reveals that the nanoparticles self-assemble into extended two-dimensional domains after solvent evaporation on the silicon substrate. The assemblies consist of densely packed nanoparticle islands distributed over the substrate surface. Locally ordered arrangements of octahedral AuNPs were clearly observed. The octahedral AuNPs formed close-packed two-dimensional arrays with relatively uniform interparticle spacing. In addition to the single-layer arrangement, some regions exhibited stacked structures in which the nanoparticles were stacked vertically to form double-layer and occasionally triple-layer domains. These multilayered structures were observed at the boundaries of the nanoparticle islands, indicating that the assembly process proceeded in a layer-by-layer manner during solvent drying.
A representative STEM image of a single nanoparticle is shown in Fig. 1(b). The particle exhibited a well-defined octahedral geometry with smooth facets, which is consistent with the expected morphology enclosed by {111} crystallographic planes. The characteristic symmetric projection further confirms the formation of single-crystalline octahedral AuNPs.
The SEM image in Fig. 1(c) shows a closely packed arrangement of nanoparticles forming a two-dimensional array. The STEM image in Fig. 1(d) shows the octahedral geometry and packing configuration within the assembled domains. The particles are arranged with small interparticle gaps, which are expected to play a critical role in plasmonic coupling. Such nanoscale gaps are known to generate strong localized electromagnetic fields and are therefore important for SERS. These results confirm the successful synthesis of well-defined octahedral AuNPs and their spontaneous organization into two-dimensional arrays, providing an ideal platform for investigating plasmonic coupling effects using STEM-EELS and SERS measurements.
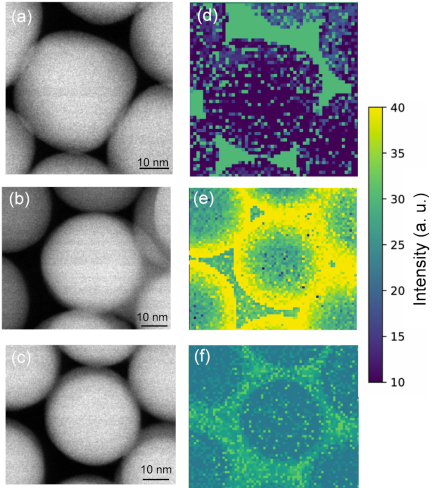
Fig. 2. (a–c) STEM images and (d–f) corresponding EELS intensity maps at 2.3–2.7 eV of octahedral AuNP assemblies. (a, d) Single-layer octahedral AuNPs; (b, e) coexistence of single-layer (darker particles) and double-layer (brighter particles) regions; and (c, f) double-layer octahedral AuNPs.
3.2. Plasmon Mapping of Octahedral AuNP Assemblies by STEM-EELS
Figure 2 shows the STEM images and the corresponding EELS plasmon intensity maps for different stacking configurations of octahedral Au nanoparticles. The plasmon maps were obtained by integrating the EELS signal in the energy range of 2.3–2.7 eV, which corresponds to the LSPR of the octahedral AuNPs. Figs. 2(a)–(c) present the STEM images of the nanoparticle assemblies with different stacking configurations. As shown in Fig. 2(a), the nanoparticles formed a single-layer structure, where all the particles were arranged in the same plane. In Fig. 2(b), both single-layer and double-layer regions coexist; the darker particles correspond to the single-layer region, whereas the slightly brighter particles indicate the presence of a second layer stacked above the first layer. Fig. 2(c) shows a region consisting entirely of a double-layer structure.
The corresponding EELS plasmon maps are shown in Figs. 2(d)–(f). In all cases, strong plasmon intensity was localized at the interparticle gaps between neighboring nanoparticles, indicating that plasmonic hotspots were primarily formed at these junctions. For regions with the same number of layers, the plasmon intensity did not show a clear dependence on the apparent size of the interparticle gap. However, at the boundaries between the single- and double-layer regions, particularly along the particle edges, a significantly stronger plasmon intensity was observed. This suggests that the structural discontinuities at the layer boundaries enhance plasmon localization. In addition, no significant change in the plasmon intensity was observed with increasing layer thickness. As shown in Figs. 2(d)–(f), the LSPR intensity remained comparable for each stacking configuration, indicating that the plasmon excitation was not strongly dependent on the number of layers. These results suggest that the LSPR behavior in octahedral AuNP assemblies is primarily governed by the interparticle junction geometry rather than by the overall thickness of the assembly. The interparticle gaps act as localized regions for plasmon excitation, which is expected to contribute to the Raman enhancement discussed in the next section.
3.3. SERS Detection
Figure 3 shows the Raman spectra obtained for octahedral AuNP assemblies at different analyte concentrations. Raman spectroscopy was performed at concentrations of 10 μM, 1 μM, and 100 nM. For the 10 μM sample, several characteristic Raman peaks are clearly observed. A strong peak appears around 1600 cm\(^{-1}\), together with several peaks in the range of 1200–1500 cm\(^{-1}\). As the concentration decreases from 10 μM to 1 μM and 100 nM, the Raman peak intensity gradually decreases, but the characteristic peaks remain detectable. For comparison, the Raman spectrum of a 10 μM solution without octahedral Au nanoparticles was measured. In this case, no clear Raman peaks were observed. This confirmed that the observed Raman signals originated from the enhancement effect of the nanoparticle assemblies.
This Raman enhancement can be explained by the plasmon localization observed by STEM-EELS measurements. As shown in Fig. 2, a strong plasmon intensity is localized at the interparticle gaps between neighboring nanoparticles. These nanoscale gaps act as electromagnetic hotspots and contribute to the enhancement of Raman signals.
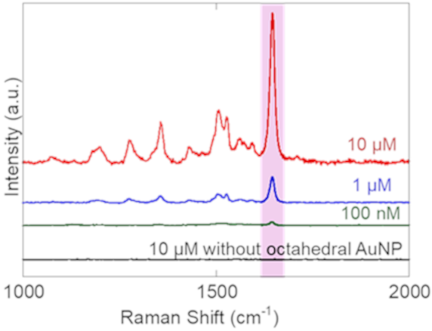
Fig. 3. Micro-Raman spectra of octahedral AuNPs assemblies measured at analyte concentrations of 10 μM (red), 1 μM (blue), and 100 nM (green). The Raman spectrum of the 10 μM analyte solution without octahedral AuNPs (black) is shown for comparison.
4. Discussion
The enhancement factor (EF) was estimated from the intensity ratio of the Raman peak at approximately 1646 cm\(^{-1}\) between the SERS spectrum and the normal Raman spectrum measured at a concentration of 10 μM, according to Eq. (2) 25,26. The signal-to-noise (S/N) ratio was calculated according to Eq. (3):
The calculated S/N ratios were approximately 120, 103, and 17.5 for 10 μM, 1 μM, and 100 nM RhB, respectively. These values confirm that the Raman signal remained clearly distinguishable from the background even at 100 nM. The estimated EF was on the order of 10\(^{3}\) at a concentration of 10 μM. This value was lower than that reported for highly engineered octahedral AuNP crystals. However, these systems generally rely on more complex structural designs, such as hollow structures, Ag shells, porous frameworks, or three-dimensional architectures. For example, Kim et al. reported an EF of \({2.5 \times 10^{6}}\) for three-dimensional tip-to-tip octahedral AuNP crystals containing residual Ag bridges, where strong electromagnetic hotspots were generated through the coupling of the lightning-rod effects at the nanoparticle tips 18. In addition, the lower enhancement observed in the present study is reasonable because the substrate consists of a simple two-dimensional assembly of shell-free octahedral AuNPs without Ag components or tip-to-tip junctions. Compared with conventional spherical AuNP assemblies, octahedral AuNPs can form smaller interparticle gaps owing to their faceted geometry. STEM-EELS measurements revealed that the plasmon modes were localized at the interparticle gaps, confirming that the SERS enhancement originated from plasmonic coupling between neighboring nanoparticles. Although the enhancement factor is lower than that of highly optimized three-dimensional architectures, the present substrate enables reliable detection down to 100 nM while maintaining a simple structure and fabrication process.
Importantly, the compact Au-only architecture is advantageous for future intracellular sensing applications, where the probe size, biocompatibility, and structural simplicity are important considerations. Thus, although the EF is moderate compared with that of highly engineered SERS substrates, the shell-free octahedral AuNP assembly provides a simple and compact sensing platform suitable for further development of intracellular sensing applications. This feature is advantageous for sensing applications because Raman enhancement can be achieved without additional metal coating or complex fabrication processes.
In this study, SERS measurements were performed using RhB molecules incorporated during the nanoparticle assembly. For practical intracellular sensing applications, structurally stabilized nanoparticle assemblies may be required before their introduction into cells. In such cases, analyte molecules must diffuse into the interparticle gaps after assembly formation, which may reduce the effective analyte concentration at the plasmonically active sites and consequently affect the detection limit. Future studies should focus on the development of DNA assembly strategies for octahedral AuNPs, ranging from two-dimensional arrays to three-dimensional crystals, to realize structurally stabilized plasmonic architectures suitable for intracellular sensing applications. Therefore, the present results should be regarded as proof-of-concept demonstration of plasmon-enhanced sensing using octahedral AuNP assemblies. Future work will focus on stabilization strategies and evaluation of sensing performance in biologically relevant environments.
5. Conclusion
In this study, two-dimensional assemblies of octahedral AuNPs were investigated as plasmonic sensing platforms. SEM and STEM observations confirmed that the octahedral AuNPs formed closely packed structures with nanoscale interparticle gaps. STEM-EELS measurements revealed that the localized plasmon modes are strongly concentrated at these gaps in the energy range of 2.3–2.7 eV. Raman measurements demonstrated that the nanoparticle assemblies provide clear SERS signals at analyte concentrations as low as 100 nM. The enhancement originates from the electromagnetic hotspots formed at the interparticle junctions, which is consistent with the plasmon localization observed in the EELS maps. Compared with conventional periodic structures composed of spherical nanoparticles, the faceted geometry of octahedral AuNPs facilitates efficient plasmon coupling and hotspot formation without requiring additional shell structures or complex gap-engineering processes. These results demonstrate that ordered assemblies of polyhedral nanoparticles provide a simple approach for constructing plasmonic-sensing substrates. Future studies should focus on DNA-mediated assembly strategies to construct structurally stabilized three-dimensional architectures suitable for intracellular sensing environments.
Acknowledgments
This research was partly supported by JSPS KAKENHI Grant Numbers JP 25H00832 and 25K24703 to M.T.
- [1] M. Haller et al., “Host-atom-driven transformation of a honeycomb oxide into a dodecagonal quasicrystal,” arXiv:2510.11426, 2025. https://doi.org/10.48550/arXiv.2510.11426
- [2] D. Denkova et al., “Mapping magnetic near-field distributions of plasmonic nanoantennas,” ACS Nano, Vol.7, No.4, pp. 3168-3176, 2013. https://doi.org/10.1021/nn305589t
- [3] A. J. Das, R. Shivanna, and K. S. Narayan, “Photoconductive NSOM for mapping optoelectronic phases in nanostructures,” Nanophotonics, Vol.3, Nos.1-2, pp. 19-31, 2014. https://doi.org/10.1515/nanoph-2013-0043
- [4] F. J. García-Vidal and J. B. Pendry, “Collective theory for surface enhanced Raman scattering,” Phys. Rev. Lett., Vol.77, No.6, pp. 1163-1166, 1996. https://doi.org/10.1103/PhysRevLett.77.1163
- [5] Y. Wy, H. Jung, J. W. Hong, and S. W. Han, “Exploiting plasmonic hot spots in Au-based nanostructures for sensing and photocatalysis,” Acc. Chem. Res., Vol.55, No.6, pp. 831-843, 2022. https://doi.org/10.1021/acs.accounts.1c00682
- [6] P. Wen et al., “Precise regulation and control of hotspots in nanoparticle multilayer SERS substrates,” Microchem. J., Vol.187, Article No.108371, 2023. https://doi.org/10.1016/j.microc.2022.108371
- [7] T. Ikeuchi et al., “DNA-programmed core–shell nanoparticle superlattice crystals with nanogaps for SERS sensing,” ACS Appl. Opt. Mater., Vol.4, No.7, pp. 2028-2039, 2026. https://doi.org/10.1021/acsaom.6c00173
- [8] K. Koike et al., “Quantitative drug dynamics visualized by alkyne-tagged plasmonic-enhanced Raman microscopy,” ACS Nano, Vol.14, No.11, pp. 15032-15041, 2020. https://doi.org/10.1021/acsnano.0c05010
- [9] Y. Han, S.-R. Wu, X.-D. Tian, and Y. Zhang, “Optimizing the SERS performance of 3D substrates through tunable 3D plasmonic coupling toward label-free liver cancer cell classification,” ACS Appl. Mater. Interfaces, Vol.12, No.26, pp. 28965-28974, 2020. https://doi.org/10.1021/acsami.0c04509
- [10] G. V. P. Kumar et al., “Hot spots in Ag core–Au shell nanoparticles potent for surface-enhanced Raman scattering studies of biomolecules,” J. Phys. Chem. C, Vol.111, No.11, pp. 4388-4392, 2007. https://doi.org/10.1021/jp068253n
- [11] J. Cao et al., “Fabrication of core shell Au@Ag supraparticles with 3D hotspots via evaporation self-assembly for sensitive surface enhanced Raman scattering detection,” Sens. Actuators B: Chem., Vol.382, Article No.133529, 2023. https://doi.org/10.1016/j.snb.2023.133529
- [12] T. Gao et al., “Ultrasensitive surface-enhanced Raman scattering platform for protein detection via active delivery to nanogaps as a hotspot,” ACS Nano, Vol.18, No.32, pp. 21593-21606, 2024. https://doi.org/10.1021/acsnano.4c09578
- [13] S. Park, J. Lee, and H. Ko, “Transparent and flexible surface-enhanced Raman scattering (SERS) sensors based on gold nanostar arrays embedded in silicon rubber film,” ACS Appl. Mater. Interfaces, Vol.9, No.50, pp. 44088-44095, 2017. https://doi.org/10.1021/acsami.7b14022
- [14] I. B. Becerril-Castro et al., “Gold nanostars: Synthesis, optical and SERS analytical properties,” Anal. Sens., Vol.2, No.3, Article No.e202200005, 2022. https://doi.org/10.1002/anse.202200005
- [15] L. Scarabelli, M. Coronado-Puchau, J. J. Giner-Casares, J. Langer, and L. M. Liz-Marzán, “Monodisperse gold nanotriangles: Size control, large-scale self-assembly, and performance in surface-enhanced Raman scattering,” ACS Nano, Vol.8, No.6, pp. 5833-5842, 2014. https://doi.org/10.1021/nn500727w
- [16] H.-L. Wu et al., “A comparative study of gold nanocubes, octahedra, and rhombic dodecahedra as highly sensitive SERS substrates,” Inorg. Chem., Vol.50, No.17, pp. 8106-8111, 2011. https://doi.org/10.1021/ic200504n
- [17] M. Mulvihill, A. Tao, K. Benjauthrit, J. Arnold, and P. Yang, “Surface-enhanced Raman spectroscopy for trace arsenic detection in contaminated water,” Angew. Chem. Int. Ed., Vol.47, No.34, pp. 6456-6460, 2008. https://doi.org/10.1002/anie.200800776
- [18] J. Kim et al., “Ensemble hot-spots in 3D supercrystals of plasmonic octahedral nanoparticles in tip-to-tip configured superlattices,” Nat. Commun., Vol.16, Article No.2762, 2025. https://doi.org/10.1038/s41467-025-58029-5
- [19] Y. Hu, J. Liao, D. Wang, and G. Li, “Fabrication of gold nanoparticle-embedded metal–organic framework for highly sensitive surface-enhanced Raman scattering detection,” Anal. Chem., Vol.86, No.8, pp. 3955-3963, 2014. https://doi.org/10.1021/ac5002355
- [20] C.-C. Chang, H.-L. Wu, C.-H. Kuo, and M. H. Huang, “Hydrothermal synthesis of monodispersed octahedral gold nanocrystals with five different size ranges and their self-assembled structures,” Chem. Mater., Vol.20, No.24, pp. 7570-7574, 2008. https://doi.org/10.1021/cm8021984
- [21] J. Czochralski, “Ein neues Verfahren zur Messung der Kristallisationsgeschwindigkeit der Metalle,” Z. Phys. Chem., Vol.92U, No.1, pp. 219-221, 1918 (in German). https://doi.org/10.1515/zpch-1918-9212
- [22] N. R. Jana, L. Gearheart, and C. J. Murphy, “Evidence for seed-mediated nucleation in the chemical reduction of gold salts to gold nanoparticles,” Chem. Mater., Vol.13, No.7, pp. 2313-2322, 2001. https://doi.org/10.1021/cm000662n
- [23] Y. Pu, Y. Zhao, P. Zheng, and M. Li, “Elucidating the growth mechanism of plasmonic gold nanostars with tunable optical and photothermal properties,” Inorg. Chem., Vol.57, No.14, pp. 8599-8607, 2018. https://doi.org/10.1021/acs.inorgchem.8b01354
- [24] D. J. Wales and J. P. K. Doye, “Global optimization by basin-hopping and the lowest energy structures of Lennard-Jones clusters containing up to 110 atoms,” J. Phys. Chem. A, Vol.101, No.28, pp. 5111-5116, 1997. https://doi.org/10.1021/jp970984n
- [25] J. R. Lombardi and R. L. Birke, “Theory of surface-enhanced Raman scattering in semiconductors,” J. Phys. Chem. C, Vol.118, No.20, pp. 11120-11130, 2014. https://doi.org/10.1021/jp5020675
- [26] E. C. Le Ru and B. Auguié, “Enhancement factors: A central concept during 50 years of surface-enhanced Raman spectroscopy,” ACS Nano, Vol.18, No.14, pp. 9773-9783, 2024. https://doi.org/10.1021/acsnano.4c01474
Appendix
Appendix A. Supporting Information
Figure 4 shows a representative EELS spectrum and the multi-peak fitting used for plasmon mapping, as described in Section 2.2. The same fitting procedure was applied to each pixel of the spectrum image to obtain the spatial distribution of the LSPR intensity.
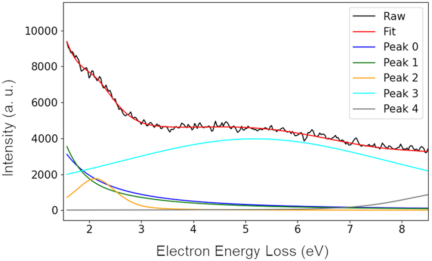
Fig. 4. Representative of EELS spectrum and multi-peak fitting used for plasmon mapping. The experimental EELS spectrum (black) and the fitted spectrum (red) are shown together with the individual fitting components (colored curves). The fitting model includes background/zero-loss components (Peaks 0 and 1), the LSPR component (Peak 2), and additional plasmon-loss components (Peaks 3 and 4). The fitting procedure was applied to the spectrum at each pixel in the spectrum image to generate spatially resolved plasmon intensity maps.
This article is published under a Creative Commons Attribution-NoDerivatives 4.0 Internationa License.