
Paper:
Salt-Dependent Crystallization of DNA-Functionalized Nanoparticle Superlattices in Microdroplets Toward Cellular Applications
Saki Kozawa*
 , Hiroya Arai*, Xu Li**
, Naotomo Tottori***
, Yoko Yamanishi***
, and Miho Tagawa**
*Department of Materials Science and Engineering, Nagoya University
Furo-cho, Chikusa-ku, Nagoya, Aichi 464-8603, Japan
**Institute of Materials and Systems for Sustainability, Nagoya University
Furo-cho, Chikusa-ku, Nagoya, Aichi 464-8603, Japan
***Department of Mechanical Engineering, Kyushu University
744 Motooka, Nishi-ku, Fukuoka, Fukuoka 819-0395, Japan

DNA-functionalized nanoparticle (DNA–NP) superlattices have attracted attention as programmable nanomaterials for sensing and bio-related applications, because DNA hybridization enables programmable interactions between nanoparticles and thus control of interparticle spacing. Such applications require controlling the size, shape, and crystallinity to maintain structural stability and achieve consistent physical properties. In this study, we investigated the crystallization behavior of DNA–NP assemblies formed in microdroplets under different NaCl concentrations. Crystallization occurred in water-in-oil droplets, which provided spatially confined reaction environments for DNA–NP assembly and enabled crystallization to proceed in numerous spatially isolated microreactors under well-defined conditions. Optical microscopy revealed that crystals were typically formed individually within droplets and exhibited narrow size distributions under each condition. Within the same NaCl concentration, the average crystal size generally varied with droplet diameter. Small-angle X-ray scattering analysis showed that increasing NaCl concentration resulted in broader diffraction peaks and fewer observable higher-order reflections, indicating a reduction in crystalline order. Scanning electron microscopy further revealed differences in crystal morphology. Well-defined faceted crystals were formed at lower NaCl concentrations, whereas rounded crystals were frequently formed at higher concentrations. Overall, salt concentration is an important factor governing the crystalline order and morphology of DNA–NP superlattices formed in microdroplets.
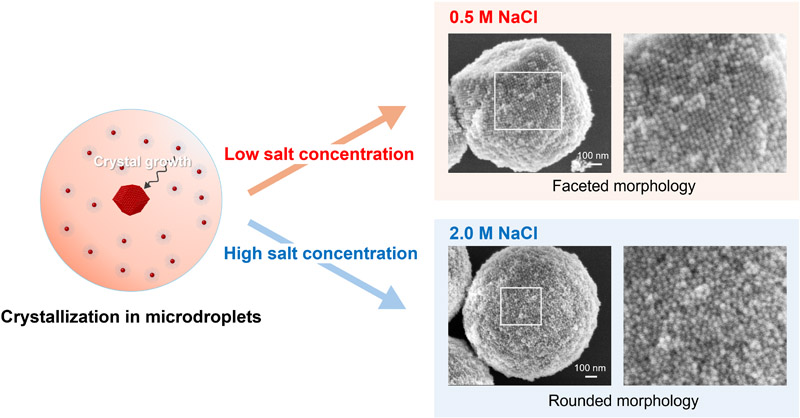
DNA-NP crystallization in microdroplets
1. Introduction
Periodic three-dimensional assemblies of nanoparticles exhibit collective properties that differ from those of individual particles 1,2,3. DNA-functionalized nanoparticle (DNA–NP) superlattices formed through self-assembly have attracted considerable interest, because their interparticle interactions can be programmed at the molecular level, enabling control over particle spacing, crystal symmetry, and lattice parameters 4,5. Gold nanoparticles have been widely used in medical and biosensing applications owing to their favorable biocompatibility. Therefore, gold-based nanostructures, including gold–DNA superlattices, are expected to be compatible with biological environments 6,7. When the interparticle distance is controlled at the nanometer scale, strong electromagnetic field enhancement arising from localized surface plasmon resonance can occur 8. Nanoparticle superlattices contain three-dimensionally distributed plasmonic hotspots that enable highly sensitive molecular detection 9,10. These characteristics suggest the potential of such structures for detecting biomolecules in cellular environments.
In optical applications, such as the detection of biomolecules in cellular environments, the electromagnetic field distribution within DNA–NP superlattices depends on structural parameters, such as crystal size, crystallinity, and crystal morphology 11,12. Therefore, controlling these parameters is important for obtaining stable optical properties. For intracellular applications, crystals must also possess sufficient mechanical stability to withstand stress during delivery. Additionally, the geometry of the introduced crystals can influence their interaction with the cell membrane, potentially affecting the extent of cellular damage during delivery 13. Because the mechanical response of nanoparticle superlattices is closely related to their structural order, crystals with higher crystallinity are expected to exhibit improved structural stability 14.
During the formation of DNA–NP superlattices, salt concentration affects both the DNA duplex stability and the effective interactions between DNA–NPs. Increasing the salt concentration generally stabilizes the DNA duplex formation, while also altering interparticle interactions through changes in the ionic environment surrounding the DNA and nanoparticle surfaces 15,16,17. At high ionic strengths, effective interparticle interactions may deviate from the conventional Derjaguin–Landau–Verwey–Overbeek theory, exhibiting longer-range attractions or repulsions compared with those expected from simple electrostatic screening 18. Previous studies have shown that salt concentration can alter lattice symmetry and interparticle spacing in DNA-linked colloidal crystals 19,20. More broadly, salt-dependent changes in interparticle interactions may influence the crystallization kinetics, crystal size, and morphology.
In conventional bulk crystallization, nucleation occurs stochastically at different times within a common solution reservoir 21. Consequently, differences in the nucleation time and solute depletion can lead to variations in the crystal growth duration and final crystal size 22. In contrast, microdroplets divide a solution into spatially isolated finite-volume crystallization compartments with controlled initial volumes and particle contents, thereby enabling many crystallization events to proceed in parallel with limited material exchange between compartments 23,24. Although nucleation remains stochastic within each droplet, the droplet volume constrains the available particle supply and maximum transport distance, which can affect the time required for particles or molecules to be incorporated into growing crystals 25,26. Previous studies using DNA-functionalized colloidal particles have shown that droplet-based crystallization can be used to statistically analyze nucleation and growth, control crystal size, and promote single-crystal formation; however, these studies mainly employed sub-micrometer particles, such as 600-nm-diameter polystyrene particles, which are more than one order of magnitude larger than the nanoparticles used in this study 24,25. Particle size affects the diffusion, growth, and coalescence of DNA-functionalized nanoparticle crystals 27,28. Therefore, the crystallization behavior observed for sub-micrometer colloids may not be directly applicable to nanoscale particles.
Salt-dependent crystallization of DNA–NPs has also been investigated in bulk solutions. Previous studies have shown that changes in salt concentration are associated with differences in interparticle interactions and spacing, crystal size, and lattice symmetry 19,20. However, in bulk systems, crystals that nucleate at different times experience different growth durations and particle supply conditions. This makes it difficult to separate the direct effect of salt concentration from crystal-to-crystal variations in the nucleation and growth history. Moreover, the effects of salt concentration on both the internal crystalline order and external morphology of DNA-functionalized gold nanoparticle (DNA–AuNP) superlattices under spatially confined conditions remain insufficiently understood.
In this study, we used microdroplets as isolated crystallization compartments to investigate the effect of NaCl concentration on DNA–AuNP superlattices. By controlling the initial droplet volume and particle content, we compared the salt-dependent crystallization under more standardized material supply conditions than those common in bulk solutions. The obtained crystals were evaluated using scanning electron microscopy (SEM) and small-angle X-ray scattering (SAXS) to characterize their external morphology and internal lattice order, respectively. Therefore, this study provides insight into how salt concentration affects both the internal and external structures of nanoscale DNA–AuNP superlattices formed under spatial confinement and provides a basis for future bio-related applications, including intracellular delivery and sensing.
2. Experimental
2.1. Preparation of DNA–Functionalized Nanoparticles
DNA–AuNPs were prepared according to a previously reported method 29,30. Single-stranded DNA with a thiol group at the 5\('\) end (Nihon Gene Research Laboratories Inc., Japan) was added to a dispersion of spherical gold nanoparticles with a diameter of 20 nm (Nanopartz).
DNA was attached to the nanoparticle surface using a salt-aging process in which the NaCl concentration was gradually increased. Excess DNA was removed through centrifugation, and the particles were redispersed in phosphate buffer. Four different DNA strands were used in this study. Two thiolated-DNA strands, #1 and #2, were attached to the AuNP surfaces to prepare two types of DNA–AuNPs. Two linker-DNA strands, #3 and #4, were designed to hybridize with the particle-bound DNA strands, thereby bridging the two types of DNA–AuNPs and inducing superlattice formation. Details on the DNA strands can be found in our previous study 29.
2.2. Droplet Generation and Crystallization
DNA–AuNP superlattices were formed in crystallization droplets dispersed in oil, following our previously reported droplet-based approach 31. The droplets were generated using a microfluidic device fabricated by standard soft lithography. A mold was prepared by patterning SU-8 photoresist on a substrate, and polydimethylsiloxane was cast on the mold to replicate the microchannel structures. The molded PDMS was then bonded to a glass substrate. The solution and oil phases were introduced into the device using a pressure-driven flow control system (Flow EZ, Fluigent, LU-FEZ-7000).
The DNA–AuNP and linker-DNA solutions were mixed in the microchannel at a flow rate ratio of \(1:1\). The mixed solution was subsequently sheared using an oil phase consisting of isopropyl palmitate containing 7 wt% ABIL EM180 (Evonik Operations GmbH), resulting in droplet formation. The flow rates of the crystallization solutions were maintained constant, whereas the oil flow rate was varied under two different conditions for each salt concentration. The flow rates of the two crystallization solutions were each set to 1 μL/min. The oil flow rates were set to 1 and 2 μL/min for NaCl concentrations of 0.5, 1.0, and 2.0 M and to 1 and 4 μL/min for the 0.25-M condition to obtain droplets with comparable size ranges.
The condition with the highest oil flow rate was defined as the small-droplet (S) condition, whereas the condition with the lowest oil flow rate was defined as the large-droplet (L) condition. The final concentrations in the droplets were 0.005 pmol/μL for each DNA–AuNP strand (#1 and #2) and 2 pmol/μL for each linker-DNA strand (#3 and #4). The NaCl concentrations in the crystallization solutions were set to 0.25, 0.5, 1.0, and 2.0 M.
The obtained droplets were cooled from 65°C to 25°C at a rate of 0.1°C per 10 min using a temperature-controlled chamber (IS401, Yamato), resulting in the formation of DNA–AuNP superlattices.
2.3. SAXS and SEM Characterization
Structural characterization of the DNA–AuNP crystals were performed using SAXS. SAXS measurements was performed using the structural biology beamline BL40B2 at SPring-8. The X-ray source was a bending magnet; the camera length was 4 m; and the X-ray wavelength was 1.1 Å. Scattering patterns were recorded using a two-dimensional detector (Pilatus3 S2M). For SAXS measurements, the crystallized droplet samples were loaded into a quartz capillary (OD 1.0 mm, Hilgenberg), and scattering patterns were obtained through X-ray irradiation.
For SEM observation, the crystals were prepared using a silver nitrate treatment according to a previously reported method 32. This treatment stabilizes the DNA-bridged structure and preserves crystal morphology under vacuum conditions. Specifically, the crystals collected from the oil droplets were transferred to a phosphate buffer with the same NaCl concentration as that of the crystallization condition. Silver nitrate was then added, and the reaction was allowed to proceed at 25°C. After the reaction, 0.5 μL of the sample was dropped onto a Si substrate, dried, and observed using a scanning electron microscope (S-4800, Hitachi High Technologies) at an accelerating voltage of 5 kV and a beam current of 5 μA.
Images of the droplets were obtained using an optical microscope (IX83, Olympus). The images were analyzed to determine the droplet diameters and evaluate the sizes of the crystals formed in each droplet.
2.4. Ultraviolet–Visible (UV–VIS) and Dynamic Light Scattering (DLS) Measurements
UV–VIS absorbance measurements were performed to evaluate the temperature-dependent behavior of the DNA–AuNP solution. A spectrophotometer (V-730BIO, JASCO) equipped with a water-cooled Peltier cell holder (ETCS-761, JASCO) was used for the measurements. The sample was sealed in a capillary tube (CAP-100Q, JASCO). The absorbance at 258 nm was monitored while cooling the sample from 65°C to 25°C at a rate of 0.1°C/min.
DLS measurements were performed to evaluate the diffusion behavior of the DNA–AuNP solution. A zeta potential and particle size analyzer (ELSZ-2000ZS, Otsuka Electronics) was used for the measurements. The sample was sealed in a micro cell and measured while cooling from 65°C to 25°C at a rate of 1°C/min, with measurements taken at intervals of 1°C–5°C.
3. Results and Discussion
3.1. Crystallization Behavior in Microdroplets
DNA–AuNP crystallization in droplets was first examined using optical microscopy. Fig. 1(a) shows a representative optical micrograph of droplets after crystallization (0.5 M (L)). Crystals were observed as high-contrast objects inside individual droplets, and in most droplets, a single crystal was formed. This observation suggests that crystallization proceeded independently in each droplet.
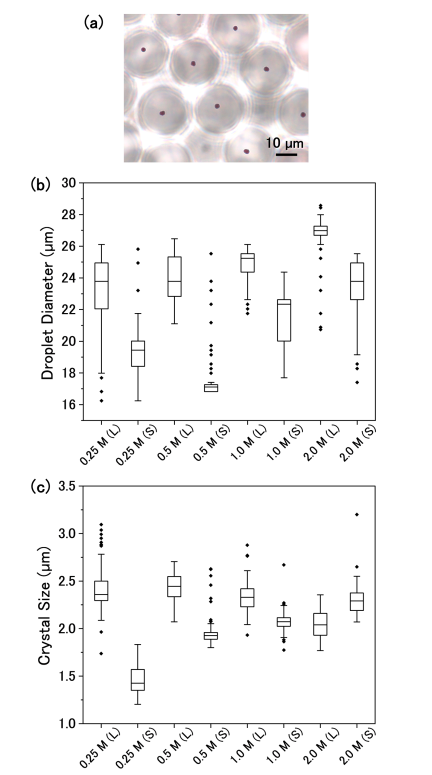
Fig. 1. (a) Optical micrograph of droplets after crystallization (0.5 M NaCl; large droplets). (b) Distribution of droplet diameters under different NaCl concentrations (0.25, 0.5, 1.0, and 2.0 M) and flow conditions (S: small droplets; L: large droplets). Diameters were measured from optical micrographs before crystallization (\(n = 75\)–375). Boxes indicate the interquartile range (25%–75%), and the horizontal line represents the median. (c) Distribution of crystal sizes obtained from droplets under different NaCl concentrations and flow conditions (\(n = 37\)–130). Crystal sizes were estimated from optical micrographs assuming a hexagonal projection.
The size distribution of droplets obtained under each NaCl concentration and flow condition is shown in Fig. 1(b). The generated droplets had diameters ranging from approximately 18–27 μm. The average droplet diameter was approximately 25 μm for the L condition and approximately 21 μm for the S condition. The coefficient of variation (\(\mathrm{CV} = \textrm{standard deviation}~/~\textrm{mean}\)) ranged from 4.5% to 9.9%.
The size distribution of crystals formed within the droplets is shown in Fig. 1(c). Crystal sizes were determined based on optical micrographs after crystallization. Most crystals exhibited an approximately hexagonal projected shape, consistent with a projection of the rhombic dodecahedral equilibrium morphology expected for a bcc crystal. Therefore, the projected shape of each crystal was approximated as a regular hexagon, and the crystal size was defined as the length of its long diagonal. The crystal size distribution was relatively narrow for each condition, with the coefficients of variation ranging from 4.6% to 11.3%.
Comparison of crystal sizes across different NaCl concentrations should be interpreted with caution, because NaCl concentration affects not only the final crystal size but also the lattice constant and crystalline order, as shown in the following sections. Therefore, crystal sizes measured under different NaCl concentrations are not directly comparable based on their external dimensions alone. To evaluate the effect of droplet size independently of these salt-dependent structural differences, the L and S conditions were compared primarily within the same NaCl concentration, whereby differences in droplet size were accompanied by corresponding differences in crystal size. For NaCl concentrations other than 2.0 M, the average crystal size in the large-droplet samples was consistently larger than that in the small-droplet samples by approximately 0.3–1.0 μm. In contrast, at 2.0 M, the average crystal size in the small-droplet samples was approximately 0.3 μm larger than that in the large-droplet samples, which may reflect the variation in droplet size. Overall, within each NaCl concentration, the relative differences in crystal size generally followed those in droplet diameter, suggesting that the available droplet volume influenced the final crystal size.
These results indicate that droplet-based crystallization enables the formation of crystals with relatively low size dispersity, while within the same NaCl concentration, the final crystal size can be partially tuned by varying the droplet size. This controllability is advantageous for preparing crystals with dimensions suited to the intended intracellular delivery method.
3.2. Effect of Salt Concentration on Crystallinity
To evaluate the crystal structure formed in droplets, SAXS measurements were performed for samples prepared under different NaCl concentrations. Fig. 2(a) compares the SAXS profiles obtained for small-droplet samples. All samples exhibited diffraction peaks consistent with a bcc lattice, indicating that the DNA–AuNP crystals formed in the droplets adopted the same bcc structure over the investigated NaCl concentration range. However, systematic changes in the diffraction profiles were observed with increasing NaCl concentration. In particular, the number of observable higher-order peaks gradually decreased. In addition, the first diffraction peak broadened and shifted toward higher \(q\)-values at higher NaCl concentrations. These changes indicate a reduction in crystalline order and a decrease in the lattice constant as the NaCl concentration increases.
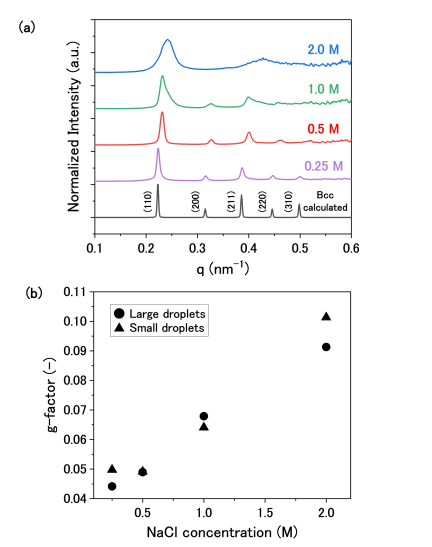
Fig. 2. (a) SAXS profiles of DNA–AuNP crystals formed in droplets at different NaCl concentrations. Profiles were obtained from crystals formed in small droplets. The bottom curve shows the calculated bcc diffraction pattern. (b) g-factor values evaluated from the first SAXS diffraction peak by the first peak profile fitting. Circles and triangles represent large and small droplets, respectively.
To quantitatively evaluate the peak broadening observed in the diffraction profiles, lattice disorder was assessed using the g-factor based on Hosemann’s paracrystalline theory 33. The g-factor is a dimensionless parameter that represents the magnitude of relative lattice distortions; an ideal crystal with no positional or lattice spacing disorder has \(g = 0\), and the value increases with increasing lattice disorder. In this study, the analysis was performed for the first diffraction peak of the structure factor obtained from SAXS. The peak profile was fitted with a pseudo-Voigt function while accounting for crystallite size broadening. From the fitting results, the distortion-related peak width \(\beta_\mathit{dist}\) was extracted, and the g-factor was calculated using the corresponding relation 29. The resulting g-factor values for each NaCl concentration are shown in Fig. 2(b). Increasing g-factor with increasing NaCl concentration indicates greater lattice disorder in the DNA–AuNP crystals formed at higher ionic strengths. Higher salt concentration stabilizes DNA duplex formation and alters interparticle interactions 15,17,18, which may promote particle attachment during crystal growth. If particle incorporation outpaces structural rearrangement, kinetically trapped configurations may remain within the growing crystal 34,35. The resulting positional and lattice spacing disorder would broaden the diffraction peaks and reduce their intensities, with the effect on higher-order reflections being more pronounced 33.
3.3. Morphology of DNA–AuNP Crystals
To further examine the influence of NaCl concentration on crystal morphology, SEM observations were performed for crystals obtained at NaCl concentrations of 0.5 and 2.0 M (Fig. 3). At the lower NaCl concentration (i.e., 0.5 M), many crystals exhibited well-defined polyhedral shapes consistent with rhombic dodecahedra (Fig. 3(a)). The nanoparticles on the crystal surfaces appeared to be relatively well ordered, and step-like features were frequently observed on the crystal facets (Fig. 3(b)). In contrast, at the higher NaCl concentration (i.e., 2.0 M), many crystals exhibited rounded shapes without clearly defined crystal facets (Fig. 3(c)). In addition, the nanoparticle arrangement on the crystal surfaces appeared less ordered, and regions with locally disordered nanoparticle arrangements were occasionally observed (Fig. 3(d)).
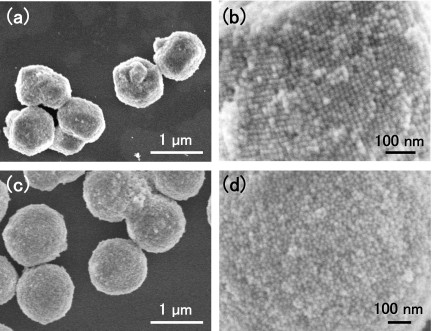
Fig. 3. SEM images of DNA–AuNP crystals formed in droplets at NaCl concentrations of 0.5 and 2.0 M after AgNO\(_3\) stabilization treatment. (a, b) Crystals obtained at 0.5 M NaCl. (c, d) Crystals obtained at 2.0 M NaCl.
These observations demonstrate that crystal morphology and surface organization vary with NaCl concentration, suggesting differences in the crystal growth pathway. At 0.5 M NaCl, the step-like surface features suggest a step-mediated growth mechanism 36. Under this condition, anisotropic growth, in which different crystallographic faces grew at different rates, may have led to the formation of well-defined faceted crystals 37. In contrast, the rounded morphology and disordered surface observed at 2.0 M NaCl may reflect a condition in which particle incorporation proceeded more rapidly relative to the structural rearrangement required for ordering, thereby favoring kinetically trapped disorder 34,35. Together with the SAXS results in Section 3.2, these observations indicate that the loss of well-defined external faceting at high NaCl concentration was accompanied by increased disorder within the nanoparticle lattice. These correlated changes suggest that the ionic environment influenced both crystal morphology and internal structural order likely through changes in the crystal growth pathway.
3.4. Relationship Between Ionic Environment and Crystallization Behavior
To investigate the effect of NaCl concentration on the self-assembly behavior of DNA–NP in solution, temperature-dependent UV–VIS absorbance measurements and DLS measurements of the diffusion coefficient were performed.
Figure 4(a) shows the temperature dependence of the absorbance at 258 nm during cooling for the 0.5 and 2.0 M NaCl conditions. UV–VIS absorbance was measured during cooling from 65°C to 25°C. Because the absorbance was unstable during the initial stage of cooling, only data obtained in the range of 60°C–25°C after temperature stabilization were used for normalization and analysis. For both samples, the absorbance changed abruptly at a characteristic temperature during cooling. This transition is attributed to a change in the association state of the DNA–AuNPs induced by DNA hybridization. Notably, the transition occurred at a higher temperature for the 2.0 M NaCl sample compared with that for the 0.5 M sample. This shift is consistent with the greater stability of the DNA duplexes at higher salt concentrations 15.
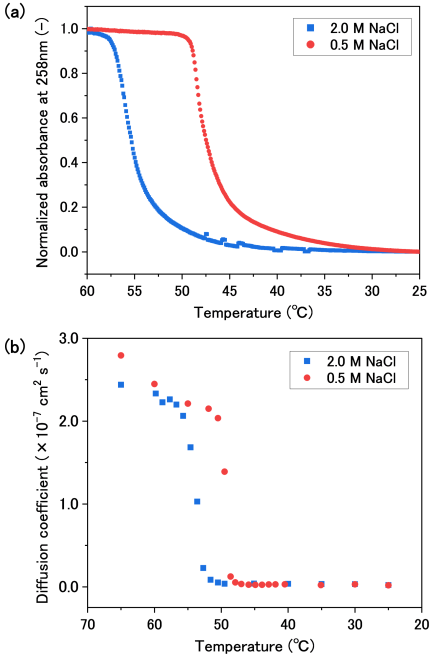
Fig. 4. Temperature dependence of the solution behavior of DNA–AuNPs at NaCl concentrations of 0.5 and 2.0 M. (a) Normalized absorbance at 258 nm measured using UV–VIS spectroscopy. (b) Diffusion coefficients obtained by DLS.
The diffusion coefficients of the nanoparticle solutions during cooling were also measured using DLS, and the results are shown in Fig. 4(b). Under comparable temperature conditions, the diffusion coefficient for the 2.0 M NaCl solution was consistently smaller than that for the 0.5 M solution. This difference may reflect changes in the effective interparticle interactions that depend on salt concentration 17,18; nevertheless, the influence of changes in solution viscosity cannot be ruled out.
Overall, the UV–VIS and DLS measurements suggest that the association and dispersion states of the DNA–AuNPs depend on the NaCl concentration. UV–VIS and DLS probe different aspects of the same DNA-mediated assembly process: UV–VIS absorbance at 258 nm mainly reflects the average changes in DNA hybridization and base stacking, whereas DLS reflects changes in the hydrodynamic size of the particle assemblies. Therefore, the relative order of these changes provides information on how DNA binding and particle assembly proceed during cooling. In the 2.0-M NaCl condition, the absorbance change appeared at a higher temperature compared with that of the diffusion coefficient change, suggesting that DNA-mediated binding had already progressed appreciably before the formation of particle assemblies large enough to be detected by DLS. Under such conditions, particle assembly may proceed after DNA-mediated interparticle binding has become relatively stable, which may influence subsequent particle rearrangement. In contrast, in the 0.5-M NaCl condition, the diffusion coefficient change appeared at a higher temperature compared with that of the UV–VIS change. This behavior suggests that partial DNA-mediated binding may first produce small clusters that are detectable by DLS, followed by further DNA hybridization and growth over a broader temperature range. Such a gradual assembly process is consistent with the possibility that particle rearrangement occurs during growth. Although these measurements do not directly resolve nucleation and growth within individual droplets, they indicate that the solution state of the DNA–AuNPs varies with NaCl concentration. These differences may contribute to the salt-dependent crystallinity and morphology of the resulting crystals.
For future application of the obtained crystals to intracellular sensing, appropriately designing both the delivery method and the post-crystallization solution conditions is essential. Although the crystals obtained in this study, with sizes of approximately 1.5–2.5 μm, are relatively large for efficient endocytic uptake by non-phagocytic cells 38,39, direct physical delivery methods may enable their introduction into cells 40. Furthermore, although the NaCl concentrations used for crystallization (0.25–2.0 M) are higher than the physiological ionic strength, post-crystallization chemical stabilization of the DNA-linked structures followed by gradual exchange into a lower-ionic-strength solution may enable transfer of the crystals into a more biologically compatible environment, while preserving their structure 32,41. Therefore, the control of the crystal size and crystallinity through droplet size and salt concentration demonstrated in this study may provide a basis for biological applications combining direct physical delivery with post-crystallization stabilization and solution exchange.
4. Conclusion
In this study, the crystallization behavior of DNA–AuNP assemblies formed in microdroplets was investigated under different NaCl concentrations. Crystallization in microdroplets yielded crystals with relatively narrow size distributions, and, within the same NaCl concentration, the crystal size could be partially controlled by varying the droplet diameter. Structural analysis using SAXS revealed that increasing the NaCl concentration resulted in broader diffraction peaks and the disappearance of higher-order reflections, indicating a reduction in crystalline order at higher ionic strengths. SEM observations further suggested that different salt concentrations led to distinct crystal growth behaviors, with more clearly faceted crystals observed at lower NaCl concentration and more rounded crystals observed at higher NaCl concentration. Overall, lower NaCl concentrations are favorable for obtaining highly crystalline DNA–AuNP crystals. By combining salt concentration control with droplet size tuning, this approach may provide a basis for preparing DNA–AuNP crystals with controlled size and crystalline order for bio-related applications. Further integration of this crystallization approach with direct physical delivery and post-crystallization stabilization may facilitate the application of DNA–AuNP crystals under biologically relevant conditions.
Acknowledgments
This research was partly supported by JSPS KAKENHI through funding to M.T. (Grant Numbers JP 19H02555, 25H00832, and 25K24703) and JST CREST (Grant Number JPMJCR19S6). The synchrotron radiation experiments were performed at the BL40B2 of SPring-8 with the approval of the Japan Synchrotron Radiation Research Institute (JASRI) (Proposal No. 2025B1705).
- [1] A. Taleb, C. Petit, and M. P. Pileni, “Optical Properties of Self-Assembled 2D and 3D Superlattices of Silver Nanoparticles,” The J. of Physical Chemistry B, Vol.102, No.12, pp. 2214-2220, 1998. https://doi.org/10.1021/jp972807s
- [2] G. Rainò, M. A. Becker, M. I. Bodnarchuk, R. F. Mahrt, M. V. Kovalenko, and T. Stöferle, “Superfluorescence from lead halide perovskite quantum dot superlattices,” Nature, Vol.563, No.7733, pp. 671-675, 2018. https://doi.org/10.1038/s41586-018-0683-0
- [3] N. S. Mueller, E. Pfitzner, Y. Okamura, G. Gordeev, P. Kusch, H. Lange, J. Heberle, F. Schulz, and S. Reich, “Surface-Enhanced Raman Scattering and Surface-Enhanced Infrared Absorption by Plasmon Polaritons in Three-Dimensional Nanoparticle Supercrystals,” ACS Nano, Vol.15, No.3, pp. 5523-5533, 2021. https://doi.org/10.1021/acsnano.1c00352
- [4] D. Nykypanchuk, M. M. Maye, D. Van der Lelie, and O. Gang, “DNA-guided crystallization of colloidal nanoparticles,” Nature, Vol.451, pp. 549-552, 2008. https://doi.org/10.1038/nature06560
- [5] R. J. Macfarlane, B. Lee, M. R. Jones, N. Harris, G. C. Schatz, and C. A. Mirkin, “Nanoparticle Superlattice Engineering with DNA,” Science, Vol.334, No.6053, pp. 204-208, 2011. https://doi.org/10.1126/science.1210493
- [6] V. Kumari, S. Vishwas, R. Kumar, V. Kakoty, R. Khursheed, M. R. Babu, V. Harish, N. Mittal, P. K. Singh, N. S. Alharthi, M. A. Hakami, F. F. Aba Alkhayl, G. Gupta, G. D. Rubis, K. R. Paudel, M. Singh, M. Zandi, B. G. Oliver, K. Dua et al., “An overview of biomedical applications for gold nanoparticles against lung cancer,” J. of Drug Delivery Science and Technology, Vol.86, Article No.104729, 2023. https://doi.org/10.1016/j.jddst.2023.104729
- [7] N. Ramakrishnan, M. Lee, Y. Choi, S. Kim, J. Kim, and Y. Kwon, “Deciphering Gold Nanoparticle-Induced Cytotoxicity for Safer Nanomedicine Applications: Exploring the Impact of Conjugation Chemistry, Functional Groups, and Metal Core Properties,” ACS Applied Nano Materials, Vol.8, No.51, pp. 24301-24313, 2025. https://doi.org/10.1021/acsanm.5c03906
- [8] B. Yan, Y.-y. Zhu, Y. Wei, and H. Pei, “Study on surface enhanced Raman scattering of Au and Au@AlO spherical dimers based on 3D finite element method,” Scientific Reports, Vol.11, No.1, Article No.8391, 2021. https://doi.org/10.1038/s41598-021-87997-z
- [9] H. Liu, Z. Yang, L. Meng, Y. Sun, J. Wang, L. Yang, J. Liu, and Z. Tian, “Three-Dimensional and Time-Ordered Surface-Enhanced Raman Scattering Hotspot Matrix,” J. of the American Chemical Society, Vol.136, No.14, pp. 5332-5341, 2014. https://doi.org/10.1021/ja501951v
- [10] T. Ikeuchi, S. Kozawa, H. Niinomi, X. Li, S. Ogawa, M. Kuwahara, T. Oshikiri, K. Hiramatsu, and M. Tagawa, “DNA-Programmed Core–Shell Nanoparticle Superlattice Crystals with Nanogaps for SERS Sensing,” ACS Applied Optical Materials, Vol.4, No.7, pp. 2028-2039, 2026. https://doi.org/10.1021/acsaom.6c00173
- [11] M. B. Ross, J. C. Ku, V. M. Vaccarezza, G. C. Schatz, and C. A. Mirkin, “Nanoscale form dictates mesoscale function in plasmonic DNA-nanoparticle superlattices,” Nature Nanotechnology, Vol.10, No.5, pp. 453-458, 2015. https://doi.org/10.1038/nnano.2015.68
- [12] M. B. Ross, J. C. Ku, M. G. Blaber, C. A. Mirkin, and G. C. Schatz, “Defect tolerance and the effect of structural inhomogeneity in plasmonic DNA-nanoparticle superlattices,” Proc. of the National Academy of Sciences, Vol.112, No.33, pp. 10292-10297, 2015. https://doi.org/10.1073/pnas.1513058112
- [13] S. Nangia and R. Sureshkumar, “Effects of Nanoparticle Charge and Shape Anisotropy on Translocation through Cell Membranes,” Langmuir, Vol.28, No.51, pp. 17666-17671, 2012. https://doi.org/10.1021/la303449d
- [14] X. W. Gu, X. Ye, D. M. Koshy, S. Vachhani, P. Hosemann, and A. P. Alivisatos, “Tolerance to structural disorder and tunable mechanical behavior in self-assembled superlattices of polymer-grafted nanocrystals,” Proc. of the National Academy of Sciences, Vol.114, No.11, pp. 2836-2841, 2017. https://doi.org/10.1073/pnas.1618508114
- [15] C. Schildkraut and S. Lifson, “Dependence of the melting temperature of DNA on salt concentration,” Biopolymers, Vol.3, No.2, pp. 195-208, 1965. https://doi.org/10.1002/bip.360030207
- [16] X. Zhang, J.-S. Zhang, Y.-Z. Shi, X.-L. Zhu, and Z.-J. Tan, “Potential of mean force between like-charged nanoparticles: Many-body effect,” Scientific Reports, Vol.6, No.1, Article No.23434, 2016. https://doi.org/10.1038/srep23434
- [17] Q. Yu, J. Chen, D. Shi, and M. Chen, “Ordered self-assembly of DNA-modified nanoparticles in salt solutions,” Colloids and Surfaces A: Physicochemical and Engineering Aspects, Vol.671, Article No.131669, 2023. https://doi.org/10.1016/j.colsurfa.2023.131669
- [18] Y. Li, M. Girard, M. Shen, J. A. Millan, and M. O. de la Cruz, “Strong attractions and repulsions mediated by monovalent salts,” Proc. of the National Academy of Sciences, Vol.114, No.45, pp. 11838-11843, 2017. https://doi.org/10.1073/pnas.1713168114
- [19] S. E. Seo, B. Lee, T. Oh, M. Girard, and C. A. Mirkin, “Salt-Induced Polymorphs Observed in Colloidal Single Crystals,” J. of the American Chemical Society, Vol.147, No.38, pp. 34831-34839, 2025. https://doi.org/10.1021/jacs.5c10844
- [20] S. E. Seo, M. Girard, M. O. de la Cruz, and C. A. Mirkin, “The Importance of Salt-Enhanced Electrostatic Repulsion in Colloidal Crystal Engineering with DNA,” ACS Central Science, Vol.5, No.1, pp. 186-191, 2019. https://doi.org/10.1021/acscentsci.8b00826
- [21] C. Brandel and J. H. ter Horst, “Measuring induction times and crystal nucleation rates,” Faraday Discussions, Vol.179, pp. 199-214, 2015. https://doi.org/10.1039/C4FD00230J
- [22] T. Karmakar, P. M. Piaggi, and M. Parrinello, “Molecular Dynamics Simulations of Crystal Nucleation from Solution at Constant Chemical Potential,” J. of Chemical Theory and Computation, Vol.15, No.12, pp. 6923-6930, 2019. https://doi.org/10.1021/acs.jctc.9b00795
- [23] F. Bourgeois, S. Teychené, and B. Biscans, “Applicability of Probabilistic Nucleation Modelling for the Analysis of Microfluidics Data,” KONA Powder and Particle J., Vol.35, No.0, pp. 258-272, 2018. https://doi.org/10.14356/kona.2018017
- [24] A. Hensley, W. M. Jacobs, and W. B. Rogers, “Self-assembly of photonic crystals by controlling the nucleation and growth of DNA-coated colloids,” Proc. of the National Academy of Sciences, Vol.119, No.1, Article No.e2114050118, 2022. https://doi.org/10.1073/pnas.2114050118
- [25] A. Hensley, T. E. Videbæk, H. Seyforth, W. M. Jacobs, and W. B. Rogers, “Macroscopic photonic single crystals via seeded growth of DNA-coated colloids,” Nature Communications, Vol.14, No.1, Article No.4237, 2023. https://doi.org/10.1038/s41467-023-39992-3
- [26] M. Maeki, Y. Teshima, S. Yoshizuka, H. Yamaguchi, K. Yamashita, and M. Miyazaki, “Controlling Protein Crystal Nucleation by Droplet-Based Microfluidics,” Chemistry – A European J., Vol.20, No.4, pp. 1049-1056, 2014. https://doi.org/10.1002/chem.201303270
- [27] S. V. Koniakhin, I. E. Eliseev, I. N. Terterov, A. V. Shvidchenko, E. D. Eidelman, and M. V. Dubina, “Molecular dynamics-based refinement of nanodiamond size measurements obtained with dynamic light scattering,” Microfluidics and Nanofluidics, Vol.18, Nos.5-6, pp. 1189-1194, 2015. https://doi.org/10.1007/s10404-014-1512-x
- [28] S. Dhakal, K. L. Kohlstedt, G. C. Schatz, C. A. Mirkin, and M. O. de la Cruz, “Growth Dynamics for DNA-Guided Nanoparticle Crystallization,” ACS Nano, Vol.7, No.12, pp. 10948-10959, 2013. https://doi.org/10.1021/nn404476f
- [29] H. Sumi, N. Ohta, H. Sekiguchi, S. Harada, T. Ujihara, K. Tsukamoto, and M. Tagawa, “Two-Step Nanoparticle Crystallization via DNA-Guided Self-Assembly and the Nonequilibrium Dehydration Process,” Crystal Growth & Design, Vol.21, No.8, pp. 4506-4515, 2021. https://doi.org/10.1021/acs.cgd.1c00398
- [30] H. Sumi, N. Ohta, H. Sekiguchi, S. Harada, T. Ujihara, K. Tsukamoto, and M. Tagawa, “Designing a High-Crystallinity Nano-Gapped Particle Superlattice via DNA-Guided Colloidal Crystallization and Dehydration,” Crystal Growth & Design, Vol.22, No.6, pp. 3708–3718, 2022. https://doi.org/10.1021/acs.cgd.2c00075
- [31] N. Tottori, M. Tagawa, A. Takao, L. Zhang, M. Yokomori, S. Sakuma, and Y. Yamanishi, “Thermally Regulated Droplet Microfluidics Enables Uniform, Size Controllable DNA Nanoparticle Superlattices,” Small, Vol.22, No.54, Article No.e74787, 2026. https://doi.org/10.1002/smll.74787
- [32] T. Oh, S. S. Park, and C. A. Mirkin, “Stabilization of Colloidal Crystals Engineered with DNA,” Advanced Materials, Vol.31, No.1, Article No.1805480, 2019. https://doi.org/10.1002/adma.201805480
- [33] R. Hosemann and A. M. Hindeleh, “Structure of crystalline and paracrystalline condensed matter,” J. of Macromolecular Science, Part B, Vol.34, No.4, pp. 327-356, 1995. https://doi.org/10.1080/00222349508219497
- [34] Y. Xia, X. Xia, and H.-C. Peng, “Shape-Controlled Synthesis of Colloidal Metal Nanocrystals: Thermodynamic versus Kinetic Products,” J. of the American Chemical Society, Vol.137, No.25, pp. 7947-7966, 2015. https://doi.org/10.1021/jacs.5b04641
- [35] J. Kim, S. Kang, F. Cheng, Y. Wang, X. Ye, and J. Park, “Recent advances in liquid phase transmission electron microscopy of nanoparticle growth and self-assembly,” MRS Bulletin, Vol.49, No.4, pp. 365-376, 2024. https://doi.org/10.1557/s43577-024-00702-z
- [36] C. A. Orme, A. Noy, A. Wierzbicki, M. T. McBride, M. Grantham, H. H. Teng, P. M. Dove, and J. J. DeYoreo, “Formation of chiral morphologies through selective binding of amino acids to calcite surface steps,” Nature, Vol.411, No.6839, pp. 775-779, 2001. https://doi.org/10.1038/35081034
- [37] L. D. Marks and L. Peng, “Nanoparticle shape, thermodynamics and kinetics,” J. of Physics: Condensed Matter, Vol.28, No.5, Article No.053001, 2016. https://doi.org/10.1088/0953-8984/28/5/053001
- [38] I. Canton and G. Battaglia, “Endocytosis at the nanoscale,” Chemical Society Reviews, Vol.41, No.7, pp. 2718-2739, 2012. https://doi.org/10.1039/c2cs15309b
- [39] M. V. Baranov, M. Kumar, S. Sacanna, S. Thutupalli, and G. Van Den Bogaart, “Modulation of Immune Responses by Particle Size and Shape,” Frontiers in Immunology, Vol.11, Article No.607945, 2021. https://doi.org/10.3389/fimmu.2020.607945
- [40] Y.-C. Wu, T.-H. Wu, D. L. Clemens, B.-Y. Lee, X. Wen, M. A. Horwitz, M. A. Teitell, and P.-Y. Chiou, “Massively parallel delivery of large cargo into mammalian cells with light pulses,” Nature Methods, Vol.12, No.5, pp. 439-444, 2015. https://doi.org/10.1038/nmeth.3357
- [41] E. Auyeung, R. J. Macfarlane, C. H. J. Choi, J. I. Cutler, and C. A. Mirkin, “Transitioning DNA-Engineered Nanoparticle Superlattices from Solution to the Solid State,” Advanced Materials, Vol.24, No.38, pp. 5181-5186, 2012. https://doi.org/10.1002/adma.201202069
This article is published under a Creative Commons Attribution-NoDerivatives 4.0 Internationa License.