
Paper:
Local Chemical Delivery to Single Bacterium at Micro Narrow Gap
Yifeng Dong*, Dibo Yang*, and Tadashi Ishida*,**

*Department of Mechanical Engineering, Institute of Science Tokyo
4529 Nagatsuta-cho, Midori-ku, Yokohama, Kanagawa 226-8501, Japan
**Laboratory for Future Interdisciplinary Research of Science and Technology, Institute of Integrated Research, Institute of Science Tokyo
4529 Nagatsuta-cho, Midori-ku, Yokohama, Kanagawa 226-8501, Japan

Bacterial phenotypic heterogeneity is important to increase survival probability when the environment turns into a severe condition for bacteria. Conventional statistical analysis of bulk populations typically masks physiologically important signals from minorities owing to the averaging process of the mixture of minorities and majorities in the bacterial population. To study minor bacteria with phenotypic heterogeneity, single-cell analysis of a bacterial population is required. Although standard single-cell analysis investigates the condition of every bacterium at the moment of processing, a technique to investigate the temporal reaction of a single bacterium against local chemical exposure has not been developed. Here, we developed a microfluidic device with a narrow gap and size that was slightly smaller than the typical size of bacteria (approximately 1 μm). This device can trap a single bacterium at the narrow gap by applying pressure to attract bacteria, and expose the trapped single bacterium to chemical solution by adjusting the pressure balance between the narrow and wide ends of the gap. We achieved single-bacterium trapping of Escherichia coli and Bacillus subtilis, local chemical delivery to the single bacterium trapped at the narrow gap for 30 min, which is comparable to the bacterial generation time.
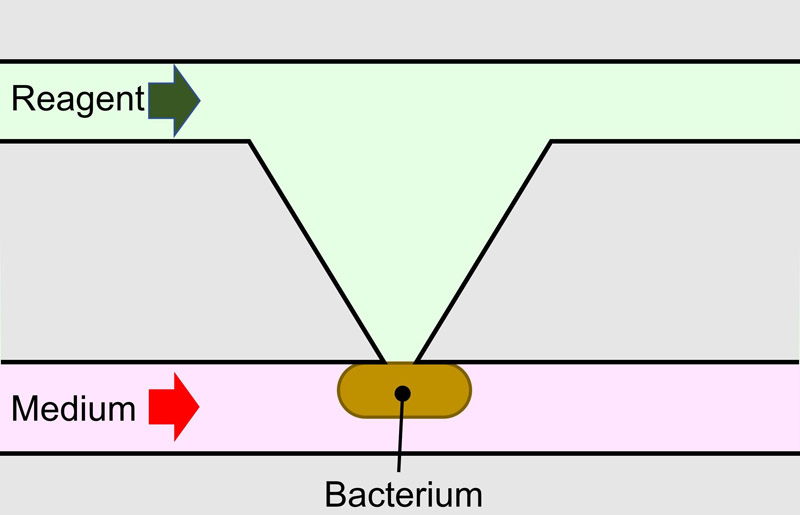
Chemical delivery to single bacterium
1. Introduction
Bacteria in isogenic populations rapidly adapt to environmental changes by exhibiting broad phenotypic variation, a phenomenon known as phenotypic heterogeneity 1. This heterogeneity is manifested in various bacterial traits, including metabolism 2, growth rate 3, and antibiotic resistance 4. It plays important roles in survival strategies, such as the bet-hedging strategy 5, where individual bacteria stochastically express phenotypes that may be maladapted to the current environment, while ensuring population survival during sudden changes. Another example is persister bacteria 6, which enter a dormant state to survive antimicrobial treatments and serve as a reservoir for recurring infections.
The conventional gold standard in experimental biology relies on the statistical analysis of bulk populations. This approach requires experimental data obtained from a large number of bacteria to increase signals of biological molecules, such as nucleic acids and proteins, above the detection limit. The averaged data between bacterial groups are compared with or without specific chemical/physical stimuli. Consequently, physiologically important signals from minority groups in a bacterial population with phenotypic heterogeneity are often masked and difficult to analyze. To address this issue, high-precision measurement methods have been developed to analyze signals at the single-cell level.
Standard single-cell analysis methods, such as flow cytometry and next-generation sequencing 7, can characterize every cell in terms of phenotypic heterogeneity and identify the unique traits of minorities. Although these single-cell analysis methods can measure the condition of bacteria at the moment of processing, temporal changes in a single target bacterium cannot be measured. Monitoring these dynamics requires a technique for local chemical delivery to a single bacterium.
Local chemical delivery to a single bacterium is challenging because of the small target size, as bacteria (approximately 1 μm) are much smaller than eukaryotic cells (approximately 10 μm), difficulty in the alignment of chemical delivery comparable to the bacterial size, and diffusion to surrounding bacteria. Although a technique for short-term, pulsed chemical stimuli to a single bacterium exists, that is, a bacterium is instantaneously stimulated by the laser-induced photolysis of a caged compound 8, the amount of the caged compound is limited and the chemical delivery dissipates rapidly in the long term. Furthermore, laser irradiation may affect the cellular behavior of target bacteria. To investigate the real-time responses of a single target bacterium in a bacterial population under the precise control of local stimuli, especially the quorum sensing mechanism 9 and the early stage environmental adaptation of bacteria 10, stable stimuli for a duration comparable to the bacterial generation time (tens of minutes) are required. In a microchamber or microdroplet, where the concentration of chemicals is controlled, a single target bacterium is isolated in the microchamber or droplet and its behavior is measured over a long period. However, the target isolated bacterium may show a different behavior compared to the bacterium surrounded by other bacteria, which is their natural form.
In this study, we developed a microfluidic device with a narrow gap that is slightly smaller than the size of the bacterium. A single bacterium cannot pass through a narrow gap, which results in trapping of the single bacterium. A chemical solution can be delivered to the trapped bacterium for tens of minutes owing to the stable liquid control.
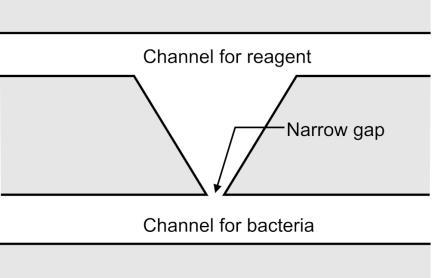
Fig. 1. Schematic illustration of a microfluidic device with a narrow gap.
2. Microfluidic Device with a Narrow Gap
2.1. Overview
Figure 1 illustrates a microfluidic device with a narrow gap. The device has a narrow gap connecting the two microchannels. To prevent passage, the width of the narrow gap was designed to be slightly smaller than the typical bacterial size (approximately 1 μm). The lower and upper channels are for bacteria and reagents, respectively. One of the bacteria in the channel for bacteria was dragged to the narrow gap by applying negative pressure to the channel for the reagent relative to the channel for bacteria. The bacterium cannot pass through and is trapped because it clogs the gap, resulting in the trapping of a single bacterium at the narrow gap. When the reagent is to be delivered to a single bacterium in a narrow gap, the position of the liquid-liquid interface between the solutions from the channels for bacteria and reagent is precisely aligned at that of the narrow gap by balancing the pressures at the channels for bacteria and reagents. In this process, the pressure in the channel for the reagent is maintained lower than that in the channel for bacteria to hold a single bacterium in a narrow gap. Furthermore, a single bacterium can easily approach and close the gap, and the liquid-liquid interface can be controlled. This results in chemical delivery to a single trapped bacterium.
2.2. Design
Figure 2 shows the design of a microfluidic device with a narrow gap. The key component of this device is the narrow gap. The narrow gap should be smaller than 1 μm, which is almost the fabrication limit of photolithography, to trap a bacterium at the gap. The height of the microfluidic device is designed to be 1 μm to avoid the overlap of bacteria and to make it easy to close the gap with a single bacterium.
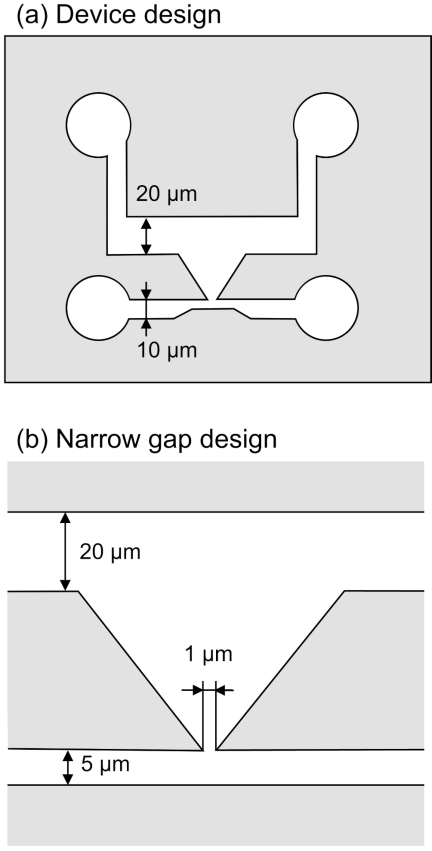
Fig. 2. Design of a microfluidic device with a narrow gap. (a) Device design. (b) Narrow gap design.
The width of the channel for bacteria is 5 μm to restrict the number of bacteria. The width of the channel for the reagent should be large to precisely control the position of the liquid-liquid interface, whereas the channel is easily closed by its collapse when the aspect ratio of the channel is low. We experimentally decided that the width was 20 μm. The material of the microfluidic device with a narrow gap was polydimethylsiloxane (PDMS) owing to its precise processability and high gas permeability. Furthermore, the base-to-agent ratio of PDMS was selected to be \({8:1}\) for high stiffness to prevent the collapse of the microchannels.
2.3. Fabrication Process
Figure 3 shows the fabrication process of a microfluidic device with a narrow gap. The microfluidic device was fabricated via soft lithography using a photolithographed mold 11. First, a cleaned silicon wafer was covered by vapor of hexamethyldisilazane (HMDS), and was baked for 1 min at 200 °C (Fig. 3(a)). A positive photoresist (AZ5214E, Merck) was spincoated at 6000 rpm, and prebaked for 10 min at 100 °C (Fig. 3(b)). The photoresist was patterned using a digital mirror device (DMD, DDB-701-DL-10-TI-SEC, Neoark) at a photo intensity of 120 mW/cm\(^2\) and an exposure time of 1.2 s (Fig. 3(c)) and developed using 2.5% tetramethylammonium hydroxide (Kanto Chemical) (Fig. 3(d)). The photoresist pattern was covered by vapor of HMDS, and was baked for 1 min at 200 °C, resulting in a mold (Fig. 3(e)).
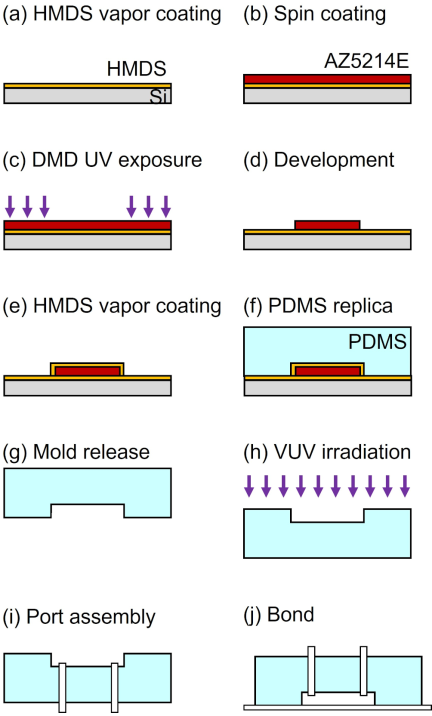
Fig. 3. Fabrication process. (a) HMDS vapor coating on a cleaned silicon wafer. (b) Spin-coating of AZ5214E on the wafer. (c) UV exposure with DMD. (d) Development. (e) HMDS vapor coating of an AZ5214E mold. (f) PDMS replication. (g) PDMS replica release from the mold. (h) VUV irradiation for activation. (i) Pipe insertion into the PDMS replica. (j) Bonding between the PDMS replica and a glass substrate.
Next, PDMS (SILPOT 184, Dow-Toray. \({\textrm{Base} : \textrm{agent}} = {8:1}\)) was poured on the mold, degassed, and baked for 1 h at 100 °C (Fig. 3(f)). The cured PDMS was then detached from the mold, resulting in a PDMS replica (Fig. 3(g)). The PDMS replica and cover glass were irradiated by vacuum ultraviolet (VUV) light (Fig. 3(h)). The fluidic ports were assembled into a PDMS replica (Fig. 3(i)). The PDMS replica and cover glass were bonded by baking for 1 h at 100 °C (Fig. 3(j)).
2.4. Fabricated Microfluidic Device
Figure 4 shows the fabricated microfluidic device with a narrow gap. The entire microfluidic device was fabricated without any collapses of the channels, even though the aspect ratio was low (the height was \(1.1{\pm}0.1\) μm; standard deviation). The width of the narrow gap was less than 1.0 μm (Fig. 4(b)). The width of the channel for bacteria was 5.9 μm, and that of the channel for reagent was 20 μm.
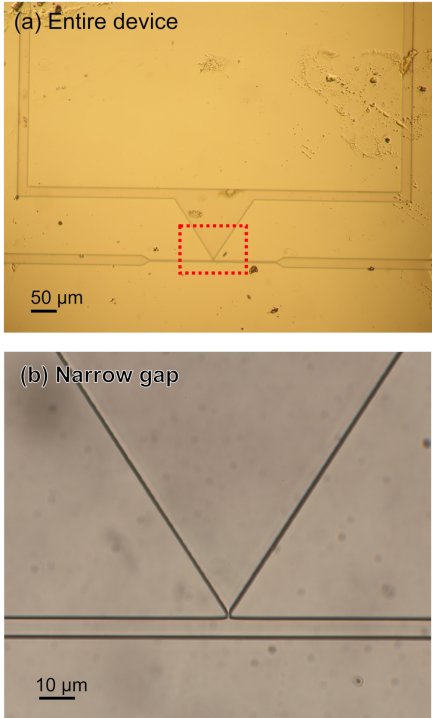
Fig. 4. Fabricated microfluidic device with a narrow gap. (a) Entire device. (b) Zoomed-up image of narrow gap (red square with dashed line in (a)).
3. Experimental Setup
Figure 5 shows the experimental setup. A microfluidic device with a narrow gap was mounted on an inverted microscope (IX73, Olympus) and connected to a pressure pump (LineUp Flow EZ 2000, Fluigent) through inlet 1 (the inlet of the channel for bacteria) and another pressure pump (LineUp Push-Pull, Fluigent) through inlet 2 (the inlet of the channel for the reagent). Outlets 1 and 2 (channels for the bacteria and reagents, respectively) were open to the atmosphere. Pressures at inlet 1 (\(\mathrm{P}_1\)) and inlet 2 (\(\mathrm{P}_2\)) could be controlled independently in the range from 0 to 200 kPa and from \(-80\) to 100 kPa, respectively. The pressure difference, \(\mathrm{P}_1\)–\(\mathrm{P}_2\), dragged a bacterium, and a single bacterium was trapped in a narrow gap. To adjust the position of the liquid-liquid interface in the narrow gap, \(\mathrm{P}_1\) and \(\mathrm{P}_2\) are often several kPa. However, it should be noted that the adequate pressures to trap bacteria and adjust the liquid-liquid interface were different in each experiment, owing to the variation in dimensions and position of the trapped bacterium.
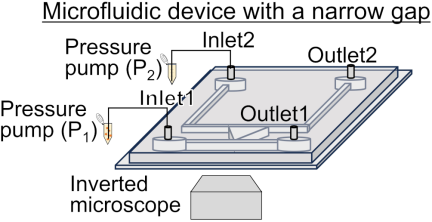
Fig. 5. Experimental setup.
The bacterial suspensions in the culture medium were introduced into the bacterial channel. The important bacterial parameters were their size and generation time. The size of the bacteria should be larger than the narrow gap for trapping, and the chemical exposure time should be comparable to the generation time for bacterial reactions throughout the cell cycle. We selected Escherichia coli (E. coli) K-12 W3110 and Bacillus subtilis (B. subtilis) RM125 strains. E. coli K-12 W3110 are Gram-negative bacilli, typically 2 μm in length, 1 μm in width, and have a generation time of 20–30 min. B. subtilis RM125 are Gram-positive bacilli, typically a few to more than ten μm in length, 1 μm in width, and have a generation time of 20–40 min. The optical density of the bacterial suspensions was adjusted to be 0.01.
The culture medium and solution were introduced into the channel for the reagent. Lysogeny broth (LB) was prepared by mixing 10 g Bacto tryptone (Difco), 5 g yeast extract (Difco), and 10 g NaCl (Nacalai Tesque) in 900 mL of water and 1 mL of ampicillin (100 mg/mL). For this purpose, 1 mM fluorescein sodium (Fujifilm) was used.
4. Experimental Procedure
4.1. Trap of a Single Bacterium
The LB culture medium was introduced into the channel for the reagent by applying \(\mathrm{P}_2\), which was a few tens of kPa (Fig. 6(a)). The bacterial suspension was introduced into the channel by increasing \(\mathrm{P}_1\) within 100 kPa because the fluid resistance was high (Fig. 6(b)). After the introduction of the bacterial suspension, \(\mathrm{P}_1\) was decreased, while maintaining a positive pressure difference by decreasing \(\mathrm{P}_2\). The flow in the narrow gap was generated from the channel for bacteria to that for the reagent, leading to the trapping of bacteria in the narrow gap. Note that the trapping force applied to a bacterium is different for each microfluidic device owing to the fabrication error of the narrow gap. Although the pressure difference was empirically determined to be approximately a few kPa, it was adjusted to an appropriate value for the trapping of a single bacterium in each trial. Furthermore, some bacteria can be trapped, whereas others can pass through because of the size distribution of the bacteria.
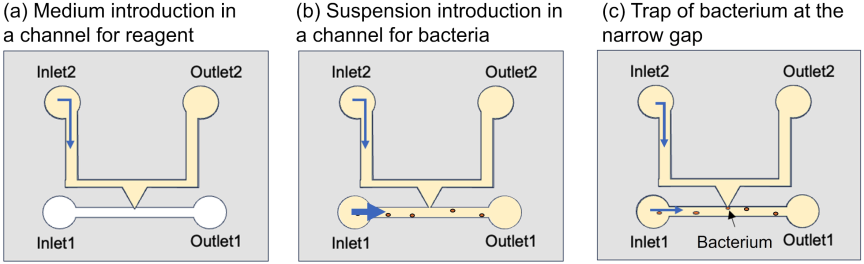
Fig. 6. Procedure to trap of single bacterium. (a) Channel for reagent was filled with culture medium. (b) Bacterial suspension was introduced into the channel for bacteria. (c) Bacterium was trapped at the narrow gap by adjusting the negative pressure.
4.2. Local Chemical Delivery
The microfluidic device was initially filled with culture medium, and a single bacterium was trapped in a narrow gap using the procedure described in Section 4.1. \(\mathrm{P}_1\) was maintained at the pressure at which a single bacterium was trapped. The liquid flowed through the narrow gap between the channel for the bacteria and that for the reagent. A liquid-liquid interface was generated in the channel for the reagent (Fig. 7(a)). By gradually increasing \(\mathrm{P}_2\), where the step height and slope are 0.1 kPa and 1.0 kPa/s, respectively, the liquid-liquid interface subsequently moves to the channel for bacteria. The step height and slope are down to 0.1 kPa and 0.1 kPa/s, when the liquid-liquid interface is close to the narrow gap. The position of the liquid-liquid interface was precisely aligned with the position of the narrow gap (Fig. 7(b)). Under these conditions, the solution can be delivered to a narrow gap for a long duration. Notably, the position of the liquid-liquid interface can fluctuate owing to a slight change in the pressure supply. Although the reagent solution sometimes overflowed into the channel for bacteria, the position adjustment of the liquid-liquid interface was continued by balancing \(\mathrm{P}_1\) and \(\mathrm{P}_2\) through a trial-and-error method until we could set its position at the narrow gap. Furthermore, a slight difference in the pressures is sometimes caused by pressure sources that cannot be completely removed.
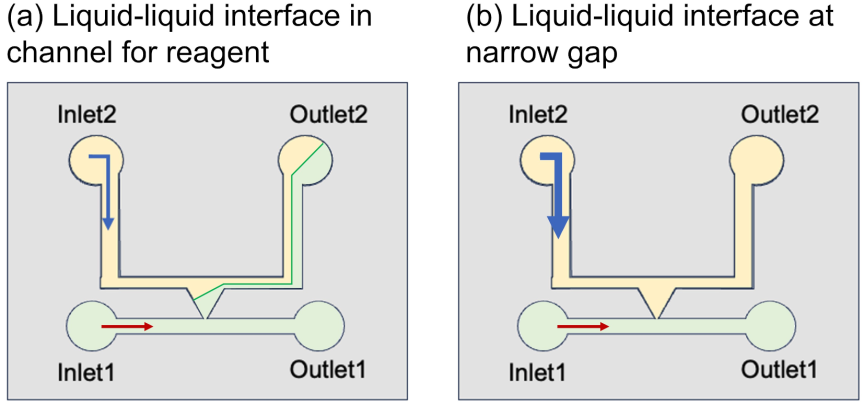
Fig. 7. Procedure of local chemical delivery to the narrow gap. Culture medium and solution were introduced into the channels for the bacteria and reagent, respectively. (a) Liquid-liquid interface in the channel for reagent. (b) Precise position adjustment of liquid-liquid interface at the position of the narrow gap by balancing \(\mathrm{P}_1\) and \(\mathrm{P}_2\).
4.3. Local Chemical Delivery to a Single Bacterium
This procedure involves a serial combination of trapping a single bacterium and local chemical delivery.
5. Results
5.1. Trap of Single Bacterium
Figure 8 shows the results of trapping a single bacterium within a narrow gap. The channel for the reagent was filled with the culture medium, and a suspension of E. coli was introduced into the channel for the bacteria from inlet 1 (Fig. 8(a)). \(\mathrm{P}_1\) and \(\mathrm{P}_2\) were 35 and 30 kPa, respectively. The culture medium flowed through the narrow gap from the channel for bacteria to that for reagent, by gradually decreasing \(\mathrm{P}_2\) to \(-15\) kPa. E. coli in the channel for bacteria was dragged into a narrow gap (Fig. 8(b)). At \(-15\) kPa of \(\mathrm{P}_2\), a single E. coli bacterium was trapped at the narrow gap (Fig. 8(c)). Once the E. coli was trapped, it remained trapped even after the drag force was removed. This may be because E. coli adhered to the PDMS sidewall 12,13.
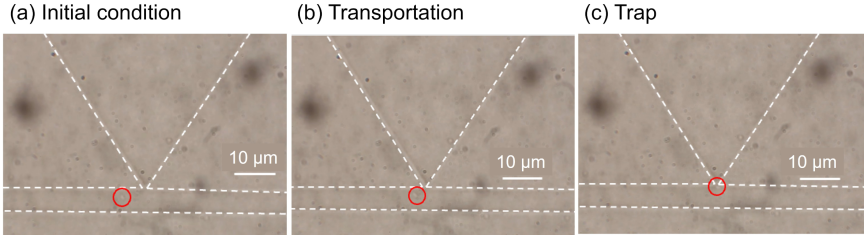
Fig. 8. Trap of a single E. coli at the narrow gap. (a) Initial condition. (b) Transportation. (c) Trap. Red circles indicate the position of the single E. coli.
5.2. Local Chemical Delivery at the Narrow Gap
The position of the liquid-liquid interface was set at the narrow gap by adjusting \(\mathrm{P}_1\) and \(\mathrm{P}_2\). The channels for the bacteria and reagents were filled with LB culture medium and fluorescein solution, respectively. \(\mathrm{P}_1\) and \(\mathrm{P}_2\) were 50 and 15 kPa, respectively. A liquid-liquid interface was generated in the channel for the reagent. The liquid-liquid interface moved to a narrow gap, whereas P\(_2\) gradually increased to 46.6 kPa. At 46.6 kPa in \(\mathrm{P}_2\), the liquid-liquid interface was positioned at a narrow gap (Fig. 9(a)). The liquid-liquid interface remained constant, whereas \(\mathrm{P}_1\) and \(\mathrm{P}_2\) remained constant for 30 min (Figs. 9(b)–(d)). From this result, it was demonstrated that the position of the liquid-liquid interface was maintained at a narrow gap once the pressure condition was determined and kept constant.
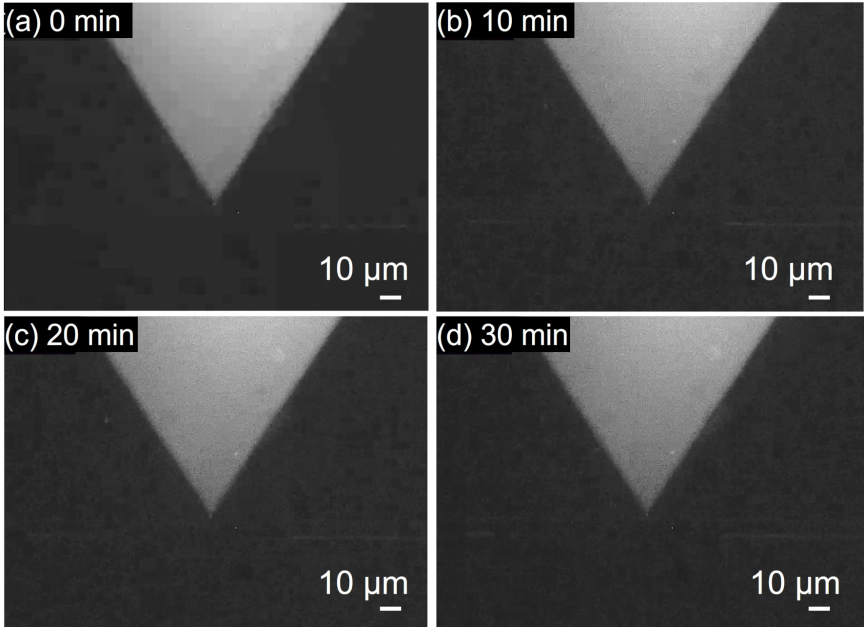
Fig. 9. Maintenance of the position of the liquid-liquid interface at the narrow gap under fluorescence observation. (a) Alignment of the liquid-liquid interface at the narrow gap. (b) 10 min. (c) 20 min. (d) 30 min.
5.3. Local Chemical Delivery to a Single Bacterium
The fluorescein solution was delivered to a single B. subtilis under an observation method that combined bright-field and fluorescent views to identify the PDMS microfluidic structures. By adjusting \(\mathrm{P}_1\) and \(\mathrm{P}_2\), a single B. subtilis was trapped and then the liquid-liquid interface was positioned at the trapped B. subtilis in a narrow gap. \(\mathrm{P}_1\) was gradually increased to 11.0 kPa, and then \(\mathrm{P}_2\) was gradually increased to 9.6 kPa. At 9.6 kPa in \(\mathrm{P}_2\), the liquid-liquid interface was adjusted to a narrow gap with a single B. subtilis (Fig. 10(a)). The pressure difference, \(\mathrm{P}_1\)–\(\mathrm{P}_2\), was positive under this condition; therefore, the bacterium could be dragged and trapped in the narrow gap. The position of the liquid-liquid interface was maintained in a narrow gap (Figs. 10(b)–(d)). Thus, the single B. subtilis was exposed to the solution through a narrow gap.
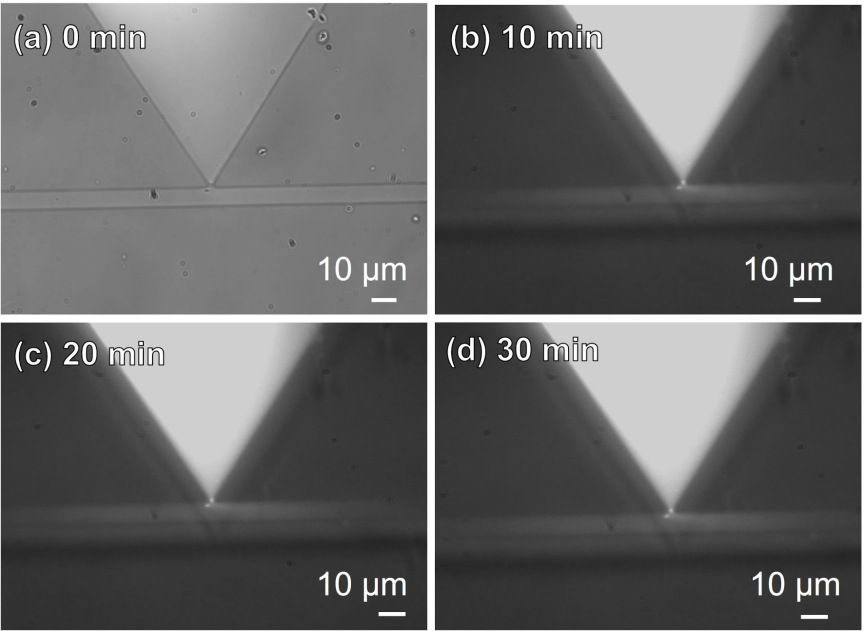
Fig. 10. Local chemical delivery to a single Bacillus subtilis at the narrow gap. (a) Bright-field image of a single B. subtilis trapped at the narrow gap. (b) Merged image of bright-field and fluorescent images of the narrow gap. 10 min after the liquid-liquid interface aligned at the narrow gap with the single B. subtilis. (c) 20 min. (d) 30 min.
6. Conclusions
In this study, we developed a microfluidic device with a narrow gap for local chemical delivery to a single bacterium. A chemical solution was delivered to a single bacterium trapped in a narrow gap. The bacteria were exposed to the chemical solution for 30 min. In future studies, we plan to use biological chemicals instead of fluorescein to study the response of a single bacterium and its survival strategy in a population of bacteria with the same genome using antibody-labeled fluorescent dyes. From an engineering standpoint, the proposed local chemical delivery system enables the localized delivery of biosensing reagents, such as antibody-labeled fluorescent probes, to the surface of individual bacteria.
Acknowledgments
This work was supported by JSPS KAKENHI Grant Number JP21K18190.
- [1] S. V. Avery, “Microbial cell individuality and the underlying sources of heterogeneity,” Nat. Rev. Microbiol., Vol.4, No.8, pp. 577-587, 2006. https://doi.org/10.1038/nrmicro1460
- [2] T. D. Evans and F. Zhang, “Bacterial metabolic heterogeneity: Origins and applications in engineering and infectious disease,” Curr. Opin. Biotechnol., Vol.64, pp. 183-189, 2020. https://doi.org/10.1016/j.copbio.2020.04.007
- [3] K. Kundu, N. Weber, C. Griebler, and M. Elsner, “Phenotypic heterogeneity as key factor for growth and survival under oligotrophic conditions,” Environ. Microbiol., Vol.22, No.8, pp. 3339-3356, 2020. https://doi.org/10.1111/1462-2920.15106
- [4] M. A. Sánchez-Romero and J. Casadesús, “Contribution of phenotypic heterogeneity to adaptive antibiotic resistance,” Proc. Natl. Acad. Sci. U.S.A., Vol.111, No.1, pp. 355-360, 2014. https://doi.org/10.1073/pnas.1316084111
- [5] L. P. Morawska, J. A. Hernandez-Valdes, and O. P. Kuipers, “Diversity of bet-hedging strategies in microbial communities—Recent cases and insights,” WIREs Mech. Dis., Vol.14, No.2, Article No.e1544, 2022. https://doi.org/10.1002/wsbm.1544
- [6] H. Niu, J. Gu, and Y. Zhang, “Bacterial persisters: Molecular mechanisms and therapeutic development,” Signal Transduct. Target. Ther., Vol.9, Article No.174, 2024. https://doi.org/10.1038/s41392-024-01866-5
- [7] P. J. Hare, T. J. LaGree, B. A. Byrd, A. M. DeMarco, and W. W. K. Mok, “Single-cell technologies to study phenotypic heterogeneity and bacterial persisters,” Microorganisms, Vol.9, No.11, Article No.2277, 2021. https://doi.org/10.3390/microorganisms9112277
- [8] G. C. R. Ellis-Davies, “Caged compounds: Photorelease technology for control of cellular chemistry and physiology,” Nat. Methods, Vol.4, No.8, pp. 619-628, 2007. https://doi.org/10.1038/nmeth1072
- [9] B. L. Bassler, “How bacteria talk to each other: Regulation of gene expression by quorum sensing,” Curr. Opin. Microbiol., Vol.2, No.6, pp. 582-587, 1999. https://doi.org/10.1016/S1369-5274(99)00025-9
- [10] R. Tollerson II and M. Ibba, “Translational regulation of environmental adaptation in bacteria,” J. Biol. Chem., Vol.295, No.30, pp. 10434-10445, 2020. https://doi.org/10.1074/jbc.REV120.012742
- [11] P. Kim et al., “Soft lithography for microfluidics: A review,” Biochip J., Vol.2, No.1, pp. 1-11, 2008.
- [12] S. L. Arias, J. Devorkin, A. Civantos, and J. P. Allain, “Escherichia coli adhesion and biofilm formation on polydimethylsiloxane are independent of substrate stiffness,” Langmuir, Vol.37, No.1, pp. 16-25, 2021. https://doi.org/10.1021/acs.langmuir.0c00130
- [13] V. Drebezghova et al., “Initial bacterial retention on polydimethylsiloxane of various stiffnesses: The relevance of modulus (mis)match,” Colloids Surf. B Biointerfaces, Vol.217, Article No.112709, 2022. https://doi.org/10.1016/j.colsurfb.2022.112709
This article is published under a Creative Commons Attribution-NoDerivatives 4.0 Internationa License.