
Paper:
Development of a Microchannel with Tapered Funnels for Evaluating Liposome Membrane Tension
Kaoru Uesugi*1,*2,†
 , Haruto Obuchi*3, Kazuaki Nagayama*2, and Taro Toyota*3,*4
*1Department of Robotics, Graduate School of Science and Engineering, Ritsumeikan University
1-1-1 Nojihigashi, Kusatsu, Shiga 525-8577, Japan
*2Department of Mechanical Systems Engineering, Graduate School of Science and Engineering, Ibaraki University
Nakanarusawa-cho, Hitachi, Ibaraki 316-8511, Japan
*3Department of Basic Science, Graduate School of Arts and Sciences, The University of Tokyo
3-8-1 Komaba, Meguro-ku, Tokyo 153-8902, Japan
*4Universal Biology Institute, The University of Tokyo
7-3-1 Hongo, Bunkyo-ku, Tokyo 113-0033, Japan
†Corresponding author

Amoeba-type molecular robots, which are deformed by internal actuator molecules, use micrometer-sized liposomes as their flexibly deformable housings. To design amoeba-type molecular robots, it is crucial to evaluate the liposome membrane tension because the deformation of these robots is influenced by the membrane tension of the housing liposomes. In this study, we proposed a microchannel that enabled the evaluation of liposome membrane tension by observing the radii of liposomes trapped in tapered funnels integrated into the microchannel. Because the funnels were connected in series, the liposome membrane tension could be evaluated in a single experiment without requiring advanced experimental techniques or considerable experimental time. In addition, the evaluated liposomes were trapped in the funnels while adhering to the funnel walls, which may prevent damage due to stress concentrations and reduce the influence of dispersion leakage and fabrication inaccuracy of the microchannel. The membrane tension was derived by substituting the radii of the trapped liposomes and the pressure difference between the inlet and outlet of the funnel into the Young–Laplace equation. We evaluated the membrane tension under two conditions: (1) single-liposome trapping condition (0.57 and 0.34 mN/m) and (2) multiple-liposome trapping condition (0.41 mN/m). The difference in membrane tension between these conditions was not significant. However, we observed variability in the contact angle between the liposome and funnel wall, as well as in the membrane curvature, under the multiple-trapping condition. Therefore, we deduced that the single-liposome trapping condition was more suitable for membrane tension evaluation using the proposed microchannel.
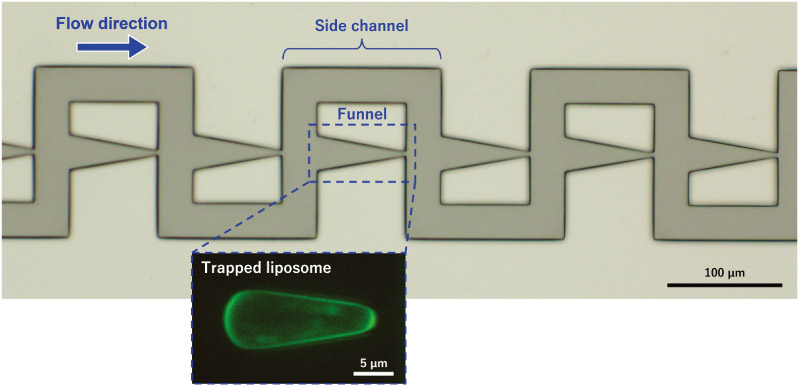
Microchannel with tapered funnels for evaluating liposome membrane tension
1. Introduction
Molecular robots operate using functionalized molecular devices and their ultimate goal is to reproduce biological-like systems that possess sensors, processors, and actuators 1. In particular, amoeba-type molecular robots, which use micrometer-sized lipid bilayer vesicles (liposomes) as flexibly deformable housings, have attracted considerable attention from the scientific community 1. These molecular robots deform their housings by pushing the liposome membrane from the inside using molecular device functions such as microtubule polymerization 2, alignment (nematic liquid crystal formation) of the actin filaments 3, and gliding motion of the kinesin–microtubule systems 4.
When designing amoeba-type molecular robots that use micrometer-sized liposomes as their housings, it is necessary to evaluate the mechanical properties of the liposome membrane 5. Specifically, the membrane composition and amount and type of the encapsulated actuator molecules (i.e., the output power of the actuators) need to be adjusted because liposome deformation is strongly influenced by the mechanical properties of the membrane.
Previous studies have reported methods in which liposomes were aspirated and trapped using an aspiration orifice and their membrane tension and mechanical properties were evaluated based on their deformation. There are two primary methods: the first one uses glass micropipettes 6,7,8,9,10,11,12, whereas the other uses microchannels 13,14. The former, known as the micropipette aspiration method, enables the detailed evaluation of individual liposomes; however, it requires significant experimental time and technical skill. In contrast, the latter, which includes funnel structures that mimic micropipettes, allows the simultaneous evaluation of multiple liposomes without the need for advanced techniques. However, these methods differ from ideal mechanical models, which make detailed pressure analysis difficult (due to the noncircular orifice shape) and complicate direct pressure measurements. Each method has been employed extensively to date, considering its advantages and limitations.
However, both methods share a common disadvantage. In both methods, the edge of the aspiration orifice may vary or become rounded due to the fabrication accuracy, which reduces the accuracy of the applied mechanical models. In addition, the liposomes may become damaged by the stress concentration at the edge of the aspiration orifice.
Therefore, in this study, we developed a microchannel that included multiple tapered funnels. Each funnel had a gradually narrowing geometry from the inlet to the outlet. We evaluated the membrane tension by observing the deformation of liposomes trapped in the tapered funnels. Because the tapered funnels did not have edge structures, we anticipated that the influence of the fabrication accuracy on the membrane tension evaluation would be small. Furthermore, the stress concentrations at the edges were minimized because the liposomes were trapped along the smooth walls of the tapered funnels. In addition, multiple liposomes could be evaluated in a single experiment without requiring special techniques because multiple funnels were integrated into a single microchannel.
2. Microchannel
2.1. Concept of the Microchannel
The microchannel had multiple trapping points (funnels) (Fig. 1). Because the funnels were connected in series (more precisely, each funnel was connected in parallel with a side channel and these parallel units were connected in series), multiple liposomes trapped individually at each point could be evaluated in a single experiment by means of a simple operation. In our microchannel, a liposome was trapped in a funnel in mechanical equilibrium under quasi-static conditions, where the forces acting on the liposome were assumed to include the applied pressure, the normal reaction force from the tapered wall, the friction force between the membrane and microchannel wall, and the Laplace pressure generated by membrane tension.
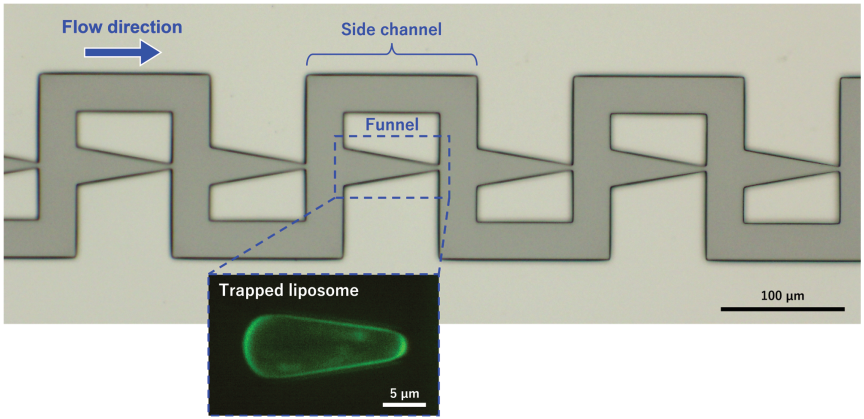
Fig. 1. Microscopic image of the microchannel developed in this study and confocal fluorescence image of a liposome trapped in a tapered funnel. Each funnel was connected in parallel with a side channel, and these parallel units were connected in series. Liposomes were introduced from upstream (left side of the microscopic image) to downstream (right side of the microscopic image), and some liposomes were trapped in the funnels. \(P_{\textit{in}}\), \(P_{\textit{out}}\), \(P_L\), and \(\Delta P\) denote the inlet pressure, outlet pressure, internal pressure of the liposome, and pressure difference across each funnel, respectively.
Each funnel had a tapered geometry in which the inlet width was larger than the outlet width, and the width decreased linearly towards the outlet. The membrane tension of a trapped liposome was derived from the curvature radii at the inlet and outlet of the liposome as well as the pressure difference between the inlet and outlet of each funnel. In this study, we assumed that the pressure difference across each funnel was identical because the trapped liposome substantially blocked the funnel and minimized flow leakage.
Each funnel in the microchannel was connected to a side channel that generated a pressure difference between the inlet and outlet. The pressure difference could be estimated using the Darcy–Weisbach equation: because the side channels consisted of straight segments, the flow velocity could be determined by tracking the particles (liposomes) flowing in the side channel under low-flow conditions, without requiring special equipment or complex microchannel designs. However, we did not use this method in this study because of the high flow velocity.
Previously, Guo et al. 15,16,17 developed a microchannel with serially connected tapered funnels to evaluate the membrane tension of cells under critical conditions (just before the Haines jump 18). Although this design was less affected by contact angle hysteresis and friction between the membrane and microchannel wall, it could evaluate only one cell because the conditions differed among the serially connected funnels. In addition, the membrane tension evaluation may be affected by the fabrication accuracy because the cell was trapped at the outlet edge of the funnel.
The evaluation of membrane tension using stepped funnels has been reported for both liposomes and cells 13,14,19,20. In these designs, the stepped funnels were connected either in series or in parallel, allowing multiple liposomes or cells to be evaluated simultaneously. The evaluation of liposomes and cells using these microchannels was less affected by contact angle hysteresis and friction. However, because the liposomes were trapped at the edges of the stepped funnels, they might experience stress concentrations that could lead to membrane damage. In addition, liposome deformation might be influenced by the fabrication accuracy at the funnel edges, and leakage was more likely to occur at these trapping points.
In contrast, in our microchannel, the liposomes were trapped along the smooth walls of tapered funnels rather than at the edges, which reduced the stress concentrations. Because the liposomes were not in contact with the edge structures, the membrane tension evaluation was less affected by the fabrication accuracy at the edges, and leakage was less likely to occur at the trapping points.
2.2. Principle of the Membrane Tension Derivation
In our microchannel, a liposome that entered a funnel was trapped under quasi-static conditions in mechanical equilibrium, where the forces acting on the liposome were assumed to include the applied pressure, the normal reaction force from the tapered wall, the friction force between the membrane and microchannel wall, and the Laplace pressure generated by membrane tension.
The fundamental concept of deriving the membrane tension for liposomes was based on the work of Guo et al. 15,16,17. As shown in Fig. 2, when a liposome is trapped in a funnel, the relationship between the pressure difference and curvature of the liposome membrane is described by Eqs. (1) and (2) using the Young–Laplace equation and the pressure difference across each funnel (Eq. (3)):
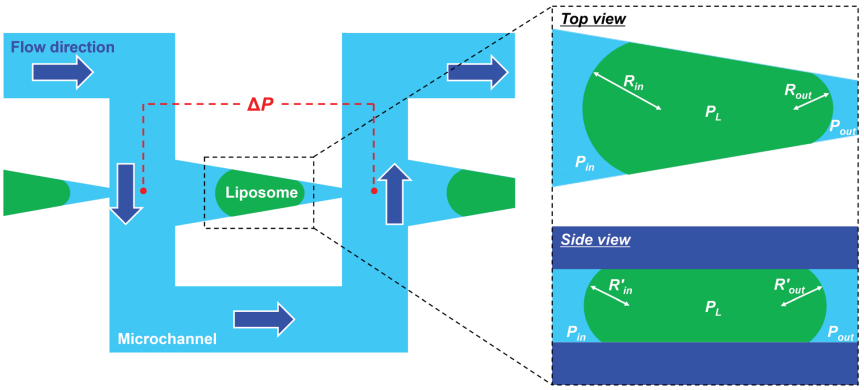
Fig. 2. Schematic illustration of the principle of liposome membrane tension derivation. The pressure difference, \(\Delta P\), between the inlet and outlet of the funnel was derived using the Darcy–Weisbach equation. The membrane tension of the liposome was then obtained by substituting \(\Delta P\) and the curvature radii of the trapped liposome, \(R_{\textit{in}}\) and \(R_{\textit{out}}\), into the Young–Laplace equation.
2.3. Principle of the Pressure Difference Derivation
Tan and Takeuchi 21 proposed a basic principle for deriving the pressure difference. The microchannel branched into two pathways: the aspiration and branch channels. Each aspiration channel contained a funnel to trap the liposomes. When a liposome dispersion was introduced into the microchannel, the flow split into the aspiration and branch channels, and some liposomes were trapped in the funnel regions. Without branch channels, the liposomes trapped in the initial aspiration channel would obstruct the flow, preventing subsequent liposomes from being trapped in the downstream aspiration channels. Therefore, branch channels are essential for evaluating multiple liposomes within a single microchannel.
The pressure difference, \(\Delta P\), at the trapping region was derived using Eq. (5), which is the Darcy–Weisbach equation 21:
3. Materials and Methods
3.1. Design and Fabrication of the Microfluidic Channels
Figure 3 shows the nominal dimensions of the designed microchannels. Each microchannel contained 30 tapered funnels to trap the liposomes. The minimum width of each funnel was 3 μm and the length was 80 μm. The width and length of the side channels were 30 and 230 μm, respectively. The channel height (mold thickness) was set to 10 μm. The measured values of the fabricated mold were 3.30 μm (minimum width of a representative funnel) and 10.12 μm (thickness).
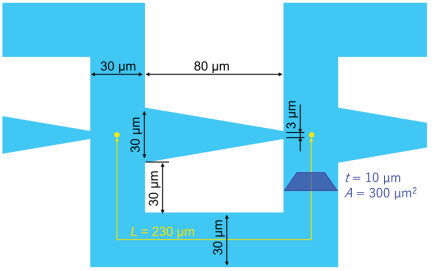
Fig. 3. Schematic illustration of the geometric parameters of the microchannel, including the tapered funnels (design values). The minimum width of each funnel was 3 μm. The width and length of the side channels were 30 and 230 μm, respectively. The channel height was 10 μm.
We assumed that the diameter of the target liposomes was \(\sim\)10 μm, and therefore, the height of the microchannel was designed to be 10 μm. Indeed, the size distribution of liposomes prepared using the same method (details are given in Section 3.2) has been reported to peak at \(\sim\)10 μm 23, suggesting that the majority of the liposomes have a diameter of \(\sim\)10 μm. To ensure reliable trapping of the liposomes, the minimum width of the funnel was designed to be as narrow as possible. Considering the fabrication accuracy and reproducibility of the photolithography process, we set the minimum funnel width to 3 μm to ensure reliable fabrication. The dimensions of the funnel and side channel were determined such that one trapping unit (consisting of one funnel and its corresponding side channel) could be accommodated within the microscopic field of view when observed at an effective magnification of 30\(\times\) using a 20\(\times\) objective lens with a built-in 1.5\(\times\) magnification changer of the microscope. This design enabled simultaneous observation of the entire trapping unit during the experiments. Furthermore, the funnel length was set to 80 μm, which was sufficiently long to reduce the influence of the shear flow generated by flows perpendicular to the funnel direction. We expected that this geometry would improve the trapping stability by minimizing disturbances around the trapped liposome. Further discussion of the influence of the funnel geometry on the trapping behavior is provided in Section 5 (Discussion).
A photoresist (SU-8 3005, MicroChem Corp., Newton, MA, USA) mold for the microchannel was fabricated on a Si wafer using photolithography, where the fabrication was outsourced to Tonic Co., Ltd., Kanagawa, Japan. Poly(dimethylsiloxane) (PDMS) (SILPOT™ 184 Silicone Elastomer, Dow Corning Corp., Midland, MI, USA) was prepared with a mixing ratio of \(10:1\) (base to curing agent) and cast from the mold. The PDMS was poured onto the photoresist mold and baked at 120°C for 1 h. After demolding, the bonding surface of the replicated PDMS structure was plasma-treated using a soft plasma etching device (SEDE-GE, Meiwafosis Co., Ltd., Tokyo, Japan) at 3 mA for 20 s prior to bonding. The PDMS structure was then bonded to a glass substrate (micro cover glass, 50 mm \(\times\) 70 mm, Matsunami Glass Ind., Ltd., Osaka, Japan), which had been plasma-treated under the same conditions and baked at 120°C for 30 min.
3.2. Preparation of the Membrane-Fluorescent Liposomes
A membrane-fluorescent liposome dispersion was prepared using the sugar-containing thin-film hydration method 23. Stock solutions of 1-palmitoyl-2-oleoyl-sn-glycero-3-phosphocholine (POPC), 1-palmitoyl-2-oleoyl-sn-glycero-3-(phospho-rac-1-glycerol) (sodium salt, POPG) and ATTO488-labelled 1,2-dioleoyl-sn-glycero-3-phosphoethanolamine (ATTO488-DOPE) in chloroform were prepared separately before adding them (\(\textrm{POPC}:\textrm{POPG}:\textrm{ATTO488-DOPE}:\textrm{fructose}\) molecular ratio \(=9:1:0.009:9\)) to a vial containing methanol solution. Chloroform and methanol were then evaporated under reduced pressure using a rotary evaporator (N1110V, EYELA, Tokyo Rikakikai Co., Ltd., Tokyo, Japan) to form a lipid film at the bottom of the vial. The lipid film was subsequently dried under reduced pressure at 40°C for more than 1 h using a sample dryer (VSD-110, Ishii Laboratory Works Co., Ltd., Osaka, Japan). The dispersions of fluorescent liposomes were obtained by pouring 2 mL of highly purified deionized water (PR-\(\alpha\)01, Organo Corp., Tokyo, Japan) onto the dried lipid film. Each liposome dispersion was incubated at 40°C for 1 h in an incubator (2290, Wakenyaku, Co., Ltd., Kyoto, Japan), followed by mechanical agitation at 500 rpm for 30 min using a vortex mixer (JEIO TECHVM-96B, AS ONE Corp., Osaka, Japan).
3.3. Introduction of Liposome Dispersion into the Microchannel
A syringe (Gastight Syringe, 1002TLL, 2.5 mL, Hamilton Company, Reno, NV, USA) mounted on a syringe pump (LEGATO 100, KD Scientific Inc., Holliston, MA, USA), a flow sensor (Flow Sensor MFS, Elveflow, Paris, France), and the microchannel were connected in series using a polytetrafluoroethylene (PTFE) tube coated with bovine serum albumin (BSA; A9647-50G, Sigma-Aldrich, St. Louis, MO, USA). The microchannel was mounted on an inverted microscope (ECLIPSE Ti2, Nikon Corp., Tokyo, Japan). The BSA-coated PTFE tube was prepared by filling it with 1 wt% of BSA solution for 1 h. After BSA coating, a liposome dispersion was introduced into the microchannel at a flow rate of 5 μL/h using the syringe pump. If the flow rate was too high, the liposomes were not trapped in the funnels; rather, they passed through them. Conversely, when the flow rate was too low, the flow around the funnels became unstable, resulting in fluctuations in the flow rate and occasional backflow.
3.4. Observations of the Trapped Liposome Membranes
Confocal fluorescence images were acquired using an inverted microscope (ECLIPSE Ti2, Nikon Corp., Tokyo, Japan) equipped with a 60\(\times\) objective lens (Plan Apo\(\lambda\) 60\(\times\), NA \(=0.95\), Nikon), an optical filtering unit (W-VIEW GEMINI, Hamamatsu Photonics K.K., Hamamatsu, Japan) equipped with an emission filter (peak wavelength: 520 nm, FF01-520/35-25, Semrock Inc., Rochester, NY, USA), and a confocal microscopy system (CSU-X1, Yokogawa Electric Corp., Tokyo, Japan). The system was coupled with a 488-nm laser (Sapphire SF 488-50 CDRH, Coherent Inc., Santa Clara, CA, USA) with a driver unit (Sapphire LP USB CDRH driver unit with display, Coherent Inc., Santa Clara, CA, USA) and a complementary metal-oxide semiconductor (CMOS) camera (ORCA-Fusion C14440, Hamamatsu Photonics K.K., Hamamatsu, Japan). Z-stack images were acquired at a step size of 0.2 μm. Using these confocal fluorescence images, we obtained morphological information of the liposome membranes.
To observe the flow trajectories of the dispersion, fluorescence videos (GFP, 10 fps) were acquired using the same inverted microscope with a different configuration: a 10\(\times\) objective lens (Plan Fluor 10\(\times\), NA \(=0.30\), Nikon), a light source (Intensilight C-HGFI, Nikon), and a CMOS camera (DS-Fi3, Nikon). In this study, we analyzed three trapped liposomes.
3.5. Image Analysis
We used an image analysis software (ImageJ 1.54r, Fiji) to analyze the morphological properties of the liposome membranes. The contact angle was determined from the top-view images obtained from confocal fluorescence microscopy (Fig. 4). The curvature radius of the liposome membrane was determined by circle fitting of points selected using the “multipoint” function in ImageJ. The circle parameters were first estimated using the Taubin method (algebraic fitting) and then refined using the Gauss–Newton method based on the geometric error (i.e., distance-to-radius error). These procedures were performed using a custom-made program (Python 3.14.3). Both the top-view and side-view images of the liposomes obtained from confocal fluorescence microscopy were analyzed by circle fitting, as described above. We defined the liposome area as the region enclosed by the membrane outline of a liposome in the top-view image (i.e., the region shaded in green in Fig. 4). The membrane outline was traced using the “polygon selection” function in ImageJ, and the area was then calculated.
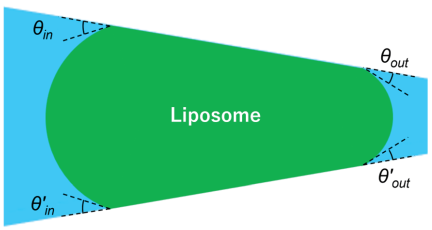
Fig. 4. Schematic illustration of the contact angles between the liposome and the surface of the tapered funnel wall. \(\theta_{\textit{in}}\) (\(\theta'_{\textit{in}})\) represents the receding contact angle whereas \(\theta_{\textit{out}}\) (\(\theta'_{\textit{out}}\)) represents the advancing contact angle.
4. Results
Figure 5 and Videos 1 and 2 a,b show the fluorescence images of liposomes flowing in or trapped within the microchannel. Because the frame rate was lower than the flow velocity of the dispersion, the trajectories of the liposomes appeared as afterimages. By observing these trajectories, we could evaluate the flow behavior.
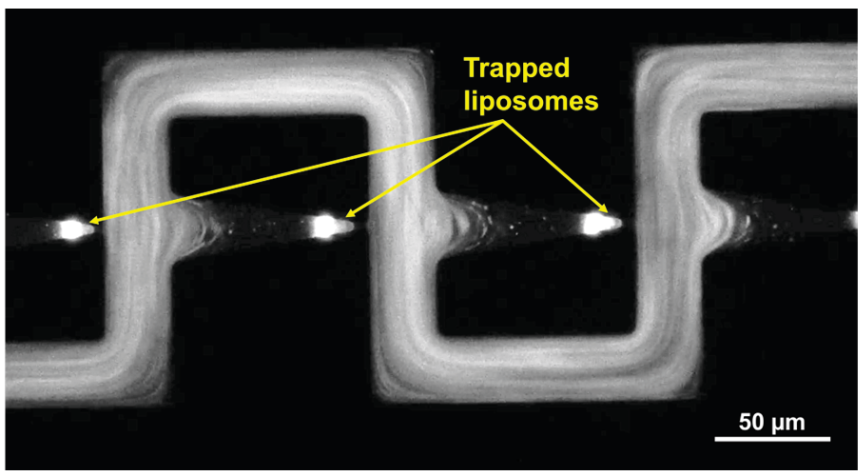
Fig. 5. Fluorescence image of the liposomes trapped in the funnels of the microchannel and liposomes flowing in the side channels. The configurations of liposomes trapped in the funnels were observed in the fluorescence image. The flow behavior was evaluated by observing the trajectories of the fluorescence liposomes.
Figure 6 shows the fluorescence images of liposomes trapped in the funnels. In this study, the membrane tension was evaluated after the trapped liposomes had reached a stable equilibrium in both shape and position. Three trapped liposomes were analyzed and two types of trapping conditions were observed. The first type was a single liposome trapped in a funnel (liposomes 1 and 2), and the second type was multiple liposomes trapped simultaneously in a funnel (liposome 3). When the radii of additional liposomes trapped alongside the target liposome were small (liposomes 1 and 2: 1.1 and 1.4 μm, respectively), the condition was defined as a single-liposome trapping condition. In contrast, when the radii were large (liposome 3: 2.8 μm), the condition was defined as a multiple-liposome trapping condition (Fig. 7). In the second type, the main liposome was first trapped in a narrow region of the funnel, followed by a relatively large secondary liposome that was smaller than the main liposome.
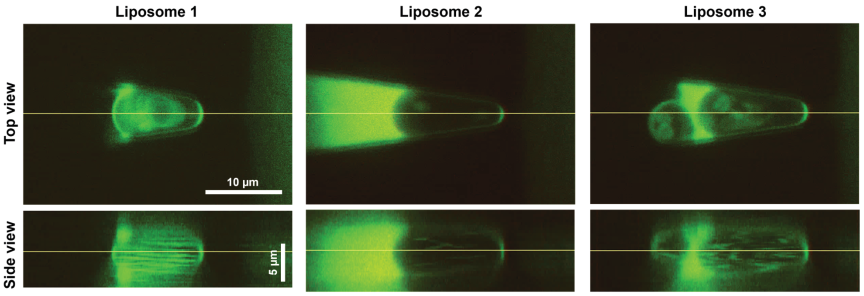
Fig. 6. Confocal fluorescence images of the liposomes trapped in the tapered funnels. The straight lines in the top-view images indicate the cross sections used to obtain the corresponding side-view images, and those in the side-view images indicate the cross sections used to obtain the corresponding top-view images. Liposomes 1 and 2 were trapped under the single-trapping condition, whereas liposome 3 was trapped under the multiple-trapping condition. For liposome 3, an additional large liposome attached to the evaluated liposome was visible at the inlet side of the funnel.
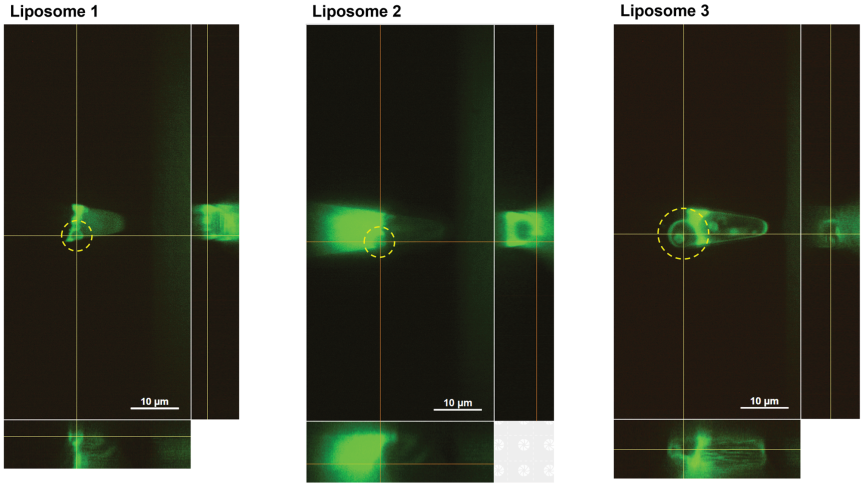
Fig. 7. Confocal fluorescence images of an additional liposome (highlighted by yellow dashed circles) trapped in the funnels together with the target liposome. The sizes of the additional liposome were 1.1 μm (liposome 1), 1.4 μm (liposome 2), and 2.8 μm (liposome 3).
Table 1 summarizes the contact angles between the liposome and microchannel wall, the radii of the liposome membrane, and the area enclosed by the membrane. The contact angles at the inlet side (receding contact angles, \(\theta_{\textit{in}}\) and \(\theta'_{\textit{in}})\) and those at the outlet side (advancing contact angles, \(\theta_{\textit{out}}\) and \(\theta'_{\textit{out}})\) were measured by image analysis. Under the single-liposome trapping condition, \(\theta_{\textit{in}}\) (liposome 1: 24.3°; liposome 2: 25.4° ) and \(\theta \prime _{in}\) (liposome 1: 23.8°; liposome 2: 25.9°) were larger than \(\theta_{\textit{out}}\) (liposome 1: 14.7°; liposome 2: 14.0°) and \(\theta'_{\textit{out}}\) (liposome 1: 14.0°; liposome 2: 14.3°). In contrast, under the multiple-liposome trapping condition (liposome 3), the contact angles varied widely (\(\theta_{\textit{in}}\)=23.3°, \(\theta'_{\textit{in}}=20.2°\), \(\theta_{\textit{out}}=36.8°\), \(\theta'_{\textit{out}}=12.7°\)), and the relationship observed under the single-liposome trapping condition was not observed here.
| Liposome | Trapping condition | Receding contact angle [deg] | Advancing contact angle [deg] | Top view radius of liposome membrane [μm] | Side view radius of liposome membrane [μm] | Area of liposome [μm\(^2\)] | ||||
| \(\theta_{\textit{in}}\) | \(\theta'_{\textit{in}}\) | \(\theta_{\textit{out}}\) | \(\theta'_{\textit{out}}\) | \(R_{\textit{in}}\) | \(R_{\textit{out}}\) | \(R'_{\textit{in}}\) | \(R'_{\textit{out}}\) | \(A\) | ||
| 1 | Single | 24.3 | 23.8 | 14.7 | 14.0 | 3.6 | 2.0 | 2.2 | 2.5 | 57.3 |
| 2 | Single | 25.4 | 25.9 | 14.0 | 14.3 | 3.3 | 1.4 | 3.3 | 3.2 | 64.3 |
| 3 | Multiple | 23.3 | 20.2 | 36.8 | 12.7 | 3.2 | 1.6 | 2.7 | 5.5 | 69.3 |
The top-view radius at the inlet side, \(R_{\textit{in}}\) (liposome 1: 3.6 μm; liposome 2: 3.3 μm), was larger than that at the outlet side, \(R_{\textit{out}}\) (liposome 1: 2.0 μm; liposome 2: 1.4 μm). The side-view radii at the inlet and outlet, \(R'_{\textit{in}}\) and \(R'_{\textit{out}}\), were similar under the single-liposome trapping condition (liposome 1: \(R'_{\textit{in}}=2.2\) μm, \(R'_{\textit{out}}=2.5\) μm; liposome 2: \(R'_{\textit{in}}=3.3\) μm, \(R'_{\textit{out}}=3.2\) μm). However, under the multiple-liposome trapping condition (liposome 3), these radii differed (\(R'_{\textit{in}}=2.7\) μm, \(R'_{\textit{out}}=5.5\) μm).
The areas of the liposomes were 57.3 μm\(^2\) (liposome 1), 64.3 μm\(^2\) (liposome 2), and 69.3 μm\(^2\) (liposome 3). Assuming a circular shape, we obtained equivalent radii \((r=\sqrt {A\textrm{/}\pi})\) of 4.3 μm (liposome 1), 4.5 μm (liposome 2), and 4.7 μm (liposome 3).
Table 2 summarizes the measured volumetric flow rate of the dispersion, \(Q\), the pressure difference, \(\Delta P\), at the trapping region derived using the Darcy–Weisbach equation (Eq. (5)), the membrane tension \(\tau\) derived using Eq. (4), and the other related parameters. The membrane tensions of the liposomes were 0.57 mN/m (liposome 1) and 0.34 mN/m (liposome 2) under the single-liposome trapping condition, whereas the membrane tension of the liposomes under the multiple-liposome trapping condition was 0.41 mN/m (liposome 3).
| Liposome | Trapping condition | Related value of side channel | Measured volumetric flow rate [μL/h] | Measured volumetric flow rate \(Q\) [μL/s] | Pressure difference \(\Delta P\) [Pa] | Membrane tension \(\tau\) [mN/m] | ||||||
| Length \(L\) [μm] | Width [μm] | Height [μm] | Aspect ratio | Laminar friction constant \(C(\alpha)\) | Perimeter \(P\) [μm] | Cross-sectional area \(A\) [μm\(^2\)] | ||||||
| 1 | Single | 230 | 30 | 10 | 0.33 | 68.4 | 80 | 300 | 4.5 | 0.0013 | 129.6 | 0.57 |
| 2 | Single | 230 | 30 | 10 | 0.33 | 68.4 | 80 | 300 | 4.8 | 0.0013 | 138.7 | 0.34 |
| 3 | Multiple | 230 | 30 | 10 | 0.33 | 68.4 | 80 | 300 | 4.5 | 0.0012 | 128.8 | 0.41 |
5. Discussion
We evaluated the fluid behavior by observing the trajectories of the fluorescent liposomes (Fig. 5 and Videos 1 and 2 a,b). The liposomes appeared stable and did not rupture. In the funnels where the liposomes were trapped, flows perpendicular to the main flow direction did not enter deeply into the funnels, and the trapped liposomes were not noticeably disturbed by the incoming flow. Therefore, we deduced that the trapped liposomes were not subjected to excessive shear stress. Furthermore, by observing the liposome trajectories in funnels containing the trapped liposomes, we found that most of the liposomes flowed through the side channels without entering the funnels. This indicated that no flow sufficient to transport micrometer-scale liposomes was generated by leakage through the funnels, suggesting that leakage was negligible for the membrane tension evaluation. Therefore, we assumed that the pressure differences between the inlet and outlet of each funnel were identical and that the membrane tension evaluation using pressure differences derived from the Darcy–Weisbach equation was valid.
We observed the inclusions within the trapped liposomes and we found that the internal lipid particles (or small liposomes) were agitated (Video 1 a). The horizontal bright streaks observed inside the liposome in the side view of Fig. 6 were likely caused by the trajectories of internal lipid particles during stacking of the confocal microscopy images. These findings indicated the possibility that an internal flow (e.g., vortex flow or convection) was induced within the trapped liposomes. Previous studies have reported that when a liposome was subjected to an external flow (shear flow) in a microchannel, shear forces were transmitted through the membrane into the liposome, subsequently inducing internal flow 24,25,26,27. In our microchannel, the main flow did not penetrate deeply into the funnels, and even when it entered the funnels, we expected that the resultant flow rate (i.e., leakage at the funnels) would be small. However, because the liposomes were trapped within the funnels, the effective cross-sectional area of the flow channel was substantially reduced, which might have locally increased the flow velocity even when the flow rate was small. This locally increased flow velocity might have induced an internal flow that was sufficiently strong to agitate the encapsulated liposomes. However, because the flow rate was small, the effects of leakage were considered to be negligible.
Based on the results, we discovered that all 30 funnels in the microchannel could trap the liposomes (Video 2 b), indicating that multiple liposomes could be evaluated in a single experiment using the proposed microchannel. In contrast, the micropipette aspiration method requires advanced techniques and considerable experimental time to evaluate a single liposome. Therefore, our microchannel enabled more efficient evaluation of the mechanical properties of liposomes. However, in this study, multiple liposomes (more than three relatively large liposomes) were frequently trapped in a single funnel. As discussed below, membrane tension could not be accurately evaluated when multiple liposomes were trapped in a single funnel because the membrane was deformed by forces exerted by the adjacent liposomes, which pushed and pulled the membrane, leading to variations in the contact angles and membrane radii. Therefore, only three liposomes were analyzed in this study. Owing to the limited number of analyzable samples, we did not perform statistical analysis and therefore, we could not discuss the variability and reliability of the measurements in detail. Increasing the number of analyzed liposomes and performing a more comprehensive statistical analysis remains an important subject of future work.
To avoid multiple trapping, it may be effective to adjust the dispersion concentration, filter the dispersion (e.g., by using a syringe filter), or introduce a micropillar array-type microfilter 28 at the inlet of the microchannel. By reducing the concentration of the liposome dispersion, the number of liposomes trapped in the funnels within a given time can be reduced, thereby increasing the probability of obtaining a single-liposome trapping condition. In addition, passing the liposome dispersion through a filter can reduce the number of liposomes entering the device, which may further increase the probability of achieving single-liposome trapping. Finally, filtration can disperse the liposome aggregates and remove highly concentrated clusters, thereby improving the likelihood of establishing a single-liposome trapping condition.
We analyzed the liposomes trapped under the single-liposome trapping condition and limited multiple-liposome trapping condition (i.e., with relatively few additional liposomes). When many liposomes were trapped in a single funnel, the inlet-side membrane of the target liposome was largely covered by adjacent liposomes and was substantially deformed. Therefore, under the multiple-liposome trapping condition, the liposomes were evaluated only when a liposome with a partially exposed inlet-side membrane was present, and in such cases, the exposed liposome was analyzed.
First, we discuss the contact angles and membrane radii under the single-liposome trapping condition. The contact angles \(\theta_{\textit{in}}\) (liposome 1: 24.3°; liposome 2: 25.4°) and \(\theta'_{\textit{in}}\) (liposome 1: 23.8°; liposome 2: 25.9°) were larger than \(\theta_{\textit{out}}\) (liposome 1: 14.7°; liposome 2: 14.0°) and \(\theta'_{\textit{out}}\) (liposome 1: 14.0°; liposome 2: 14.3°) (Table 1). This was likely because, as the liposomes entered the funnel from the inlet towards the outlet while contacting the funnel wall, receding and advancing contact angles were established, corresponding to \(\theta_{\textit{in}}\) and \(\theta _{\textit{out}}\) (\(\theta'_{\textit{in}}\) and \(\theta'_{\textit{out}})\), respectively. In general, the advancing contact angles were larger than the receding angles 29.
If the liposome sizes differed, we also anticipated that the trapping positions within the tapered funnel would differ. Larger liposomes tended to be trapped earlier in the wider upstream region, whereas smaller liposomes could penetrate further into the narrower downstream region before being trapped. Hence, the distance over which the liposome remained in contact and slid along the funnel wall differed depending on the liposome size. This difference in the contact distance may influence the frictional force exerted by the funnel wall, thus affecting the contact angle between the liposome and funnel wall. However, despite differences in the liposome size (liposome 1: 57.3 μm\(^2\); liposome 2: 64.3 μm\(^2\)), the receding contact angles (liposome 1: \(\theta _{\textit{in}}=24.3°\), \(\theta'_{\textit{in}}=23.8°\); liposome 2: \(\theta_{\textit{in}}=25.4°\), \(\theta'_{\textit{in}}=25.9°\)) and advancing contact angles (liposome 1: \(\theta_{\textit{out}}=14.7°\), \(\theta'_{\textit{out}}=14.0°\); liposome 2: \(\theta_{\textit{out}}=14.0°\), \(\theta'_{\textit{out}}=14.3°\)) were similar in both cases (Table 1). This suggests that the influence of contact distance and friction on the contact angle may be limited. However, a larger sample size is required for a more detailed analysis.
In the top view, \(R_{\textit{in}}\) was larger than \(R_{\textit{out}}\) (liposome 1: \(R_{\textit{in}}=3.6\) μm, \(R_{\textit{out}}=2.0\) μm; liposome 2: \(R_{\textit{in}}=3.3\) μm, \(R_{\textit{out}}=1.4\) μm), whereas in the side view, \(R'_{\textit{in}}\) and \(R'_{\textit{out}}\) were similar (liposome 1: \(R'_{\textit{in}}=2.2\) μm, \(R'_{\textit{out}}=2.5\) μm; liposome 2: \(R'_{\textit{in}}=3.3\) μm, \(R'_{\textit{out}}=3.2\) μm) (Table 1). Therefore, the membrane tension may be estimated using only the radii observed in the top view, as described in Section 2.2.
When the additional liposome was small (liposomes 1 and 2: 1.1 and 1.4 μm, respectively; Fig. 7), the trends in the contact angles and radii were similar. This suggests that these cases can be treated as the single-liposome trapping condition.
Next, we discuss the multiple-liposome trapping condition. When multiple liposomes were trapped in a single funnel, the trends in the contact angles differed from those under the single-liposome trapping condition. In liposome 3, differences between \(\theta_{\textit{in}}\) and \(\theta'_{\textit{in}}\) (23.3° and 20.2°) and between \(\theta_{\textit{out}}\) and \(\theta'_{\textit{out}}\) (36.8° and 12.7°) were observed, which were larger than those under the single-liposome trapping condition. In particular, the difference between \(\theta_{\textit{out}}\) and \(\theta'_{\textit{out}}\) was more pronounced. Furthermore, although \(R_{\textit{in}}\) (3.2 μm) was larger than \(R_{\textit{out}}\) (1.6 μm) in the top view, as observed under the single-liposome trapping condition, \(R'_{\textit{out}}\) (5.5 μm) was approximately twice as large as \(R'_{\textit{in}}\) (2.7 μm) in the side view, which differed from that under the single-liposome trapping condition (Table 1). These differences were attributed to the deformation of the trapped liposome caused by adjacent liposomes, which exerted pushing or pulling forces.
The membrane tensions under the single-liposome trapping condition were 0.57 mN/m (liposome 1) and 0.34 mN/m (liposome 2), whereas the membrane tension under the multiple-liposome trapping condition was 0.41 mN/m (liposome 3). No clear differences were observed between these two conditions. This suggests that the membrane tension can be evaluated using the proposed microchannel regardless of the trapping conditions. However, owing to the limited sample size, there is a need to conduct further investigation to verify the above statement.
In general, membrane tensions below 0.5 mN/m correspond to the low-tension regime 12,13,30, in which the apparent membrane area increases because of smoothing of the thermal undulations of the membrane 13. Therefore, our microchannel appears to be better suited for evaluating liposomes in the low-tension regime. To evaluate higher tensions (\(\tau>1\) mN/m), a larger pressure difference is required. However, excessive pressure may cause the trapped liposomes to become dislodged and pass through the funnels, reducing measurement accuracy and limiting the evaluation to stiffer liposomes. This limitation is also present in the conventional micropipette aspiration and stepped microchannel methods.
In this study, we did not investigate the deformation behavior of the liposomes immediately after trapping. A more detailed investigation of the time-dependent deformation process may provide further insights into the viscoelastic behavior of the liposomes, which will be considered in future work.
Although the proposed microchannel may be influenced by the contact angle and friction, we observed consistent relationships among the contact angles and radii (\(\theta_{\textit{in}}>\theta_{\textit{out}}\), \(\theta'_{\textit{in}}>\theta'_{\textit{out}}\), \(R_{\textit{in}}>R_{\textit{out}}\), \(R'_{\textit{in}}\approx R'_{\textit{out}}\)), where \(\theta_{\textit{in}}\) and \(\theta'_{\textit{in}}\) of liposomes 1 and 2 and \(\theta_{\textit{out}}\) and \(R'_{\textit{out}}\) of liposomes 1 and 2 were close to each other under the single-liposome trapping condition. Therefore, the proposed microchannel can be used, at least, for comparative evaluation. The membrane tension can be reliably evaluated under the single-liposome trapping condition, whereas evaluation under multiple-liposome trapping condition remains challenging. This limitation may also apply to other conventional microchannel systems such as those using stepped funnels.
6. Conclusion
It is crucial to evaluate liposome membrane tension in order to develop amoeba-type molecular robots that use micrometer-sized liposomes as their housings because the deformation induced by internal actuator molecules is influenced by the mechanical properties of the housing liposomes.
In this study, we proposed a microchannel capable of evaluating liposome membrane tension, where we incorporated serially connected tapered funnels in the microchannel. The membrane tension could be estimated by observing the membrane radii of the liposomes trapped in these funnels. We believe that with the proposed microchannel, we can evaluate the membrane tension of liposomes with minimal leakage of dispersion and reduced damage due to stress concentration. In addition, we believe that our proposed microchannel is less influenced by the fabrication accuracy.
Using the proposed microchannel, we successfully evaluated the contact angles between the liposomes and funnel walls, membrane radii, membrane-enclosed areas, and membrane tensions. The membrane tension was derived from the curvature radii of the trapped liposomes and the pressure difference between the inlet and outlet of the funnel using the Young–Laplace equation. The pressure difference was estimated by substituting the volumetric flow rate in the side channel (connected in parallel to the funnel) into the Darcy–Weisbach equation.
Three trapped liposomes were analyzed under two conditions: single-liposome trapping and multiple-liposome trapping. Although multiple liposomes were present under both conditions, the additional liposomes were relatively smaller under the single-liposome trapping condition. Under the single-liposome trapping condition, the contact angle trends were consistent with those expected for the advancing and receding contact angles, whereas different trends were observed under the multiple-liposome trapping condition. In addition, under the multiple-liposome trapping condition, the inlet and outlet radii observed in the side view differed. These results suggest that accurate evaluation may not be achievable under the multiple-liposome trapping condition.
The membrane tensions of the liposomes were 0.57 and 0.34 mN/m under the single-liposome trapping condition, and 0.41 mN/m under the multiple-liposome trapping condition. We did not observe any obvious differences between the two conditions; however, a detailed discussion was limited due to the small sample size. In future work, we intend to investigate the effects of friction, contact angle, and liposome size on the membrane tension evaluation using a larger dataset.
Acknowledgments
This research was supported by the Japan Society for the Promotion of Science (JSPS) KAKENHI (Nos. 20H05972, 20H05969, and 25K07661), and the Top Runners in Strategy of Transborder Advanced Researches (TRiSTAR) program conducted as the Strategic Professional Development Program for Young Researchers by the Ministry of Education, Culture, Sports, Science and Technology (MEXT).
- [1] M. Hagiya, A. Konagaya, S. Kobayashi, H. Saito, and S. Murata, “Molecular robots with sensors and intelligence,” Acc. Chem. Res., Vol.47, Issue 6, pp. 1681-1690, 2014. https://doi.org/10.1021/ar400318d
- [2] M. Hayashi, M. Nishiyama, Y. Kazayama, T. Toyota, Y. Harada, and K. Takiguchi, “Reversible morphological control of tubulin-encapsulating giant liposomes by hydrostatic pressure,” Langmuir, Vol.32, Issue 15, pp. 3794-3802, 2016. https://doi.org/10.1021/acs.langmuir.6b00799
- [3] S. Tanaka, K. Takiguchi, and M. Hayashi, “Repetitive stretching of giant liposomes utilizing the nematic alignment of confined actin,” Commun. Phys., Vol.1, Article No.18, 2018. https://doi.org/10.1038/s42005-018-0019-2
- [4] Y. Sato, Y. Hiratsuka, I. Kawamata, S. Murata, and S. M. Nomura, “Micrometer-sized molecular robot changes its shape in response to signal molecules,” Sci. Robot., Vol.2, No.4, Article No.aal3735, 2017. https://doi.org/10.1126/scirobotics.aal3735
- [5] K. Uesugi, “Evaluating mechanical properties of liposomes,” S. Murata, T. Nakakuki, S. Nomura, and A. Kuzuya (Eds.), “Molecular robotics II: Toward chemical AI,” pp. 135-150, Springer Nature Singapore, 2026.
- [6] R. Kwok and E. Evans, “Thermoelasticity of large lecithin bilayer vesicles,” Biophys. J., Vol.35, Issue 3, pp. 637-652, 1981. https://doi.org/10.1016/S0006-3495(81)84817-5
- [7] E. Evans and D. Needham, “Physical properties of surfactant bilayer membranes: Thermal transitions, elasticity, rigidity, cohesion, and colloidal interactions,” J. Phys. Chem., Vol.91, Issue 16, pp. 4219-4228, 1987. https://doi.org/10.1021/j100300a003
- [8] D. Needham and E. Evans, “Structure and mechanical properties of giant lipid (DMPC) vesicle bilayers from 20°C below to 10°C above the liquid crystal-crystalline phase transition at 24°C,” Biochemistry, Vol.27, Issue 21, pp. 8261-8269, 1988. https://doi.org/10.1021/bi00421a041
- [9] E. Evans and W. Rawicz, “Entropy-driven tension and bending elasticity in condensed-fluid membranes,” Phys. Rev. Lett., Vol.64, No.17, pp. 2094-2097, 1990. https://doi.org/10.1103/PhysRevLett.64.2094
- [10] D. Needham and R. S. Nunn, “Elastic deformation and failure of lipid bilayer membranes containing cholesterol,” Biophys. J., Vol.58, No.4, pp. 997-1009, 1990. https://doi.org/10.1016/S0006-3495(90)82444-9
- [11] K. Olbrich, W. Rawicz, D. Needham, and E. Evans, “Water permeability and mechanical strength of polyunsaturated lipid bilayers,” Biophys. J., Vol.79, Issue 1, pp. 321-327, 2000. https://doi.org/10.1016/S0006-3495(00)76294-1
- [12] W. Rawicz, K. C. Olbrich, T. Mcintosh, D. Needham, and E. Evans, “Effect of chain length and unsaturation on elasticity of lipid bilayers,” Biophys. J., Vol.79, Issue 1, pp. 328-339, 2000. https://doi.org/10.1016/S0006-3495(00)76295-3
- [13] M. Elias, A. Dutoya, A. Laborde, A. Lecestre, C. Montis, L. Caselli, D. Berti, B. Lonetti, C. Roux, and P. Joseph, “Microfluidic characterization of biomimetic membrane mechanics with an on-chip micropipette,” Micro Nano Eng., Vol.8, Article No.100064, 2020. https://doi.org/10.1016/j.mne.2020.100064
- [14] S. Landiech et al., “Parallel on-chip micropipettes enabling quantitative multiplexed characterization of vesicle mechanics and cell aggregates rheology,” APL Bioeng., Vol.8, Issue 2, Article No.026122, 2024. https://doi.org/10.1063/5.0193333
- [15] Q. Guo, S. M. McFaul, and H. Ma, “Deterministic microfluidic ratchet based on the deformation of individual cells,” Phys. Rev. E, Vol.83, No.5, Article No.051910, 2011. https://doi.org/10.1103/PhysRevE.83.051910
- [16] Q. Guo, S. Park, and H. Ma, “Microfluidic micropipette aspiration for measuring the deformability of single cells,” Lab Chip, Vol.12, Issue 15, pp. 2687-2695, 2012. https://doi.org/10.1039/c2lc40205j
- [17] Q. Guo, S. J. Reiling, P. Rohrbach, and H. Ma, “Microfluidic biomechanical assay for red blood cells parasitized by Plasmodium falciparum,” Lab Chip, Vol.12, Issue 6, pp. 1143-1150, 2012. https://doi.org/10.1039/c2lc20857a
- [18] W. B. Haines, “Studies in the physical properties of soil. V. The hysteresis effect in capillary properties, and the modes of moisture distribution associated therewith,” J. Agric. Sci., Vol.20, Issue 1, pp. 97-116, 1930. https://doi.org/10.1017/S002185960008864X
- [19] L. M. Lee and A. P. Liu, “A microfluidic pipette array for mechanophenotyping of cancer cells and mechanical gating of mechanosensitive channels,” Lab Chip, Vol.15, Issue 1, pp. 264-273, 2015. https://doi.org/10.1039/c4lc01218f
- [20] Y.-J. Li et al., “A microfluidic micropipette aspiration device to study single-cell mechanics inspired by the principle of Wheatstone bridge,” Micromachines, Vol.10, Issue 2, Article No.131, 2019. https://doi.org/10.3390/mi10020131
- [21] W.-H. Tan and S. Takeuchi, “A trap-and-release integrated microfluidic system for dynamic microarray applications,” Proc. Natl. Acad. Sci. U.S.A., Vol.104, No.4, pp. 1146-1151, 2007. https://doi.org/10.1073/pnas.0606625104
- [22] F. M. White, “Viscous Flow in Ducts,” F. M. White and H. Xue (Eds.), “Fluid Mechanics, 7th ed.,” pp. 347-454, McGraw-Hill, 2011.
- [23] K. Tsumoto, H. Matsuo, M. Tomita, and T. Yoshimura, “Efficient formation of giant liposomes through the gentle hydration of phosphatidylcholine films doped with sugar,” Colloids Surfaces B: Biointerfaces, Vol.68, Issue 1, pp. 98-105, 2009. https://doi.org/10.1016/j.colsurfb.2008.09.023
- [24] F. G. Woodhouse and R. E. Goldstein, “Shear-driven circulation patterns in lipid membrane vesicles,” J. Fluid Mech., Vol.705, pp. 165-175, 2012. https://doi.org/10.1017/jfm.2012.118
- [25] A. R. Honerkamp-Smith, F. G. Woodhouse, V. Kantsler, and R. E. Goldstein, “Membrane viscosity determined from shear-driven flow in giant vesicles,” Phys. Rev. Lett., Vol.111, Article No.038103, 2013. https://doi.org/10.1103/PhysRevLett.111.038103
- [26] B. Sebastian, T. Favero, and P. S. Dittrich, “The effects of shear force transmission across vesicle membranes,” J. Phys. Chem. Lett., Vol.8, Issue 24, pp. 6128-6134, 2017. https://doi.org/10.1021/acs.jpclett.7b02676
- [27] H. Sugiyama, T. Osaki, S. Takeuchi, and T. Toyota, “Perfusion chamber for observing a liposome-based cell model prepared by a water-in-oil emulsion transfer method,” ACS Omega, Vol.5, Issue 31, pp. 19429-19436, 2020. https://doi.org/10.1021/acsomega.0c01371
- [28] I. Biswas, A. Kumar, and M. Sadrzadeh, “Microfluidic membrane filtration systems to study biofouling,” M. S. Kandelousi (Ed.), “Microfluidics and Nanofluidics,” pp. 293-308, IntechOpen, 2018. https://doi.org/10.5772/intechopen.75006
- [29] H.-J. Butt et al., “Contact angle hysteresis,” Curr. Opin. Colloid Interface Sci., Vol.59, Article No.101574, 2022. https://doi.org/10.1016/j.cocis.2022.101574
- [30] S. D. Shoemaker and T. K. Vanderlick, “Intramembrane electrostatic interactions destabilize lipid vesicles,” Biophys. J., Vol.83, Issue 4, pp. 2007-2014, 2002. https://doi.org/10.1016/S0006-3495(02)73962-3
- [a] Video 1, “Fluorescence microscopy movie of the microchannel into which a fluorescent liposome dispersion was introduced.” https://youtu.be/X_pEGb2fLvY [Accessed April 15, 2026]
- [b] Video 2, “Fluorescence microscopy movie showing a liposome dispersion flowing through the device, with all 30 funnels successfully trapping liposomes.” https://youtu.be/ucs1pth_EFU [Accessed April 15, 2026]
This article is published under a Creative Commons Attribution-NoDerivatives 4.0 Internationa License.