
Development Report:
Cross-Day Grape Cluster Tracking Using Branch-Based 3D Alignment in Vineyards
Takeshi Yoshida*,**
 , Poching Teng*
, Tomohiko Ota*, and Noriyuki Murakami*
, Poching Teng*
, Tomohiko Ota*, and Noriyuki Murakami*
*National Agriculture and Food Research Organization
1-31-1 Kannondai, Tsukuba, Ibaraki 305-0856, Japan
**International Professional University of Technology in Osaka
3-3-1 Umeda, Kita-ku, Osaka, Osaka 530-0001, Japan

In Japan, the quantity of domestically produced fruit has been gradually decreasing, while wholesale prices have continued to rise due to declining production volumes and a shift toward high-quality varieties. To address these trends, improving quality and reducing labor through automation have become urgent challenges. In precision viticulture, monitoring the growth of grape clusters plays a key role in yield estimation, disease management, and optimal harvest timing. Although recent advances in deep learning and 3D reconstruction have enabled accurate fruit detection and modeling in vineyards, tracking the same clusters on different days remains challenging because of branch movement, fruit growth, and varying imaging conditions. This study proposes a branch-based 3D alignment framework for the cross-day tracking of grape clusters. Stable vine structures, such as trunks and main branches, are reconstructed using Structure from Motion, and their spatial correspondences are estimated through SIFT-based matching and similarity transformation. Once the coordinate systems of different days are aligned, the grape clusters detected by CenterNet are associated based on spatial proximity in the unified 3D space. Experiments over multiple observation days demonstrated that the proposed method successfully maintained the consistent tracking of grape clusters throughout the growth period. These results indicate that branch-based alignment effectively stabilizes multi-day observations and facilitates the temporal monitoring of fruit growth, supporting automated phenotyping and future field robot applications in viticulture.
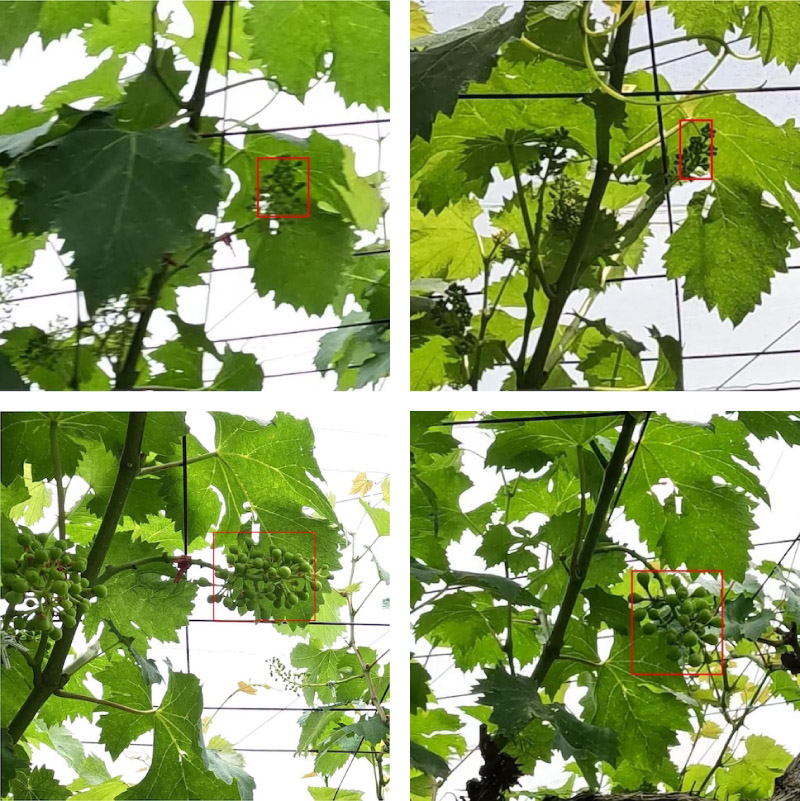
Examples of successful grape cluster tracking
1. Introduction
In Japan, although the wholesale volume of domestically produced fruit has been declining, wholesale prices have shown a steady upward trend a. This phenomenon is attributed to a structural shift toward premium varieties and products as well as a reduction in production volume that exceeds the decline in market demand. To address these trends, efforts are being made to promote high-quality production and labor-saving cultivation practices through automation and precision agriculture b.
In Japan, the sustainability of fruit production is further challenged by rapid labor shortages and population aging in the agricultural sector. According to national statistics, the number of commercial farming households decreased by approximately half between 2000 and 2020. Farmers aged 65 years and older account for approximately 70% of the agricultural workforce, while those aged 60 years and older represent nearly 80% a. This demographic trend has a particularly strong impact on fruit cultivation, which remains highly labor-intensive and difficult to mechanize.
For example, the total labor time required per 10 ares is approximately 12 hours for rice production, whereas grape cultivation requires about 307 hours per 10 ares. This large difference highlights the limited progress of mechanization in orchard management compared to that of major field crops. These conditions strongly motivate the development of automated and eventually unmanned orchard systems, in which continuous and objective monitoring of crop growth is essential.
In such automated and unmanned orchard systems, the continuous monitoring of individual fruit clusters over time is essential for tasks such as growth analysis, yield prediction, and management decision support. The ability to track the same grape clusters consistently across multiple days enables the accumulation of temporal growth data without manual intervention, which can contribute to reducing labor-intensive field observations. Therefore, establishing a robust cross-day tracking method is a key technical component for realizing practical automation of vineyard management.
Monitoring grape cluster growth plays a vital role in precision viticulture by supporting yield estimation, disease management, and determining optimal harvest periods. With recent progress in computer vision and agricultural robotics, automatic detection and monitoring of fruits in vineyards has become increasingly feasible 1. However, the robust tracking of the same clusters over multiple days remains a major technical challenge.
When two images are captured on the same day, clusters can often be associated with appearance features, such as shape, size, and color, as these characteristics remain relatively stable within short time intervals. In contrast, when images are acquired on different days, the clusters undergo noticeable changes due to natural growth, positional shifts of branches, and variations in imaging conditions, including viewpoint and illumination. These factors complicate the establishment of consistent correspondence across days, which is essential for long-term growth analysis and 3D phenotyping.
To overcome this difficulty, we focus on the structural elements of the vine that remain stable over time, specifically the trunks and major branches. Using these as landmarks, a temporally consistent 3D coordinate framework can be established, enabling robust alignment between reconstructions captured on different days. Once this branch-based alignment is achieved, the spatial correspondence of grape clusters can be inferred, even under significant growth and appearance changes, allowing reliable cross-day tracking without the need for strict positional control during image capture.
The main contribution of this study is the proposal and validation of a branch-based 3D alignment framework for tracking grape clusters on different days. The proposed method integrates (1) cluster detection using deep learning, (2) structural alignment based on stable vine branches, and (3) spatio-temporal association of grape clusters over time. Through experiments conducted in an outdoor vineyard, we demonstrate that the method achieves stable and consistent tracking of multiple grape clusters under real field conditions. This approach provides a foundation for long-term, automated growth monitoring and contributes to the advancement of labor-saving, high-precision vineyard management systems.
2. Related Work
Precision agriculture aims to enhance productivity, quality, and sustainability by integrating sensing, automation, and data-driven management.
Early studies on precision agriculture focused on crop monitoring and yield estimation using computer vision and robotic technologies 1,2,3,4. For example, Santos et al. 1 proposed image-based phenotyping for the efficient monitoring of vineyards. Behroozi-Khazaei and Maleki 4 proposed a color-feature-based algorithm that couples an artificial neural network with genetic algorithm-driven feature/architecture selection, reporting high accuracy for near-harvest grape cluster segmentation. Torres-Sánchez et al. 5 used a UAV-based 3D reconstruction to estimate the correlation between grape cluster areas and yield.
Beyond viticulture, numerous studies have explored similar approaches for other crops, such as apples 6,7, tomato 8,9,10, and lychee 11. Sa et al. 6 demonstrated a vision-based fruit detection pipeline for apple orchards using convolutional neural networks, and Bargoti and Underwood 7 developed a real-time fruit-counting system that improved the robustness under illumination variation. Fujinaga et al. generated wide-area greenhouse mosaics by integrating RGB, infrared, and depth cues to stabilize feature correspondences and suppress background rows, thus enabling lane-focused maps for tomato monitoring 8. Building on this, a subsequent study introduced a tomato growth-state map that links detection with maturity stage and harvest time estimation, illustrating how map-centric representations facilitate management decisions 9. Liang et al. detected lychee fruits at night using YOLOv3, and segmented the pedicels using U-Net, reporting a high AP/MIoU under multiple illuminance conditions 11. These studies highlight the progress of the agricultural vision for diverse crops and environments.
Parallel to detection research, three-dimensional reconstruction of plants has progressed rapidly owings to advances in Structure from Motion (SfM) and multi-view stereo techniques. Lobefaro et al. 12 developed spatio-temporal semantic mapping for fruit tracking across growth stages, and Pan et al. 10 presented panoptic mapping for shape completion and pose estimation in greenhouse crops. In addition to SfM-based geometric modeling, greenhouse-scale mapping frameworks have demonstrated that spatial registration and multimodal sensing support longitudinal monitoring. Such approaches form the foundation for the structure-based temporal analysis of plants, although few leverage these structures for cross-day geometric alignment.
Recent studies have linked 3D structural modeling to robotic navigation and environmental sensing in orchards. For instance, Noguchi 13 proposed field robots for autonomous orchard data collection, and Nishiwaki et al. 14 demonstrated orchard mapping using SLAM-based UAV sensing. These studies highlighted that stable 3D spatial representations are essential for repeatable agricultural operations; however, few studies have extended them to the temporal tracking of individual fruits.
Deep learning has significantly improved object detection and segmentation in agricultural imagery 15,16. For grapes, Shen et al. 15 achieved real-time detection and counting of clusters for grapes, and Ariza-Sentís et al. 16 combined UAV video streams with tracking-based phenotypic extraction. Pixel-level instance segmentation methods such as Mask R-CNN 17 can achieve high precision; however, annotating small immature clusters is impractical. Hence, this study employs CenterNet 18 for bounding-box-based grape cluster detection, which balances detection accuracy with labeling feasibility and supports temporal association after geometric alignment.
In summary, previous research on precision agriculture has achieved remarkable progress in fruit detection, 3D modeling, and yield analysis; however, few studies have established temporally consistent correspondences between fruits across multiple days. Our branch-based framework bridges this gap by integrating 3D structural alignment and deep learning-based fruit detection, thereby enabling robust cross-day grape cluster tracking in real vineyard environments.
3. Proposed Method
An overview of the proposed pipeline is shown in Fig. 1. The system processes multi-view images from each observation day independently, aligns the reconstructed structures using branch-based features, and performs cross-day associations of grape clusters in a unified coordinate system.
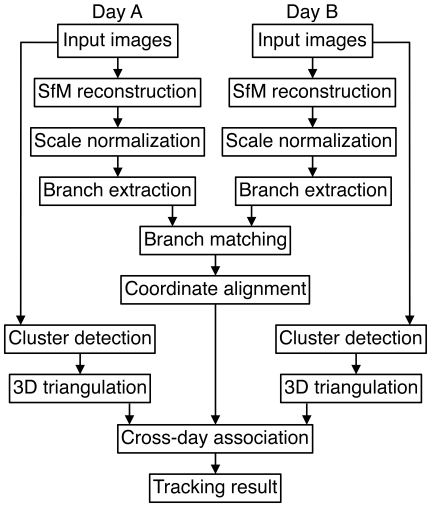
Fig. 1. Overview of the proposed cross-day grape cluster tracking pipeline.
3.1. Scale Normalization and Point Cloud Filtering
In SfM reconstruction, the resulting camera positions and point clouds are defined up to an arbitrary scale. To recover the absolute scale, four edges of an AR marker with known physical dimensions are used as geometric references. The 3D lengths of the marker edges are estimated through multi-view triangulation using the reconstructed camera poses obtained from SfM. Let \(L_{\text{measured}}\) denote the mean of the four reconstructed edge lengths and \(L_{\text{true}}\) denote the known physical edge length of the marker. The global scale factor \(s_0\) is computed as follows:
After scale normalization, points unrelated to the target vine are removed using distance-based filtering. For each camera position \(\mathbf{c}_k\), any 3D point \(\mathbf{p}\) located farther than the specified distance \(r_{\max}\) is excluded,
Finally, to initialize the alignment process, the centroid of the filtered point cloud is translated to the origin of the coordinate system,
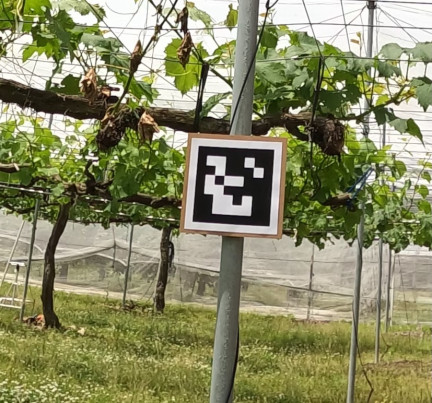
Fig. 2. Marker placed in the vineyard during image capture.
3.2. Branch-Based Structure Matching
3.2.1. Extraction of Branch Points
3D points are first reconstructed from image feature correspondences using the SfM implemented in OpenMVG 19,20. To extract only those points located on the vine branches, each 3D point is reprojected onto the corresponding image and compared with the branch mask obtained from the Mask R-CNN instance segmentation. If the reprojected point lies within the branch mask, it is retained; otherwise, it is discarded. Through this process, we obtain a filtered point cloud consisting only of points belonging to the trunk and main branches. This selective extraction improves the robustness of the subsequent alignment by eliminating the background and leaf points.
Figures 3–5 show the process of extracting branch points from the reconstructed 3D model. Fig. 3 shows the raw point cloud obtained from the SfM, Fig. 4 shows the reprojection of the 3D points onto the image overlaid with the branch segmentation mask, and Fig. 5 shows the resulting 3D point cloud containing only the branch points.
The raw point cloud generated by SfM contained an average of approximately 16 million points. However, the proposed method does not directly use all the reconstructed points. Instead, only the SfM feature points associated with vine branches through Mask R-CNN-based filtering are used for subsequent processing. Consequently, the number of points used for branch-based alignment is significantly reduced to approximately 5,000 points on average.
It should be noted that these points correspond to sparse feature-based representations of the branches rather than dense geometric point clouds. This design reduces the computational complexity while preserving sufficient structural information for reliable alignment.
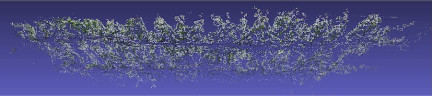
Fig. 3. Raw point cloud reconstructed by SfM.
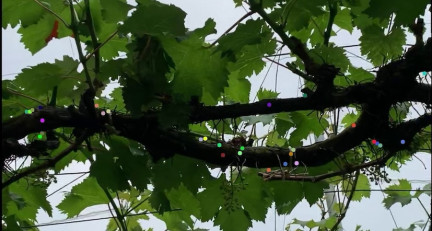
Fig. 4. Reprojection of 3D points onto the image with Mask R-CNN instance segmentation.

Fig. 5. Filtered 3D point cloud containing only branch points after mask-based selection.
3.2.2. Candidate Selection
For each query point \(\mathbf{q}\) reconstructed from Day A, candidate points are selected from the point cloud of Day B within a local neighborhood. This selection is based on the Euclidean distance in the 3D space, restricting potential correspondences to points that are spatially close to \(\mathbf{q}\) along the branch structure. The candidate set is defined as:
Figure 6 illustrates this process. The arrow indicates the query point \(\mathbf{q}\) from Day A, and the surrounding circle shows the search region in which potential candidate points from Day B are selected. The partially overlapping branch point clouds represent the structures reconstructed on different days.
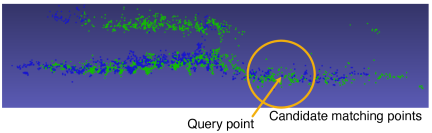
Fig. 6. Concept of candidate selection between two branch point clouds obtained on different days.
3.2.3. Descriptor Matching
Each 3D point reconstructed by SfM is associated with multiple image feature observations. In this study, we use 128-dimensional SIFT descriptors originally extracted during SfM reconstruction as local feature representations for matching.
Let \(\mathbf{q}\) be a query point reconstructed on Day A, observed in the \(M_A\) images, and \(\mathcal{N}(\mathbf{q})\) be the candidate points on Day B, where each candidate point \(\mathbf{p}_j\) is observed in the \(M_B^{(j)}\) images. For each point, all the corresponding SIFT descriptors are aggregated into the following matrices:
Figures 7 and 8 show examples of the images used for descriptor construction. Fig. 7 shows four images from Day A, where the same query point is highlighted with a red circle. Fig. 8 shows four images from Day B, where the corresponding candidate points are indicated by blue circles. These multi-view observations constitute the SIFT descriptor matrices \(D^{(A)}_{\mathbf{q}}\) and \(D^{(B)}_{\mathbf{p}_j}\) that are used in the matching process.
The purpose of branch-based alignment is not to achieve pixel-level geometric registration accuracy, but to normalize coordinate systems across observation days to enable the cross-day association of grape clusters. Therefore, the alignment performance is evaluated indirectly through the feasibility and stability of the subsequent tracking results, rather than through isolated alignment error metrics.
Although Fig. 8 appears more zoomed-in than Fig. 7, this does not negatively affect the alignment process. The proposed method relies on SIFT descriptors that are inherently invariant to scale and rotation. Consequently, differences in camera zoom and orientation do not impose strict constraints on the camera pose for alignment.
Furthermore, the target vineyard employs an H-shaped short-pruning training system, in which the main branches extend approximately along a straight line. Images were acquired by walking along this linear structure, leading to constrained and repeatable viewpoint variations across the observation days. This acquisition geometry is well suited to the proposed branch-based alignment and supports stable feature matching under practical field conditions.
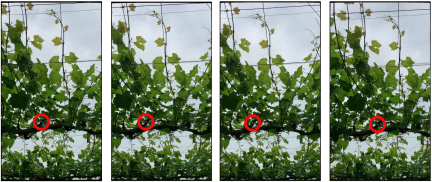
Fig. 7. Example images from Day A showing the same query point (red circle) observed from four different viewpoints.
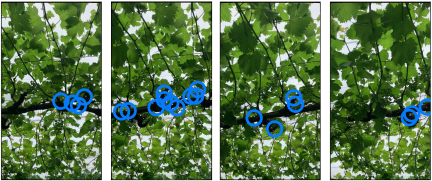
Fig. 8. Example images from Day B showing candidate points (blue circles) corresponding to the query point in Day A.
3.2.4. Transformation Estimation
After establishing a reliable correspondence between branch points, a similarity transformation is estimated to align the coordinate systems of different days:
3.3. Cluster Detection and Association
After aligning the coordinate systems of different days using branch-based matching, the grape clusters are detected and associated across days. This process comprises three main steps: cluster detection, feature extraction, and temporal association.
3.3.1. Cluster Detection
Grape clusters are detected directly from the images using a deep learning-based object detector, CenterNet. We adopt CenterNet because grape clusters are small and have complex shapes, making pixel-level annotation, for instance segmentation, extremely difficult. By contrast, CenterNet can be trained using bounding-box annotations, which are much easier and faster to generate.
Moreover, CenterNet produces a likelihood distribution within each bounding box, allowing it to capture the approximate spatial extent of a cluster even without pixel-wise masks. This property is particularly advantageous for partially occluded or overlapping clusters, which are often observed in vineyard scenes.
Figure 9 shows an example of grape cluster detection using CenterNet. The detected bounding boxes are drawn in light blue, and the heatmap in red represents the likelihood (confidence) estimated within each box.
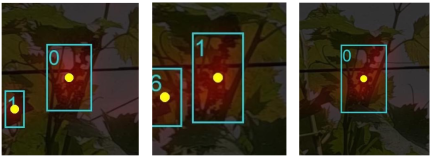
Fig. 9. Example of grape cluster detection using CenterNet.
3.3.2. Temporal Association
First, on the same day, the grape clusters are associated with multiple camera views using triangulation-based matching. From the cluster detections obtained using CenterNet, tentative 3D points are estimated by triangulating the corresponding bounding boxes from different views. For each candidate 3D point \(\mathbf{x}\) reconstructed from detections \((i,k)\), where \(i\) and \(k\) denote image indices, the point is reprojected back to all corresponding images, and the detection likelihoods at the projected positions are accumulated.
The accumulated likelihood score \(S(\mathbf{x})\) is defined as
After the 3D cluster positions are estimated for each day, the coordinate systems for all days are unified using the branch-based alignment described previously. Once the datasets are registered into a common coordinate frame, clusters located close to each other in 3D space across different days represented the same cluster over time. Formally, a temporal match between clusters \(a\) (from Day A) and \(b\) (from Day B) is determined by
Through this two-stage process-triangulation-based intra-day association followed by inter-day spatial matching-consistent time-series tracking of individual grape clusters is achieved without requiring temporal synchronization or strict camera positioning.
4. Experiments
4.1. Experimental Setup
The experiments were conducted in an outdoor vineyard at the NARO Institute of Fruit Tree and Tea Science (NIFTS), National Agriculture and Food Research Organization (NARO), Tsukuba, Japan. Four grapevines were selected as test subjects, and 49 clusters were observed from May 30 to June 20, 2022.
The observation period was limited to the three weeks from flower cluster thinning to fruit bagging. Because secondary clusters were removed during flower cluster thinning, leaving only primary clusters, only primary clusters were tracked in this study. The period before bagging was selected because, after bagging, the clusters become visually obscured, making visual observation of grape clusters impossible.
Images were captured every few days under natural lighting conditions using a multi-view camera setup. For each observation, 3D structures were reconstructed using SfM. Cluster detection was performed using CenterNet, and branch-based alignment was applied to unify the coordinate systems across days. We quantitatively evaluated the grape cluster detector using standard metrics to validate the reliability of the detection stage. Two period-specific models (early-period and late-period) were used because the appearance of grape clusters changed over the observation period. For each period, the detector was trained on 100 images and evaluated on a hold-out set of 20 images with bounding-box annotations, where the evaluation images were extracted from different frames and were not used for training. The precision, Recall, F1-score, and Average Precision at \(\mathrm{IoU}=0.5\) (AP50) were computed, and the results are summarized in Table 1.
Table 1. Detection performance on hold-out datasets (20 images for each period).

Image data were acquired using a GoPro HERO11 Black camera (resolution: \(5312\times2988\) pixels) mounted on 3-Way 2.0 handheld grip. A single camera was used, and the operator walked around the vineyard to capture multi-view images from different viewpoints around the canopy under natural illumination conditions. All computations were conducted on a workstation equipped with an Intel Core i9-7900X CPU, NVIDIA TITAN RTX GPU (24 GB VRAM), and 128 GB RAM, running Ubuntu 22.04. The computation time was evaluated using approximately 100 images. SfM reconstruction using OpenMVG required 14 minutes. Branch segmentation using Mask R-CNN required 58 seconds for 100 images, and grape cluster detection using CenterNet required 44 seconds for 100 images. Cross-day tracking between two different observation days required 12 minutes.
4.2. Tracking Results and Observations
The tracking success rate reported in the following section was evaluated conditionally on successfully detected grape clusters, thereby separating the detection performance from the cross-day association performance. A total of 49 grape clusters that were successfully detected and verified at the initial observation were used as evaluation targets. A tracking result was considered successful if the same physical cluster was correctly associated across observation days.
The proposed method successfully tracked 34 out of 49 grape clusters over a three-week observation period, resulting in a tracking success rate of 69.39% across all observation dates. Fig. 10 shows representative examples of the successful tracking results. In these cases, the clusters were consistently associated across days after coordinate alignment. Failures mainly occurred when clusters grew and physically shifted toward neighboring positions, or when heavy occlusion by leaves and overlapping inflorescences prevented correct association.
Figure 11 illustrates the failure caused by growth-induced displacement, where the tracked position of one cluster overlaps the growing region of another. Fig. 12 shows another example of failure, in which multiple elongated inflorescences completely overlap before trimming, making it difficult to maintain correspondence.
After the branch-based alignment, all daily point clouds were overlaid and color-coded by date, confirming that the reconstructed vine structures were geometrically consistent over time (Fig. 13).
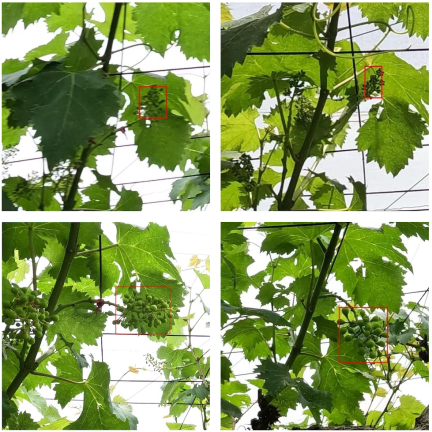
Fig. 10. Examples of successful grape cluster tracking.
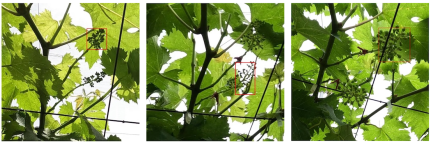
Fig. 11. Tracking failure due to growth-induced displacement.
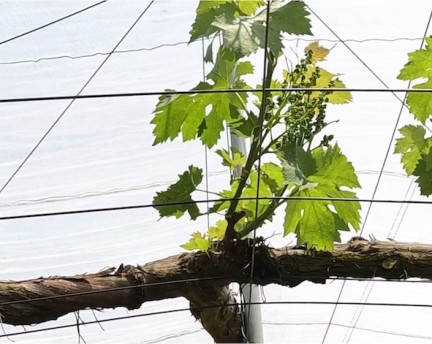
Fig. 12. Tracking failure caused by overlapping inflorescences.
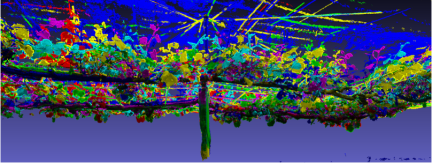
Fig. 13. Aligned branch point clouds across days.
Tracking failures are primarily caused by growth-induced displacement, severe occlusion, and branch arrangement, as discussed in Section 4.4. These factors reflect realistic challenges in outdoor vineyard environments, including occlusion, structural changes due to growth, and the proximity between neighboring clusters.
4.3. Ablation Study: Necessity of Branch-Based Alignment
To verify the necessity of the branch-based alignment, we compared the proposed method with ablation, in which the alignment was disabled. In the ablation model, each day’s SfM reconstruction remained in its original coordinate frame and only centroid normalization was performed. Consequently, cross-day associations relied solely on raw 3D proximity without coordinate unification.
As summarized in Table 2, the ablation model achieved 0.00% tracking success across all 49 clusters, whereas the proposed method achieved 69.39%. This result clearly demonstrates that cross-day tracking cannot be achieved without unifying the coordinate frames using a branch-based alignment.
Table 2. Ablation of branch-based alignment.

4.4. Discussion
The failure cases discussed in this section provide a qualitative robustness analysis of the proposed method under realistic field conditions, including occlusions and growth-related structural changes. The proposed method achieved a tracking success rate of 69.39% over three weeks. As illustrated in Figs. 11 and 12, tracking failures mainly occurred under severe occlusions and geometric ambiguities in dense canopy regions. Such conditions represent realistic challenges in long-term outdoor vineyard environments, where biological growth, occlusion, and illumination variations are unavoidable.
Analysis of failure cases revealed three main causes:
-
Growth-induced displacement: Some clusters physically shift outward as they grow, occasionally occupying positions of other clusters from earlier dates.
-
Severe occlusion before inflorescence trimming: Overlapping and elongated inflorescences make it nearly impossible to distinguish between individual clusters.
-
Branch arrangement: Tracking was most successful when clusters were alternately located on opposite sides of the lateral branches, thus reducing occlusion and projection overlap.
A critical failure scenario occurred when multiple clusters were positioned in close proximity, making it difficult to distinguish between the displacement due to growth and adjacent clusters after alignment.
Despite a success rate of 69.39%, the tracked clusters sufficiently represented the overall spatial distribution of grape clusters, making them useful for analyzing growth trends and spatial variability in precision cultivation.
Overall, the method performed best when cluster visibility and structural stability were maintained across days. Currently, temporal association is determined only by the local proximity between clusters after coordinate alignment. In the future, we plan to introduce a global optimization framework that enforces geometric consistency across the entire vine structure and jointly refines the positions of all clusters to maintain coherence at the tree scale. This extension allows for more robust and globally consistent tracking even under local ambiguities or partial occlusions.
5. Conclusion
This study presented a method for the cross-day tracking of grape clusters using branch-based 3D alignment. By utilizing the stable branch structures reconstructed via SfM, the proposed approach successfully unified the coordinate systems of different observation days and achieved consistent tracking of grape clusters over time.
Tracking primary clusters during this phenological stage enables the subsequent analysis of cluster position, light exposure, and growth dynamics, which are important factors for understanding quality formation in precision viticulture.
Experiments conducted in an outdoor NARO vineyard demonstrated that the proposed method achieved a tracking success rate of 69.39% over a three-week observation period. The results confirmed that branch-based alignment was essential for multi-day association, whereas methods without structural alignment failed to establish meaningful correspondences.
Failure primarily arises from cluster growth and severe occlusion before inflorescence trimming. Nevertheless, the approach proved effective in scenarios in which clusters maintained visibility and the geometric structure of the branches remained stable.
In future studies, we plan to extend the tracking framework to a global optimization model that ensures structural consistency across the entire vine. This allows the simultaneous adjustment of all cluster positions to maintain spatial coherence at the tree level, enabling robust and globally consistent tracking even under local ambiguities or occlusions. This capability is expected to contribute to autonomous data collection by agricultural robots and facilitate long-term phenotyping and growth analysis in precision agriculture.
Acknowledgments
This study was conducted as part of the “Project for the Development of Technologies to Strengthen International Competitiveness” of the National Agriculture and Food Research Organization (NARO). The authors express their sincere gratitude for the support.
- [1] T. T. Santos, L. P. Koenigkan, E. T. Botelho, and R. E. T. Sarro, “Grape detection, segmentation, and tracking using deep neural networks and three-dimensional association,” Computers and Electronics in Agriculture, Vol.170, Article No.105247, 2020. https://doi.org/10.1016/j.compag.2020.105247
- [2] S. Nuske, S. Achar, T. Bates, S. Narasimhan, and S. Singh, “Yield estimation in vineyards by visual grape detection,” 2011 IEEE/RSJ Int. Conf. on Intelligent Robots and Systems, pp. 2352-2358, 2011. https://doi.org/10.1109/IROS.2011.6095069
- [3] N. Shakoor, S. Lee, and T. Mockler, “High throughput phenotyping to accelerate crop breeding and monitoring of diseases in the field,” Current Opinion in Plant Biology, Vol.38, pp. 184-192, 2017. https://doi.org/10.1016/j.pbi.2017.05.006
- [4] N. Behroozi-Khazaei and M. R. Maleki, “A robust algorithm based on color features for grape cluster segmentation,” Computers and Electronics in Agriculture, Vol.142, pp. 41-49, 2017. https://doi.org/10.1016/j.compag.2017.08.025
- [5] J. Torres-Sánchez, F. J. Mesas-Carrascosa, L.-G, Santesteban, F. M. Jiménez-Brenes, O. Oneka, A. Villa-Llop, M. Loidi, and F. López-Granados, “Grape cluster detection using uav photogrammetric point clouds as a low-cost tool for yield forecasting in vineyards,” Sensors, Vol.21, No.9, Article No.3083, 2021. https://doi.org/10.3390/s21093083
- [6] I. Sa, Z. Ge, F. Dayoub, B. Upcroft, T. Perez, and C. McCool, “Deepfruits: A fruit detection system using deep neural networks,” Sensors, Vol.16, No.8, Article No.1222, 2016. https://doi.org/10.3390/s16081222
- [7] S. Bargoti and J. Underwood, “Deep fruit detection in orchards,” 2017 IEEE Int. Conf. on Robotics and Automation (ICRA), pp. 3626-3633, 2017. https://doi.org/10.1109/ICRA.2017.7989417
- [8] T. Fujinaga, S. Yasukawa, B. Li, and K. Ishii, “Image mosaicing using multi-modal images for generation of tomato growth state map,” J. of Robot. and Mechatron., Vol.30, No.2, pp. 187-197, 2018. https://doi.org/10.20965/jrm.2018.p0187
- [9] T. Fujinaga, S. Yasukawa, and K. Ishii, “Tomato growth state map for the automation of monitoring and harvesting,” J. of Robot. and Mechatron., Vol.32, No.6, pp. 1279-1291, 2020. https://doi.org/10.20965/jrm.2020.p1279
- [10] Y. Pan, F. Magistri, T. Labe, E. Marks, C. Smitt, C. McCool, J. Behley, and C. Stachniss, “Panoptic mapping with fruit completion and pose estimation for horticultural robots,” 2023 IEEE/RSJ Int. Conf. on Intelligent Robots and Systems (IROS), pp. 4226-4233, 2023. https://doi.org/10.1109/IROS55552.2023.10342067
- [11] C. Liang, J. Xiong, Z. Zheng, Z. Zhong, Z. Li, S. Chen, and Z. Yang, “A visual detection method for nighttime litchi fruits and fruiting stems,” Computers and Electronics in Agriculture, Vol.169, Article No.105192, 2020. https://doi.org/10.1016/j.compag.2019.105192
- [12] L. Lobefaro, M. Sodano, D. Fusaro, F. Magistri, M. V. R. Malladi, T. Guadagnino, A. Pretto, and C. Stachniss, “Spatio-temporal consistent semantic mapping for robotics fruit growth monitoring,” IEEE Robotics and Automation Letters, Vol.10, No.9, pp. 9470-9477, 2025. https://doi.org/10.1109/LRA.2025.3594985
- [13] N. Noguchi, “Agricultural vehicle robot,” J. of Robot. and Mechatron., Vol.30, No.2, pp. 165-172, 2018. https://doi.org/10.20965/jrm.2018.p0165
- [14] S. Nishiwaki, H. Kondo, S. Yoshida, and T. Emaru, “Proposal of uav-slam-based 3d point cloud map generation method for orchards measurements,” J. of Robot. and Mechatron., Vol.36, No.5, pp. 1001-1009, 2024. https://doi.org/10.20965/jrm.2024.p1001
- [15] L. Shen, J. Su, R. He, L. Song, R. Huang, Y. Fang, Y. Song, and B. Su, “Real-time tracking and counting of grape clusters in the field based on channel pruning with yolov5s,” Computers and Electronics in Agriculture, Vol.206, Article No.107662, 2023. https://doi.org/10.1016/j.compag.2023.107662
- [16] M. Ariza-Sentís, H. Baja, S. Velez, and J. Valente, “Object detection and tracking on uav rgb videos for early extraction of grape phenotypic traits,” Computers and Electronics in Agriculture, Vol.211, Article No.108051, 2023. https://doi.org/10.1016/j.compag.2023.108051
- [17] K. He, G. Gkioxari, P. Dollár, and R. Girshick, “Mask R-CNN,” Proc. IEEE Int. Conf. on Computer Vision (ICCV), pp. 2980-2988, 2017. https://doi.org/10.1109/ICCV.2017.322
- [18] X. Zhou, D. Wang, and P. Krähenbühl, “Objects as points,” arXiv:1904.07850, 2019. https://doi.org/10.48550/arXiv.1904.07850
- [19] P. Moulon, P. Monasse, R. Perrot, and R. Marlet, “OpenMVG: Open multiple view geometry,” Int. Workshop on Reproducible Research in Pattern Recognition, pp. 60-74, 2016. https://doi.org/10.1007/978-3-319-56414-2_5
- [20] J. L. Schönberger and J.-M. Frahm, “Structure-from-motion revisited,” Proc. of the IEEE Conf. on Computer Vision and Pattern Recognition (CVPR), pp. 4104-4113, 2016. https://doi.org/10.1109/CVPR.2016.445
- [21] D. G. Lowe, “Distinctive image features from scale-invariant keypoints,” Int. J. of Computer Vision, Vol.60, No.2, pp. 91-110, 2004. https://doi.org/10.1023/B:VISI.0000029664.99615.94
- [22] S. Umeyama, “Least-squares estimation of transformation parameters between two point patterns,” IEEE Trans. on Pattern Analysis and Machine Intelligence, Vol.13, No.4, pp. 376-380, 1991. https://doi.org/10.1109/34.88573
- [a] M. A. Fischler and R. C. Bolles, “Random sample consensus: A paradigm for model fitting with applications to image analysis and automated cartography,” Communications of the ACM, Vol.24, No.6, pp. 381-395, 1981. https://doi.org/10.1145/358669.358692
- [b] “The situation surrounding fruit trees.” https://www.maff.go.jp/j/seisan/ryutu/fruits/attach/pdf/index-184.pdf [Accessed October 16, 2025]
- [c] “Basic policy for promoting fruit tree agriculture.” https://www.maff.go.jp/j/seisan/ryutu/fruits/attach/pdf/index-198.pdf [Accessed October 16, 2025]
This article is published under a Creative Commons Attribution-NoDerivatives 4.0 Internationa License.