
Paper:
Timing Matters: Contrasting Public Sentiment During Wuhan’s and Shanghai’s COVID-19 Lockdowns
Xuanda Pei*1,†
 , Yuzuru Isoda*1
, Tomoki Nakaya*1,*2
, and Clive E. Sabel*3,*4
, Yuzuru Isoda*1
, Tomoki Nakaya*1,*2
, and Clive E. Sabel*3,*4
*1Graduate School of Science, Tohoku University
6-3 Aoba, Aramaki, Aoba-ku, Sendai, Miyagi 980-8578, Japan
†Corresponding author
*2Graduate School of Environmental Studies, Tohoku University
Sendai, Japan
*3School of Geography, Earth and Environmental Sciences, University of Plymouth
Plymouth, United Kingdom
*4School of Geography and Ocean Science, Nanjing University
Nanjing, China

Optimal crisis management depends on how much the public can tolerate stringent measures. Using large-scale Weibo microblog data and two sentiment analysis models, this study investigated and compared public sentiment responses during the COVID-19 lockdowns in Wuhan and Shanghai, focusing on how residents’ emotional expressions evolved across different stages of the pandemic. Binary and six-emotion sentiment analysis models based on bidirectional encoder representations from transformers (BERT) were employed to examine how the two cities developed distinct emotional trajectories. Emotional responses in Wuhan followed emotional Phases of Disaster, with sharp transitions from shock to solidarity, followed by disillusionment. Conversely, Shanghai’s residents displayed stable emotional fluctuations with sustained management-oriented discourse. Word frequency analysis revealed that Wuhan citizens emphasized community self-help and mutual support, while Shanghai residents focused on systematic management processes, reflecting their approach to the crisis as an administrative challenge rather than an unprecedented disaster. These differences suggest that temporal positioning within the entire pandemic timeline fundamentally shapes how cities emotionally process extended health crises. In the early stage, the public responded primarily to the health threat itself, while in the later stage, they responded predominantly to the societal disruptions caused by containment policy. This study contributes to the crisis-management literature by providing methods to gauge public sentiment and demonstrating how temporal positioning influences public emotional responses during extended crises; and to the social-sensing literature by advancing methods for large-scale sentiment tracking.
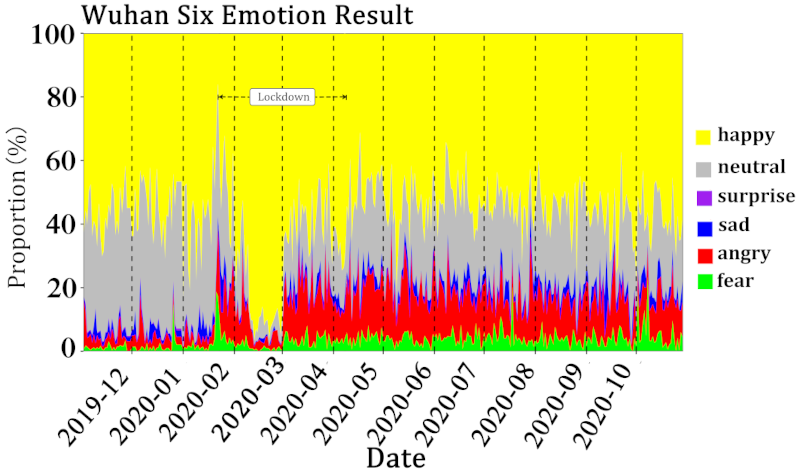
Why “happy” rose in the Wuhan lockdown?
1. Introduction
COVID-19 reshaped global society, with lockdowns emerging as major interventions for disease control 1. Although these measures reduced viral transmissions of SARS-CoV-2 2,3,4,5, they had profound societal impacts. Economically, lockdowns disrupted supply chains and devastated industries that rely on face-to-face interaction 6. Socially, they transformed daily routines and interactions, requiring rapid adaptations in residents’ education, work, and cultural practices 7,8,9,10.
Understanding public emotional responses to these unprecedented measures is crucial for crisis management for several reasons. Emotionally charged publics behave differently during crises—fear accelerates information-seeking while anger can motivate either compliance or resistance to public health directives. At the collective level, tracking sentiment shifts enables authorities to identify when communities are transitioning between crisis phases, allowing timely adjustments to communication strategies and resource allocation 11,12. Moreover, monitoring public emotion provides a means to evaluate the social costs of containment measures and to calibrate future interventions to better balance epidemiological and psychological outcomes.
The primary aim of this study is to examine and compare the public emotional trajectories reflected in social media posts during lockdown periods in Wuhan and Shanghai. Through sentiment and emotion classification of Weibo content, we examine how urban populations emotionally experienced the crisis across different temporal positions on the pandemic timeline.
The temporal progression of COVID-19 responses presents an opportunity to examine the evolution of crisis perceptions. In emergencies, information has a “finite useful life” corresponding to the time during which it can be considered stable, making temporal coherence crucial for effective crisis responses 13. Cities which were heavily affected during the early stage of COVID-19 faced particular challenges 14,15. To systematically analyze how crisis perceptions evolve, this study employs the Phases of Disaster framework, which has proven effective across various natural disasters 16,17. This six-phase framework provides a structured approach to understanding community emotional trajectories during crises, but its applicability to extended events, like COVID-19 lockdowns, remains largely unvalidated empirically.
These observations underscore the critical role of temporal dimensions in crisis management. The temporal scales of crisis events shape physical processes and societal responses, including how communities learn from and adapt to disasters 18. A city’s temporal positioning in the sequence of crisis events influences its response capability. Cities affected later in a crisis can draw upon accumulated experience, whereas those affected first must develop responses without such precedents 19.
The COVID-19 lockdowns in Wuhan and Shanghai present compelling cases. As the industry and transportation hub of central China, Wuhan’s experience during the first COVID-19 lockdown offers insights into initial crisis-response patterns 20,21. Meanwhile, the case of Shanghai in 2022 provides an opportunity to examine how accumulated experience from earlier lockdowns influenced response patterns across different stages of COVID-19 22. The distinct urban characteristics and temporal positioning of these two cities shape public responses to similar containment measures.
2. Literature Review
2.1. Crisis Management: Phases of Disaster
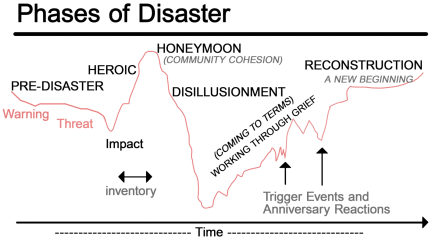
Fig. 1. The six phases of the Phases of Disaster framework, showing the typical emotional trajectory of communities over time. Adapted from Zunin and Myers, as presented in the Training Manual for Mental Health and Human Service Workers in Major Disasters 16.
Understanding crisis phases is crucial for analyzing how communities respond to disasters across different temporal positions. As shown in Fig. 1, the Phases of Disaster framework 16,17 identifies six phases that characterize community emotional trajectories: pre-disaster, impact, heroic, honeymoon (community cohesion), disillusionment, and reconstruction. Each phase reflects a distinct psychological state shaped by the interplay between perceived threat, available resources, and social cohesion 17.
In the pre-disaster phase, the community has not yet encountered the crisis directly, and perceived threat varies depending on the amount of warning received. The impact phase is characterized by confusion, disbelief, and acute distress, with the severity of psychosocial effects proportional to the scope of community destruction and personal loss. This gives way to the heroic phase, in which altruism and adrenaline-driven mobilization are prominent as survivors and responders prioritize rescue and mutual aid. During the subsequent honeymoon phase, community bonding intensifies as a result of shared catastrophic experience and the visible availability of support, producing a short-lived but pronounced sense of collective optimism. Over time, however, the gap between anticipated and actual recovery leads into the disillusionment phase, where unrealistic optimism gives way to discouragement, fatigue, and resentment as disaster assistance diminishes. Finally, the reconstruction phase marks a gradual return toward equilibrium, as survivors assume individual responsibility for rebuilding and, in time, find personal meaning and growth in the disaster experience. Importantly, this progression is not necessarily linear or sequential; individuals and communities move through these phases at different rates depending on disaster type, exposure severity, and available psychosocial resources 17.
This framework has demonstrated its effectiveness across various natural disaster contexts, particularly for disaster management planning and mental health intervention 16,17. However, as discussed in Sections 2.1.1 and 2.1.2, its applicability to extended, multi-wave public health crises—where the health threat and the social disruptions caused by containment policy are simultaneously present—introduces important empirical questions that this study addresses.
2.1.1. Empirical Validation Challenges in Disaster Phase Research
Prior research has demonstrated the feasibility of tracking community emotional responses to disasters through social media sentiment analysis across different temporal stages. Studies of major hurricanes—including Harvey 23, Sandy 24, Matthew 25, and Ian 26—as well as multiple US hurricanes analyzed simultaneously 27 and flood events in India 28—have shown that sentiment patterns captured from microblogs such as Twitter shift systematically before, during, and after disaster impact. These studies collectively establish that large-scale social media data can serve as a real-time indicator of community emotional states during disaster events, providing an important methodological foundation for the present research.
However, three critical gaps distinguish the present study from this body of work. First, all existing studies focus on single acute natural disaster events with discrete temporal boundaries; none compare communities experiencing similar crisis measures at different positions within an extended, multi-wave crisis sequence. Second, while these studies document emotional fluctuations over time, none explicitly examine whether the observed progression conforms to the predicted phase sequence of the Phases of Disaster model 16. Third, to the best of our knowledge, no prior study has applied this approach to empirically validate the Phases of Disaster framework at population scale in a non-English-language social media context, where both the extended nature of the crisis and the linguistic dynamics of emotional expression differ substantially from acute natural disaster settings.
Despite theoretical development of the Phases of Disaster framework, empirical validation has been constrained by fundamental methodological limitations that prevent large-scale testing during actual crisis periods. Studies have relied predominantly on retrospective approaches with limited sample sizes—Tanaka et al. 29 involved only 20 participants interviewed 20 years post-disaster, while Croll et al. 30 captured only “a snapshot of the first few months” among 130 professionals. Further, existing research has applied the Phases of Disaster framework as an interpretive framework rather than systematically validating their progression patterns through real-time emotional tracking. As Tanaka et al. 29 noted, traditional methods “cannot detect” the nuanced psychological responses during extended crises, while temporal and detection limitations prevent researchers from capturing authentic emotional evolution as disasters unfold. This systematic gap in real-time, large-scale empirical validation calls for innovative methodological approaches that can track community emotional responses during actual crisis periods.
Moreover, a particular gap exists in the emotional dimension of disaster phase validation. While theoretical models predict specific emotional trajectories—from initial shock through solidarity to disillusionment—existing studies have not systematically verified whether these predicted emotional patterns actually manifest at the population level during real-world crises. Traditional small-scale studies cannot capture the collective emotional evolution that the Phases of Disaster framework describes. The availability of large-scale social media data during COVID-19 lockdowns provides an opportunity to address this validation gap through sentiment analysis approaches.
2.1.2. Implications for Extended Crisis Research
The Phases of Disaster framework was originally developed to describe emotional trajectories following acute natural disasters, where a discrete triggering event initiates a bounded recovery sequence 16,17. Communicable disease crises such as COVID-19 differ from this original context in important respects: they involve wider, longer, and more spatially diffuse impacts, and require policy-mediated containment measures—such as lockdowns—that themselves generate societal disruptions alongside the health threat of the disease 31. Whether the Phases of Disaster framework’s predicted emotional trajectories remain applicable in this substantively different crisis context, and in what modified form, is an empirical question that this study directly addresses.
The above methodological constraints become particularly pronounced when the Phases of Disaster framework is applied to extended crises that differ substantially from the acute disaster scenarios for which these models were originally developed. Extended crises, such as pandemics, create multiple crises, where communities experience similar containment measures but with vastly different contextual knowledge and institutional preparedness.
The Phases of Disaster framework traditionally assumes relatively discrete temporal boundaries and uniform community experiences. However, extended crises introduce temporal positioning effects—where a community’s location within the broader crisis sequence fundamentally alters how residents emotionally process and respond to similar crisis measures. Communities in the early stage must develop responses without established precedents, whereas communities in the later stage can draw upon accumulated institutional learning and public familiarity with crisis measures.
Hence, innovative methodological approaches are required to address the validation gaps identified in the Phases of Disaster research, particularly through large-scale sentiment analysis of social media data that can capture authentic emotional expressions across different temporal positions within extended public health emergencies.
2.2. Temporal Positioning Effects and Extended Crises
The concept of temporal positioning— a stage within the crisis sequence—provides a crucial lens for understanding how crisis sequence affects the manifestation of the predicted phases of the Phases of Disaster framework, that is, when and why the predicted phase sequence of the Phases of Disaster framework may be modified during extended crises like pandemics. Unlike acute disasters with clear temporal boundaries, extended crises create multiple crisis stages where communities experience similar threats but with vastly different contextual knowledge and institutional preparedness. Building on the temporal coherence challenges discussed above, communities in the early stage face unprecedented challenges requiring immediate response development without prior crisis experience.
As Stogner et al. 19 documented in their analysis of police responses during COVID-19, communities in the early stage must develop responses without established precedents. Similarly, Otero-García et al. 14 showed that inadequate preparedness directly constrained crisis management effectiveness, while Deana et al. 15 noted that delayed policy feedback made anticipatory governance essential. These studies demonstrate that communities in the early stage must develop crisis management approaches experimentally, often resulting in more pronounced emotional fluctuations as communities navigate unprecedented circumstances.
By contrast, communities affected later benefit from accumulated institutional learning and public familiarity with crisis measures. Aubrecht et al. 18 emphasized that the temporal scales of crisis events shape how communities build resilience through experience. In the later stages, society can draw upon established protocols, lessons learned, and refined communication strategies developed during earlier waves. This accumulated experience may fundamentally alter emotional processing patterns, potentially flattening the dramatic phase transitions observed in early-stage responses and transforming the community approach from disaster response to systematic management. The temporal positioning framework also considers how crisis preparedness and response capability evolve through accumulated experience. A community’s temporal positioning in the sequence of crisis events influences its knowledge and preparedness; countermeasures in the later stages can be built upon accumulated experience that was unavailable in the early stage. This differential access to accumulated knowledge creates systematic differences in how communities emotionally process similar crisis measures.
Understanding how temporal positioning shapes crisis-response patterns provides a theoretical basis for expecting systematic differences in emotional responses across stages of an extended crisis. In the early stage, communities face an unfamiliar threat with no established precedents, and the public is likely to regard the crisis as a force majeure—an overwhelming external event beyond human control. Under these conditions, emotional responses are expected to follow the dynamics the Phases of Disaster framework was originally designed to capture: acute shock, collective solidarity, and eventual disillusionment as the crisis persists. In the later stage, however, the same threat is no longer unknown. The public may reasonably expect that authorities have developed effective countermeasures based on accumulated experience and knowledge from earlier stages. Emotional responses in this stage may therefore be shaped less by the health threat itself and more by the perceived adequacy of policy responses—shifting from crisis-driven to policy-mediated emotional dynamics. This distinction provides a theoretically grounded basis for comparing emotional trajectories across temporally distinct crisis stages.
2.3. Digital Crisis Communication and Sentiment Expression
Social media platforms function as real-time “sensors” of collective emotion during crises, expanding classic crisis-communication models. During public health crises, media coverage and communication patterns influence risk perception, with active social media users assigning more credibility to social media coverage than traditional mass media coverage 32,33,34,35. Social media provides emotional support after crises by enabling people to collaborate, share information, and resolve demands 36.
While traditional media operate through one-way communication, social media enables reciprocal, many-to-many dialogue. This interactivity, as documented by Hughes and Palen 37, enables social media to depart from traditional one-way media 36,38, making it crucial during rapidly evolving crises when real-time information becomes essential. Through “citizen journalism,” people use mobile technologies to give accounts to mainstream media or web-based outlets 36.
The temporal dimension of crisis communication is also crucial. VanRoo et al. 39 revealed how perceptions of crisis-related stress shifted from “unusual” to “normal” as the pandemic progressed, demonstrating how cognitive adaptation influences crisis communication strategies and outcomes. However, increased reliance on social media also presents challenges. Cho et al. 40 revealed that biased information and media coverage can perpetuate faulty understandings or escalate problems based on prejudice. Tsoy et al. 41 demonstrated how social media exposure influences perceived threat and efficacy through fear-driven models, highlighting the complex relationship between media consumption and risk assessment behaviors during health crises.
Taken together, these findings position social media as both an indispensable communication channel and a living laboratory of emotion during extended crises—offering unprecedented opportunities to observe authentic public reactions and iterate crisis strategies in real time.
2.4. Computational Approaches and Geographic Studies
Recent advances in computational text analytics have enhanced opportunities for large-scale empirical validation of disaster theories during extended crises. Lamsal 42 developed COVID-19-specific sentiment classification pipelines using multilingual bidirectional encoder representations from transformers (BERT) models, which outperformed traditional lexicon-based methods in detecting nuanced emotional tone across platforms like Twitter and Weibo. Xue et al. 43 applied topic modeling and sentiment scoring to monitor mental health concerns during COVID-19, while Fang et al. 44 demonstrated the effectiveness of combined lexicon and machine learning approaches for Chinese text sentiment classification, achieving high accuracy in specialized contexts. These methodological advances seem particularly promising for analyzing crisis responses in Chinese social media contexts.
Geographic comparative studies have demonstrated that spatial and institutional contexts significantly influence online emotional expression during crises. Poblete et al. 45 analyzed Twitter usage patterns across ten countries, demonstrating significant geographic variations in sentiment expression, with countries like Brazil showing consistently higher happiness levels compared to others. Yang et al. 46 analyzed spatial patterns of public panic on Chinese social networks during COVID-19, revealing that economically developed areas such as Beijing, Shanghai, and Guangdong exhibited higher emotional intensity than distant regions, while areas surrounding outbreak centers like Wuhan displayed neighborhood diffusion effects. These findings point to the need to take account of urban characteristics when comparing crisis emotional responses across cities.
Our study builds on this literature by introducing “temporal positioning” as a complementary explanatory factor to geographic variations, examining how temporal factors systematically influence emotional processing patterns during COVID-19 lockdowns while accounting for both geographic and temporal factors that shape crisis emotional responses.
2.5. Aim and Objective
Building on this literature review, our study addresses the critical empirical validation gap in the Phases of Disaster framework during COVID-19 lockdowns. The ongoing discussion in crisis management and disaster psychology centers on whether the predicted phases of the Phases of Disaster framework actually manifest in measurable community emotional responses during sustained public health crises, and whether these patterns hold across different temporal positions within extended pandemic sequences.
The temporal positioning framework introduced in this study provides a novel theoretical lens for understanding these systematic differences. Unlike traditional disaster research that assumes uniform community responses regardless of crisis timing, temporal positioning theory predicts that a stage within the crisis sequence fundamentally alters how communities emotionally process and respond to lockdowns. This framework bridges disaster psychology theory with computational social science methods, offering both theoretical advancement and empirical validation opportunities.
On that basis, we formulated the following research objective: to identify and quantify patterns in public sentiment in the early and the later stages of prolonged crisis, focusing on how temporal positioning influences the intensity and progression of emotional responses.
This study contributes to crisis-management literature by empirically testing the “temporal positioning effect”—how temporal positioning in crisis sequences shapes public emotional responses during COVID-19 lockdowns—while providing the first large-scale computational validation of the Phases of Disaster framework in pandemic containment contexts. This dual contribution addresses both the theoretical gap in empirical validation of the Phases of Disaster framework and the methodological gap in crisis sentiment analysis, positioning our work at the intersection of crisis management theory, disaster psychology, and computational social science.
3. Data and Methods
3.1. Study Area
3.1.1. Wuhan: Central Transportation and Industrial Hub
Wuhan (Fig. 2, left), located at the confluence of the Yangtze and Han Rivers, is central China’s largest transportation and industrial hub. During the first city-wide COVID-19 lockdown (January 23–April 8, 2020), urban characteristics of the city significantly shaped its crisis-response capacity. With a population of 12.33 million 47, the industrial base and transportation infrastructure of Wuhan played dual roles: initially contributing to virus transmission but later proving crucial for mobilization and distribution of emergency resources 48,49.
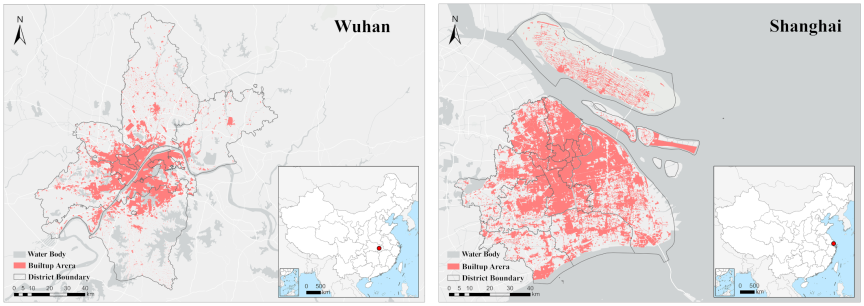
Fig. 2. Maps of Wuhan (left) and Shanghai (right).
The city’s established community governance system, developed through years of industrial organization, enabled effective grassroots mobilization during the crisis 50. Its manufacturing foundation, particularly in sectors such as biomedicine and medical supplies, facilitated rapid industrial conversion for emergency production 51. Moreover, as a major transportation hub, Wuhan’s logistics networks, although initially shut down, supported efficient resource distribution after they were mobilized for emergency response.
3.1.2. Shanghai: Global Financial Center
Shanghai (Fig. 2, right) implemented the lockdown from March 1 to June 1, 2022, and faced distinct challenges, shaped by its global city functions 52,53. As China’s leading financial center, Shanghai’s governance model, oriented toward international business facilitation and market operations, has faced unprecedented challenges in balancing economic concerns with public health measures 49,54. Its highly mobile population and complex stakeholders demand management approaches that are more sophisticated than traditional community-based control measures 55. This was particularly evident in how the city struggled to maintain an efficient resource distribution across its interconnected commercial and residential zones 56.
3.1.3. Comparative Impact on Crisis Response
These contrasting urban characteristics fundamentally shaped the crisis response patterns. Despite initial challenges, the industrial base and established community networks of Wuhan supported effective resource mobilization and community-level implementation of control measures 57. The city’s experience demonstrated how traditional industrial cities could leverage existing organizational structures for crisis management.
Meanwhile, Shanghai’s case revealed the unique challenges faced by global cities in response to crises. Its international orientation and service-based economy required more nuanced control measures, while its complex stakeholder landscape necessitated sophisticated coordination mechanisms. The city’s struggle to maintain efficient resource distribution highlighted the distinct challenges faced by advanced urban systems during public health emergencies.
These urban characteristics interacted with temporal factors to produce different response patterns. Although Wuhan’s industrial and community foundations enabled rapid adaptation after the initial setbacks, Shanghai, as a global city, functioned with a complicated immediate response and public expectations influenced by international standards.
3.1.4. Temporal Context and Knowledge Differences
The temporal positioning of these lockdowns created fundamental differences in available knowledge and resources. Wuhan’s lockdown occurred when COVID-19 was largely unknown—the first patient showed symptoms on December 8, 2019 58, with official reports emerging on December 31, 2019 59. No vaccines, treatment protocols, or transmission knowledge existed. Meanwhile, Shanghai’s 2022 lockdown occurred with vaccine availability, established protocols, and comprehensive viral understanding. These differences represent the concrete mechanisms through which temporal positioning effects operate, influencing how communities emotionally process similar containment measures.
3.1.5. Crisis Context and Social Media Usage
COVID-19 lockdowns generated unprecedented challenges that fundamentally shaped public emotional responses in both cities. The scope of these disruptions was particularly pronounced in major urban centers like Wuhan and Shanghai, where dense populations and complex economic systems amplified the impacts of lockdown. Industries dependent on physical interaction faced immediate shutdowns, while digital platforms experienced unprecedented usage surges as populations adapted to remote work, education, and social interaction.
3.1.6. China’s Crisis Management Approach
This approach was exemplified in China’s early community-based prevention-and-control measures, which emphasized education and information dissemination 60. The Chinese government’s crisis communication strategy relied heavily on social media platforms to maintain public engagement and information flow during physical distancing periods.
The evolution of pandemic response terminology reflects the growing recognition of social media’s role in maintaining connections during physical separation. The transition from “social distancing” to “physical distancing” was purposeful, emphasizing that social connections should be maintained through digital means 61,62. During lockdowns, digital connections and alternative forms of community engagement were actively promoted to mitigate social isolation while maintaining physical distancing 63,64.
3.1.7. Digital Communication Infrastructure
With its openness and participatory nature, social media offered critical infrastructure for delivering synchronous, interactive communication between governments and citizens, bringing new impetus to citizen engagement 65,66 and transforming how communities experienced and responded to crisis measures.
Social media platforms were critical channels for crisis communication during COVID-19, reshaping information-dissemination patterns and enabling organizations to maintain operations through digital transformation 64,67. This transformation created the conditions necessary for capturing authentic public emotional responses during sustained crisis periods, making these platforms invaluable data sources for understanding community adaptation to extended lockdown measures.
3.2. Sentiment Analysis Method
3.2.1. Social Media Data Source Selection and Methodological Justification
Weibo (Sina Weibo) is China’s largest microblogging platform, functionally comparable to X (formerly Twitter), with approximately 598 million monthly active users as of 2022. Operating within China’s domestic internet infrastructure and subject to content moderation regulations, Weibo served as the primary channel for public emotional expression during COVID-19 lockdowns, making it the most appropriate data source for this study.
During COVID-19 lockdowns, social media became not only a communication channel but also the primary space for emotional expression and community connection. The lockdown context created unique methodological advantages: physical distancing requirements eliminated traditional in-person data collection methods, while simultaneously driving unprecedented increases in social media usage as isolated populations sought digital connection and emotional outlet. This transformation makes lockdown-period social media data particularly valuable for understanding authentic emotional responses to sustained crisis conditions and provides an unprecedented opportunity for empirically validating the predicted phases of the Phases of Disaster framework through large-scale sentiment analysis of real-time emotional expressions.
The methodological advantages of social media data for crisis research are substantial. Unlike traditional survey methods that suffer from temporal delays and potential recall bias, social media platforms can capture authentic emotional expressions in real-time as events unfold. Specifically, during lockdowns, the immediacy of crisis conditions and physical separation from social networks reduced social desirability bias, enabling more honest emotional expression than typical survey contexts. The two-way communication nature of social media platforms enables researchers to access unfiltered public sentiment, providing insights into genuine community responses rather than socially desirable survey responses.
Outbreak management can be improved by integrating social media data analysis with existing public health monitoring systems 11,12. This integration allows public health authorities to identify emerging concerns before they escalate, monitor community needs in real time, and adjust response strategies based on feedback. During lockdown periods, this integration becomes particularly valuable because social media captured community emotional responses that official statistics could not measure, while lockdown policies created natural experimental conditions where crisis interventions could be precisely timed against emotional response patterns. For crisis research, this integration provides methodological validation by correlating digital sentiment patterns with official health statistics and policy implementations.
The temporal granularity of social media data offers particular methodological advantages for studying extended crises. While traditional data collection methods may capture snapshots at discrete time points, social media platforms provide continuous data streams that enable researchers to track emotional evolution across different crisis phases with unprecedented temporal resolution. This continuous monitoring capability becomes essential during lockdowns, when rapid policy changes and evolving crisis conditions require real-time tracking of public emotional adaptation that traditional survey methods cannot provide.
3.2.2. Data Collection and Cleaning
Original (non-repost) Sina Weibo posts in Simplified Chinese were collected using WeiboSpider 68 (open-source implementation available at https://github.com/dataabc/weiboSpider). The population under consideration consists of original Weibo posts by the general public in each city, published before, during, and after the respective lockdown periods. Query attributes specified at collection time included language (Simplified Chinese), post type (original, non-repost), and date range. Geographic filtering and account-quality screening were applied after download.
The raw stream was filtered in three stages: (i) removal of advertisements and spam by keywords and URL rules; (ii) exclusion of accounts averaging \({>}100\) posts per day or displaying coordinated-fan or bot-like behavior; and (iii) retention of messages explicitly geo-tagged to the target city or authored by users who listed the same city in their public profile location field. The resulting corpus was therefore temporally and spatially coherent at city level. The reliability of geo-tagged Weibo data for spatial analysis has been validated in previous studies, showing strong correlation (\({>}0.94\)) with official mobility datasets and successful application in COVID-19 sentiment analysis, including specific validation for Shanghai’s 2022 outbreak 69,70.
3.2.3. Sentiment-Classification Models
Our sentiment analysis approach builds upon recent methodological advances that have demonstrated superior performance in crisis-specific contexts. Lamsal 42 developed COVID-19-specific sentiment classification pipelines using multilingual BERT models, which outperformed traditional lexicon-based methods in detecting nuanced emotional tone across platforms like Twitter and Weibo, providing methodological validation for the use of transformer-based approaches in pandemic contexts.
Technical Implementation Framework
The effectiveness of proportional sentiment analysis for capturing emotional dynamics over time has been demonstrated in previous crisis contexts 43. Xue et al. 43 showed the utility of combining unsupervised methods with longitudinal trend analysis for tracking emotional evolution over extended periods during COVID-19, providing methodological validation for our temporal approach to Phases of Disaster analysis.
Chinese Text Processing Optimization
Prior work has established the methodological foundations for our approach. Lamsal 42 demonstrated that BERT-based models are feasible for COVID-19-specific sentiment classification across social media platforms, providing feasibility evidence for transformer-based approaches in pandemic contexts. Fang et al. 44 demonstrated the effectiveness of Chinese BERT architectures for Chinese text sentiment classification, establishing the theoretical basis for applying such models to Weibo content. Building on these foundations, the binary sentiment model employs a BERT network fine-tuned on Weibo_senti_100k 71, a large-scale validated Chinese social media sentiment corpus, and further adapted with COVID-19-specific training data to improve domain coverage, consistent with the approach adopted in prior COVID-19 social media analysis 42. The six-emotion model employs the hybrid model of BERT and broad learning system (BLS) proposed by Peng et al. 72. In this model, contextual embeddings from BERT are passed to a BLS that combines linear feature nodes with non-linear enhancement nodes, and ridge regression is applied to optimize the weight-solving process and prevent overfitting, enabling classification into one of the six emotion categories.
Dual-Model Implementation
Two transformer-based classifiers were applied in parallel. One is a binary model which is a BERT network fine-tuned on Weibo_senti_100k 71 and further adapted with COVID-19-specific data to improve domain coverage, following established protocols for crisis-specific sentiment analysis 42. The other is a six-emotion model and the categories employed in this study—happy, angry, sad, fear, surprise, and neutral—were selected on both theoretical and empirical grounds. Theoretically, five of the six categories align with Ekman’s 73 foundational framework of basic emotions, which identifies happiness, anger, sadness, fear, and surprise as cross-culturally universal, discrete affective states with distinctive appraisal patterns and physiological responses. These five categories provide sufficient granularity to detect the kinds of emotional shifts that the Phases of Disaster framework anticipates across different crisis stages. The sixth category, neutral, is retained to accommodate the empirically substantial proportion of Weibo posts conveying informational or procedural content without strong affective valence, which would otherwise introduce classification bias in a corpus dominated by factual crisis reporting. This six-category scheme has been validated for Chinese social media emotion classification, including COVID-19-specific Weibo content, through the SMP2020-EWECT benchmark, and the hybrid model of BERT and BLS proposed by Peng et al. 72: contextual embeddings from BERT are passed to a BLS that combines linear feature nodes with non-linear enhancement nodes; ridge regression is applied to optimize the weight-solving process and prevent overfitting, enabling classification into happy, neutral, surprised, sad, angry, or fear categories.
Proportional Sentiment Analysis
Our analysis employed proportional sentiment classification following established quantification methodology. As Moreo and Sebastiani 74 demonstrated, “the vast majority of sentiment classification efforts actually have quantification as their final goal” when analyzing social media posts, with the objective being “determining the relative frequencies of the classes of interest” rather than absolute counts. This approach is particularly appropriate for crisis research contexts where daily post volumes fluctuate significantly, making proportional analysis necessary for meaningful temporal comparisons.
A substantial difference in corpus size—0.87M posts for Wuhan and 3.19M posts for Shanghai—primarily reflects population differences: Shanghai (population 24.87 million 75) has more than twice the population of Wuhan (12.33 million 47), resulting in a proportionally larger pool of active social media users. The proportional framework enables direct comparison between cities despite these unequal corpus sizes (0.87M Wuhan vs. 3.19M Shanghai posts).
3.2.4. Text Processing and Word Frequency Analysis
Word frequency analysis was conducted using Python 3.8 with the jieba package for Chinese text segmentation, with the aim of identifying the most frequently used words within each sentiment category to interpret the causes of temporal fluctuations in sentiment proportions. Standard text preprocessing was applied, including removal of stop words (e.g., “的,” “是,” “在,” “有”) according to a predefined Chinese stop words list. Synonymous Chinese expressions were consolidated into unified English categories based on semantic similarity and contextual usage during the pandemic period.
3.2.5. Corpus Statistics
After filtering, the dataset comprised 0.87 million Wuhan posts and 3.19 million Shanghai posts, yielding a combined total of 4.06 million posts from 1.41 million unique accounts. Labelled by the dual-model framework and analyzed in proportional form, this corpus provided a robust basis for tracking public emotion before, during, and after the two city-wide lockdowns.
4. Results
4.1. Daily Sentiment Trends During Lockdown
We classified Weibo posts from Wuhan (November 2019 to November 2020) and Shanghai (January 2022 to September 2022) using two complementary sentiment analysis approaches. We aggregated these classifications daily to track temporal patterns in emotional responses throughout the lockdown periods. For each day, the proportion of posts assigned to each sentiment category was calculated as the count of posts in that category divided by the total daily post count, enabling direct temporal comparison despite differences in absolute corpus size between the two cities.
4.1.1. Binary Sentiment Trajectories
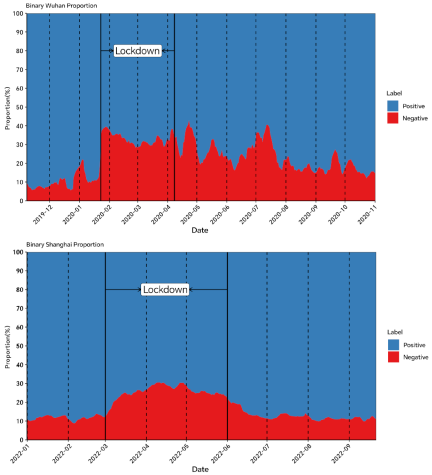
Fig. 3. Binary sentiment trends in daily emotional expressions in Wuhan (above) and Shanghai (below).
In Wuhan, although positive sentiments were prevalent before lockdown, negative sentiments increased sharply after it began on January 23, 2020, and remained consistently high throughout the lockdown (Fig. 3, above). Several peaks in negative sentiment coincided with key events, including the lockdown’s commencement and conclusion. Notably, the decline in negative sentiment after the lockdown was gradual. By contrast, Shanghai exhibited a more gradual increase in negative sentiment at the start of the lockdown (Fig. 3, below). However, following the lockdown’s end, negative sentiment in Shanghai dropped significantly, returning to pre-lockdown levels within a month.
4.1.2. Six Emotions Trajectories
The six-emotion analysis revealed different emotional patterns between Wuhan (Fig. 4, above) and Shanghai (Fig. 4, below). Before lockdown in Wuhan, happiness and neutrality were the dominant emotions, with negative emotions (anger, sadness, and fear) occupying only a small proportion of all emotional expressions in the analyzed posts (Fig. 4, above). However, at the onset of the lockdown, negative emotions, particularly anger and fear, increased sharply, albeit temporarily. From mid-March 2020 onward, happiness emerged as the predominant emotion, with distinct spikes in positive sentiments. The high-frequency words were examined later to investigate the seemingly out-of-context surge in happy posts. Following this period, negative posts, especially those expressing anger, increased again, surpassing pre-lockdown levels, and maintained a larger share. Concurrently, happy posts returned to the same proportion as before lockdown. Just before the city reopened, the proportion of neutral sentiment declined; however, it sharply rebounded after the lockdown was lifted, maintaining its dominance in the long term.
In Shanghai (Fig. 4), the six-emotion analysis revealed a markedly more stable emotional trajectory throughout the lockdown period. Happy posts maintained a moderate proportion of approximately 30%–40% during the lockdown, substantially lower than the peak of approximately 60% observed in Wuhan in mid-March 2020. Angry posts fluctuated within a narrower range of approximately 15%–20% throughout the Shanghai lockdown, without the pronounced acute spike seen in Wuhan at lockdown onset. Neutral sentiment remained relatively stable at approximately 25%–35% across the entire study period. Unlike Wuhan, where distinct phase transitions were evident in the emotional trajectory, Shanghai’s emotional profile showed smaller-scale, more gradual fluctuations, suggesting a more managed emotional response consistent with accumulated crisis experience. Following the lifting of the lockdown, happy posts rose substantially, returning to levels comparable to the pre-lockdown baseline.
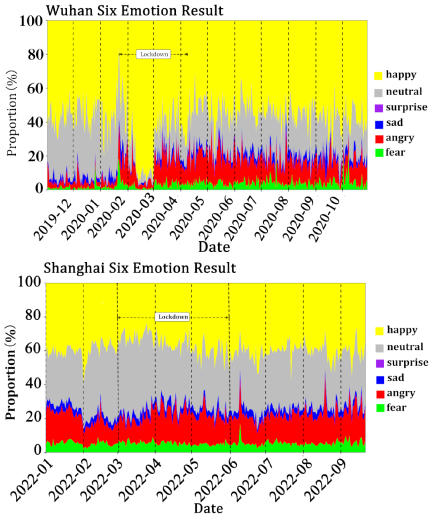
Fig. 4. Trends in daily emotional expressions in Wuhan (above) and Shanghai (below) (dashed lines indicate the commencement of each month).
4.2. Proportion Matrix of Binary Model and Six-Emotion Analysis Results
Table 1 cross-tabulates posts based on binary and six-emotion analyses for all data collected from Wuhan and Shanghai. The same posts were analyzed using both models, showing differences in varying aspects of public sentiment.
Among negative emotions, the highest proportion was neutral, followed by angry, happy, fear, sad, and surprised. Similarly, among positive emotions, neutral had the highest proportion, followed by happy, angry, fear, sad, and surprised. We will discuss later that the poor correspondence between the two classification models actually demonstrates the value of using multiple approaches to understand complex emotional responses.
| Emotions | Negative | Positive | Total [%] | ||
| Happy | 171673 | (22.8%) | 1128044 | (33.9%) | 32 |
| Neutral | 247460 | (32.8%) | 1304955 | (39.3%) | 38.3 |
| Surprise | 27425 | (3.6%) | 39835 | (1.2%) | 1.7 |
| Sad | 32434 | (4.3%) | 176821 | (5.3%) | 5.2 |
| Angry | 194641 | (25.8%) | 414197 | (12.5%) | 15 |
| Fear | 79389 | (10.5%) | 240368 | (7.3%) | 7.9 |
| Total | 753022 | (100%) | 3304220 | (100%) | 100 |
4.3. Word Frequency by Emotion
Tables 2–5 present the most frequently occurring terms within each sentiment category for each month. Each entry shows the term followed by its frequency in parentheses, representing the proportion of posts within that category containing that term. For example, “Cheer up (23.92%)” in the positive category for January indicates that 23.92% of all positive posts in January contained the term “Cheer up.” Tables 2 and 3 present the binary sentiment lexicons for Wuhan and Shanghai, respectively, while Tables 4 and 5 present the six-emotion lexicons. Generic crisis terms like “COVID-19,” “pandemic,” and “virus” appeared with similar frequency across all sentiment categories, providing limited insight into emotional differentiation. These terms were excluded from frequency analysis to focus on sentiment-specific vocabulary that better reveals emotional discourse patterns during the crisis.
4.3.1. Binary Sentiment: Positive vs. Negative Lexicons
In Wuhan (January–April 2020), the positive stream centered on morale-building terms, shifting toward practical management terms (“received”) as restrictions dragged on (Table 2).
Notably, “hospital” appears in both the positive and the negative lists for January, signaling an ambivalent public image: on the one hand, hospitals symbolized professional heroism and hope for treatment; on the other hand, they embodied fear of overload and infection risk at the pandemic’s onset.
In Shanghai, management-oriented terms appear from the beginning (Table 3). Supplies was the most used term in both positive and negative lists in April, signaling simultaneous gratitude for deliveries and frustration over shortages. Control-process nouns—prevention and control, and testing—also straddle both polarities, showing how identical measures drew praise and criticism alike. By May, the vocabulary was associated with reopening: lift lockdown, returning to work, and community-level coordination.
| Month | Positive rank 1–5 (emotion, %) | Negative rank 1–5 (emotion, %) |
| Jan. |
Hope (33.22%), Work (25.01%), Cheer up (23.92%), Donation (15.80%), Hospital (9.56%) |
Cases (20.64%), Received (17.64%), Confirmed (16.35%), Medical staff (13.69%), Hospital (11.89%) |
| Feb. |
Prevention and control (29.91%), Against (28.96%), Cases (17.09%), Confirmed (14.04%), Work (13.05%) |
Cheer up (24.38%), Confirmed (23.82%), Received (18.45%), China (14.8%), Hospital (11.91%) |
| Mar. |
Public (34.46%), Cheer up (16.53%), Work (14.17%), Lift lockdown (13.20%), Hospital (9.74%) |
Patients (22.76%), Cases (19.37%), Received (16.67%), Public (11.80%), China (9.64%) |
| Apr. |
Lift lockdown (21.48%), Received (20.11%), Public (15.90%), Against (15.20%), Work (13.28%) |
Received (16.20%), Isolation (14.30%), Patients (14.06%), Public (11.98%), Confirmed (12.36%) |
| Month | Positive rank 1–5 (emotion, %) | Negative rank 1–5 (emotion, %) |
| Mar. |
Received (4.61%), Living (4.08%), Health (3.74%), Hope (3.66%), Supplies (3.25%) |
Received (18.14%), Living (17.99%), Testing (16.68%), End (13.39%), Subdistrict (11.99%) |
| Apr. |
Supplies (9.84%), Prevention and control (7.59%), Work (5.53%), Living (5.10%), Hope (5.09%) |
Supplies (11.90%), Cases (9.35%), Work (8.41%), Received (7.08%), Testing (6.94%) |
| May |
Lift lockdown (5.38%), Received (5.04%), Supplies (4.99%), Living (4.43%), Work (3.77%) |
Lift lockdown (15.13%), Received (14.46%), Work (13.78%), Confirmed (12.32%), Testing (9.57%) |
| Month | Happy rank 1–5 (emotion, %) | Angry rank 1–5 (emotion, %) |
| Jan. |
Cheer up (24.08%), Hope (23.99%), Against (22.99%), China (20.98%), Hospital (13.40%) |
United States (32.06%), News (15.19%), Hospital (13.98%), Testing (11.85%), Country (9.10%) |
| Feb. |
Prevention and control (16.65%), Medical staff (14.57%), Against (11.27%), Cheer up (10.31%), Received (7.92%) |
Received (12.85%), Mask (8.84%), Home (8.10%), Hospital (8.03%), Confirmed (7.2%) |
| Mar. | Lift lockdown (19.80%), Public (13.21%), Prevention and Control (10.95%), Family (9.35%), Cheer up (9.23%) |
Received (15.75%), Community (15.51%), Hospital (10.84%), Isolation (8.08%), Elders (9.23%) |
| Apr. |
Cheer up (13.45%), China (13.31%), Lift lockdown (11.19%), Hospital (9.50%), Against (8.74%) |
Prevention and control (21.85%), Received (15.62%), Public (12.11%), Mask (10.25%), Community (9.81%) |
| Month | Happy rank 1–5 (emotion, %) | Angry rank 1–5 (emotion, %) |
| Mar. |
Received (6.55%), Hope (4.29%), Testing (4.01%), Cases (3.97%), Supplies (3.24%) |
Prevention and control (14.06%), Community (11.89%), Testing (9.06%), Received (7.83%), End (7.33%) |
| Apr. |
Prevention and control (7.78%), Testing (6.60%), Supplies (5.96%), Community (5.95%), Cases (5.11%) |
Supplies (21.00%), One (15.24%), Patients (9.36%), Hospital (8.32%), Received (7.28%) |
| May |
Lift lockdown (13.82%), Received (9.43%), Work (6.75%), Testing (6.53%), Donation (5.6%) |
Received (28.47%), Cases (18.85%), Confirmed (14.78%), Supplies (12.26%), School (9.31%) |
4.3.2. Six-Emotion Analysis: Happy vs. Angry Sentiments
In Tables 4 and 5, frequent words associated with happy and angry, among the six emotion categories, are listed for brevity for two reasons. First, these two emotions showed the most pronounced and temporally distinct fluctuations across both cities (Fig. 4), making them the most diagnostically informative for identifying crisis-phase transitions. Second, the Phases of Disaster framework predicts opposing community psychological states across the crisis trajectory—collective optimism and solidarity during the honeymoon phase, and discouragement and resentment during the disillusionment phase—which map most directly onto the happy and angry categories in our six-emotion classification scheme 16,17. The remaining four categories (neutral, surprised, sad, and fear) are presented in Fig. 4 and Table 1 and discussed in the context of overall emotional distribution patterns in Section 4.1.
In Wuhan, happy posts evolved from community solidarity in the early months to celebration of policy milestones such as “lift lockdown” later on. Angry posts pivoted geographically: In January, anger targeted external actors (“United States,” “news”), but by March–April, it shifted to local resource frustrations (“received,” “community,” and “isolation”).
Shanghai’s emotional landscape reflected a more structured and management-oriented response. Happy posts consistently focused on practical support mechanisms (“received,” “prevention and control,” and “testing”), while angry posts concentrated on implementation challenges: supply shortages and logistical failures. The persistence of management-oriented terminology across both emotional categories suggests that residents approached the crisis as an administrative challenge rather than an unprecedented disaster.
5. Discussion
Our analysis revealed markedly different emotional trajectories in Wuhan and Shanghai. Binary sentiment showed a sharper and more sustained rise in negativity in Wuhan than in Shanghai. The six-emotion analysis confirmed this divergence: Wuhan exhibited pronounced phase transitions—from fear and anger at lockdown onset, through a surge in happiness and solidarity, to renewed disillusionment—while Shanghai’s emotional profile remained comparatively stable and management-oriented throughout (e.g., “Received,” “Testing,” and “Supplies” dominating happy posts, while “Prevention and control” and “Community” dominated angry posts across March–May 2022, Table 5). Word frequency analysis reinforced this contrast: Wuhan’s positive posts centered on mutual encouragement and solidarity, while Shanghai’s discourse was dominated by practical management terms and resource coordination.
Interpreting these patterns through the Phases of Disaster framework 16,17 reveals both correspondences and meaningful deviations. In Wuhan, the emotional trajectory shows clear alignment with the predicted phase sequence: the sharp rise in negative sentiment, fear and anger immediately following lockdown onset corresponds to the impact phase; then altruistic vocabulary such as “Donation” and “Hope” reflects the heroic phase; the mid-lockdown dominance of happiness and solidarity-oriented language such as “Cheer up” and “Against” corresponds to the honeymoon/community cohesion phase; the subsequent re-emergence of anger and critical discourse reflects the disillusionment phase; and the post-lockdown rebound of neutral sentiment indicates movement toward reconstruction. Shanghai’s trajectory, by contrast, shows a compressed and modified phase sequence — the impact and heroic phases are less pronounced, the honeymoon phase is attenuated, and the overall emotional profile is more stable and frequently used terms are management-oriented throughout, such as “Testing,” “Received,” “Prevention and control.” We interpret this modification as evidence that temporal positioning within a prolonged crisis shapes not only the intensity of emotional responses but the structure of the phase progression itself: society with accumulated crisis experience enters the sequence at a later effective phase, bypassing the acute disorientation that characterizes the early stage.
This divergence from the Phase of Disaster suggests a possible mechanism through which temporal positioning shapes emotional responses. In Wuhan, emotional discourse may have been driven primarily by the health threat itself—fear of infection, uncertainty about disease severity, and collective solidarity against an unknown pathogen—consistent with the emotional dynamics of rapid-onset natural disasters for which the Phases of Disaster framework was originally developed. In Shanghai, where the disease was already well understood, emotional discourse may have shifted toward the societal disruptions caused by containment policy—frustration with supply shortages, fatigue from prolonged isolation, and tensions in policy implementation. This temporal shift from health-crisis-driven to policy-driven emotional discourse may represent the proximate mechanism through which temporal positioning modifies the predicted phase sequence: society experiences the acute disorientation in the early stage as the framework predicts, and a more policy-mediated emotional trajectory in the later stage that the framework was not originally designed to capture.
The two classification approaches exhibit different tendencies in capturing public emotional expression, as evidenced by our data. Binary classification tends to reflect the overall evaluation of social circumstances—negative sentiment increases when conditions are difficult and declines as conditions improve, tracking the general direction of public emotional response. Six-emotion classification, by contrast, tends to capture the specific emotional behaviors that people actively express—even during periods of heightened negativity, people may predominantly express encouragement and solidarity, which the six-emotion model identifies as happy. The term “Cheer up” illustrates this difference directly. In February 2020, when binary negative sentiment was at its peak during the Wuhan lockdown, “Cheer up” appeared in 24.38% of all negative posts under binary classification—yet the same term appeared in 10.31% of happy posts under the six-emotion model (Tables 2 and 4). The two models reached opposite classifications for posts containing this term: Binary registered the overall circumstances as negative (encouragement presupposes difficulty), while the six-emotion model identified the emotional expression itself as happy (encouragement is an act of positive emotional support). This is not a contradiction but a reflection of two different aspects of the same social reality—and it is precisely why combining both approaches provides a more complete picture than using either of them.
Despite its contributions, this study has certain limitations. First, our reliance on social media data may not capture the complete spectrum of public responses, and Weibo’s content moderation practices could influence data representativeness. While Weibo allows criticism of government officials and policies, posts related to collective action events are systematically censored, and unclear content boundaries encourage user self-censorship 76,77. Second, while the health crisis and the societal disruptions caused by lockdown policies are treated as intertwined in our analysis—as indeed they were for the populations studied—the interpretation of emotional signals as driven primarily by health threat or policy disruption remains speculative rather than empirically demonstrated. Third, the stage-by-stage temporal distribution of post volumes was not systematically recorded; however, the proportional analysis framework adopted in this study directly accounts for variation in daily posting volume, mitigating its potential impact on sentiment comparability across time periods. Fourth, the unique characteristics of COVID-19 as an extended, global crisis may limit the generalizability of our findings to other disaster types and cultural contexts. Fifth, the interpretation that emotional discourse shifted from health-crisis-driven to policy-driven reflects a specific crisis trajectory—a rapid-onset health emergency transitioning into a prolonged policy-mediated intervention. This may not generalize to slow-onset disasters, where disillusionment may also emerge but be directed primarily toward government policy dissatisfaction rather than the health threat itself, nor to prolonged crises in which the two stressors are not temporally separable.
6. Conclusion
Our comparative analysis of emotional responses to COVID-19 lockdowns in Wuhan and Shanghai reveals how temporal positioning shapes crisis perception and management. Based on binary and six-dimensional sentiment analyses, along with word frequency investigation, we uncovered patterns in how these cities responded to similar challenges.
The binary sentiment analysis shows increased negative sentiments during lockdown in both cities, but this superficial similarity masks differences revealed by the six-emotion analysis. Wuhan’s response aligned with the predicted phase sequence of the Phases of Disaster framework, progressing from external blame through community solidarity to practical concerns, suggesting that the population processed crisis through established disaster-response patterns.
Shanghai’s emotional landscape reflects a different understanding. The consistent presence of management-focused terms across positive and negative sentiments, alongside simultaneous increases in happy and angry posts, suggests that people approach COVID-19 not as a disaster but as a management challenge. This demonstrates how prior experience can alter community response patterns.
By applying large-scale sentiment analysis to COVID-19 lockdowns, this study provides the first population-level validation of emotional patterns predicted by the Phases of Disaster framework, demonstrating that theoretical models can be applied in real-world crisis contexts. These findings challenge assumptions about disaster-phase progression and enrich our understanding of crisis responses by demonstrating how temporal positioning shapes perception and response, revealing the evolution from disaster response to the management paradigm, and highlighting the need for adaptive governance in crisis management.
Real-time public sentiment monitoring through social media can be valuable for crisis management, as it can help authorities calibrate communication strategies and adjust management approaches to satisfy community needs. This real-time feedback mechanism can help identify when communities are transitioning between different response phases, allowing for more targeted interventions.
This study contributes to our theoretical understanding of crisis response and practical crisis management by demonstrating how public perceptions and response patterns evolve through repeated crisis experiences. Effective crisis management must account for both temporal positioning and evolved public expectations while continuously monitoring community sentiment to inform policymaking and communication strategies.
- [1] V. Alfano, S. Ercolano, and M. Pinto, “Fighting the COVID pandemic: National policy choices in non-pharmaceutical interventions,” J. Policy Model., Vol.44, No.1, pp. 22-40, 2022. https://doi.org/10.1016/j.jpolmod.2021.11.003
- [2] S. Lai et al., “Effect of non-pharmaceutical interventions to contain COVID-19 in China,” Nature, Vol.585, No.7825, pp. 410-413, 2020. https://doi.org/10.1038/s41586-020-2293-x
- [3] Y. Liu et al., “The impact of non-pharmaceutical interventions on SARS-CoV-2 transmission across 130 countries and territories,” BMC Med., Vol.19, No.1, Article No.40, 2021. https://doi.org/10.1186/s12916-020-01872-8
- [4] A. Siddique et al., “Unprecedented environmental and energy impacts and challenges of the COVID-19 pandemic,” Environ. Res., Vol.193, Article No.110443, 2021. https://doi.org/10.1016/j.envres.2020.110443
- [5] K. Liu and Y. Lou, “Optimizing COVID-19 vaccination programs during vaccine shortages,” Infect. Dis. Model., Vol.7, No.1, pp. 286-298, 2022. https://doi.org/10.1016/j.idm.2022.02.002
- [6] N. Donthu and A. Gustafsson, “Effects of COVID-19 on business and research,” J. Bus. Res., Vol.117, pp. 284-289, 2020. https://doi.org/10.1016/j.jbusres.2020.06.008
- [7] J. Crawford, “COVID-19 and higher education: A pandemic response model from rapid adaptation to consolidation and restoration,” Int. Educ. J.: Comp. Perspect., Vol.22, No.1, pp. 7-29, 2023.
- [8] R. L. Jewett, S. M. Mah, N. Howell, and M. M. Larsen, “Social cohesion and community resilience during COVID-19 and pandemics: A rapid scoping review to inform the United Nations Research Roadmap for COVID-19 Recovery,” Int. J. Health Serv., Vol.51, No.3, pp. 325-336, 2021. https://doi.org/10.1177/0020731421997092
- [9] P. Śleszyński, P. Legutko-Kobus, M. Rosenberg, V. Pantyley, and M. J. Nowak, “Assessing urban policies in a COVID-19 world,” Int. J. Environ. Res. Public Health, Vol.19, No.9, Article No.5322, 2022. https://doi.org/10.3390/ijerph19095322
- [10] F. Procentese, F. Gatti, and E. Ceglie, “Technostress and work-family interface in the face of COVID-19-related remote work: The moderator role of goals setting and prioritization skills,” Community Work Fam., Vol.28, No.2, pp. 272-290, 2025. https://doi.org/10.1080/13668803.2023.2247147
- [11] E. Velasco, T. Agheneza, K. Denecke, G. Kirchner, and T. Eckmanns, “Social media and Internet-based data in global systems for public health surveillance: A systematic review,” Milbank Q., Vol.92, No.1, pp. 7-33, 2014. https://doi.org/10.1111/1468-0009.12038
- [12] A. H. Alamoodi et al., “Sentiment analysis and its applications in fighting COVID-19 and infectious diseases: A systematic review,” Expert Syst. Appl., Vol.167, Article No.114155, 2021. https://doi.org/10.1016/j.eswa.2020.114155
- [13] J.-L. Wybo, “Percolation, temporal coherence of information, and crisis prevention,” Saf. Sci., Vol.57, pp. 60-68, 2013. https://doi.org/10.1016/j.ssci.2013.01.021
- [14] L. Otero-García et al., “Austerity measures and underfunding of the Spanish health system during the COVID-19 pandemic—Perception of healthcare staff in Spain,” Int. J. Environ. Res. Public Health, Vol.20, No.3, Article No.2594, 2023. https://doi.org/10.3390/ijerph20032594
- [15] C. Deana et al., “Learning from the Italian experience during COVID-19 pandemic waves: Be prepared and mind some crucial aspects,” Acta Biomed., Vol.92, No.2, Article No.e2021097, 2021. https://doi.org/10.23750/abm.v92i2.11159
- [16] D. J. DeWolfe, “Training manual for mental health and human service workers in major disasters,” 2nd edition, U.S. Department of Health and Human Services, Substance Abuse and Mental Health Services Administration, Center for Mental Health Services, 2000.
- [17] Substance Abuse and Mental Health Services Administration, “Phases of disaster.” https://www.samhsa.gov/mental-health/disaster-preparedness [Accessed January 18, 2026]
- [18] C. Aubrecht, S. Fuchs, and C. Neuhold, “Spatio-temporal aspects and dimensions in integrated disaster risk management,” Nat. Hazards, Vol.68, No.3, pp. 1205-1216, 2013. https://doi.org/10.1007/s11069-013-0619-9
- [19] J. Stogner, B. L. Miller, and K. McLean, “Police stress, mental health, and resiliency during the COVID-19 pandemic,” Am. J. Crim. Just., Vol.45, No.4, pp. 718-730, 2020. https://doi.org/10.1007/s12103-020-09548-y
- [20] L. Wang, Z. Li, and Z. Zhang, “City profile: Wuhan 2004–2020,” Cities, Vol.123, Article No.103585, 2022. https://doi.org/10.1016/j.cities.2022.103585
- [21] Y. Yang and S. S. Han, “Wrestling between central and local: Planning and development of the Wuhan High-Speed Rail Station and its vicinity, China,” Cities, Vol.105, Article No.102828, 2020. https://doi.org/10.1016/j.cities.2020.102828
- [22] N. James, M. Menzies, and P. Radchenko, “COVID-19 second wave mortality in Europe and the United States,” Chaos, Vol.31, No.3, Article No.031105, 2021. https://doi.org/10.1063/5.0041569
- [23] S. Chen et al., “Uncovering sentiment and retweet patterns of disaster-related tweets from a spatiotemporal perspective: A case study of Hurricane Harvey,” Telemat. Inform., Vol.47, Article No.101326, 2020. https://doi.org/10.1016/j.tele.2019.101326
- [24] V. K. Neppalli, C. Caragea, A. Squicciarini, A. Tapia, and S. Stehle, “Sentiment analysis during Hurricane Sandy in emergency response,” Int. J. Disaster Risk Reduct., Vol.21, pp. 213-222, 2017. https://doi.org/10.1016/j.ijdrr.2016.12.011
- [25] F. Yuan, M. Li, and R. Liu, “Understanding the evolutions of public responses using social media: Hurricane Matthew case study,” Int. J. Disaster Risk Reduct., Vol.51, Article No.101798, 2020. https://doi.org/10.1016/j.ijdrr.2020.101798
- [26] M. Karimiziarani and H. Moradkhani, “Social response and disaster management: Insights from Twitter data assimilation on Hurricane Ian,” Int. J. Disaster Risk Reduct., Vol.95, Article No.103865, 2023. https://doi.org/10.1016/j.ijdrr.2023.103865
- [27] K. Bathina, M. ten Thij, and J. Bollen, “Quantifying societal emotional resilience to natural disasters from geo-located social media content,” PLoS One, Vol.17, No.6, Article No.e0269315, 2022. https://doi.org/10.1371/journal.pone.0269315
- [28] D. Karmegam and B. Mappillairaju, “Spatio-temporal distribution of negative emotions on Twitter during floods in Chennai, India, in 2015: A post hoc analysis,” Int. J. Health Geogr., Vol.19, No.1, Article No.19, 2020. https://doi.org/10.1186/s12942-020-00214-4
- [29] E. Tanaka, H. Tennichi, S. Kameoka, and H. Kato, “Long-term psychological recovery process and its associated factors among survivors of the Great Hanshin-Awaji Earthquake in Japan: A qualitative study,” BMJ Open, Vol.9, No.8, Article No.e030250, 2019. https://doi.org/10.1136/bmjopen-2019-030250
- [30] L. Croll et al., “The psychosocial implications of COVID-19 for a neurology program in a pandemic epicenter,” J. Neurol. Sci., Vol.416, Article No.117034, 2020. https://doi.org/10.1016/j.jns.2020.117034
- [31] H.-W. Wang et al., “Learning from each other in the management of natural disaster and the COVID-19 pandemic: A case study in Taiwan,” Front. Public Health, Vol.9, Article No.777255, 2021. https://doi.org/10.3389/fpubh.2021.777255
- [32] C. H. Procopio and S. T. Procopio, “Do you know what it means to miss New Orleans? Internet communication, geographic community, and social capital in crisis,” J. Appl. Commun. Res., Vol.35, No.1, pp. 67-87, 2007. https://doi.org/10.1080/00909880601065722
- [33] K. D. Sweetser and E. Metzgar, “Communicating during crisis: Use of blogs as a relationship management tool,” Public Relat. Rev., Vol.33, No.3, pp. 340-342, 2007. https://doi.org/10.1016/j.pubrev.2007.05.016
- [34] American Red Cross, “Web users increasingly rely on social media to seek help in a disaster.” http://www.redcross.org/portal/site/en/menuitem.94aae335470e233f6cf911df43 [Accessed January 18, 2026]
- [35] Y. Jin, B. F. Liu, and L. L. Austin, “Examining the role of social media in effective crisis management: The effects of crisis origin, information form, and source on publics’ crisis responses,” Commun. Res., Vol.41, No.1, pp. 74-94, 2014. https://doi.org/10.1177/0093650211423918
- [36] L. E. Pechta, D. C. Brandenburg, and M. W. Seeger, “Understanding the dynamics of emergency communication: Propositions for a four-channel model,” J. Homel. Secur. Emerg. Manag., Vol.7, No.1, 2010. https://doi.org/10.2202/1547-7355.1671
- [37] A. L. Hughes and L. Palen, “The evolving role of the public information officer: An examination of social media in emergency management,” J. Homel. Secur. Emerg. Manag., Vol.9, No.1, 2012. https://doi.org/10.1515/1547-7355.1976
- [38] S. Mukhtar, “Psychological health during the coronavirus disease 2019 pandemic outbreak,” Int. J. Soc. Psychiatry, Vol.66, No.5, pp. 512-516, 2020. https://doi.org/10.1177/0020764020925835
- [39] C. VanRoo, J. M. Norvilitis, H. M. Reid, and K. O’Quin, “The new normal: Amotivation, sense of purpose, and associated factors among college students during the COVID-19 pandemic,” Psychol. Rep., Vol.128, No.4, pp. 2336-2352, 2025. https://doi.org/10.1177/00332941231181485
- [40] H. Cho, W. Li, J. Cannon, R. Lopez, and C. Song, “Testing three explanations for stigmatization of people of Asian descent during COVID-19: Maladaptive coping, biased media use, or racial prejudice?,” Ethn. Health, Vol.26, No.1, pp. 94-109, 2021. https://doi.org/10.1080/13557858.2020.1830035
- [41] D. Tsoy, T. Tirasawasdichai, and K. I. Kurpayanidi, “Role of social media in shaping public risk perception during the COVID-19 pandemic: A theoretical review,” Int. J. Manag. Sci. Bus. Adm., Vol.7, No.2, pp. 35-41, 2021. https://doi.org/10.18775/ijmsba.1849-5664-5419.2014.72.1005
- [42] R. Lamsal, “Design and analysis of a large-scale COVID-19 tweets dataset,” Appl. Intell., Vol.51, No.5, pp. 2790-2804, 2021. https://doi.org/10.1007/s10489-020-02029-z
- [43] J. Xue et al., “Twitter discussions and emotions about the COVID-19 pandemic: Machine learning approach,” J. Med. Internet Res., Vol.22, No.11, Article No.e20550, 2020. https://doi.org/10.2196/20550
- [44] H. Fang, G. Jiang, and D. Li, “Sentiment analysis based on Chinese BERT and fused deep neural networks for sentence-level Chinese e-commerce product reviews,” Syst. Sci. Control Eng., Vol.10, No.1, pp. 802-810, 2022. https://doi.org/10.1080/21642583.2022.2123060
- [45] B. Poblete, R. Garcia, M. Mendoza, and A. Jaimes, “Do all birds tweet the same?: Characterizing Twitter around the world,” Proc. 20th ACM Int. Conf. Inf. Knowl. Manag. (CIKM), pp. 1025-1030, 2011. https://doi.org/10.1145/2063576.2063724
- [46] Y. Yang, Y. Zhang, X. Zhang, Y. Cao, and J. Zhang, “Spatial evolution patterns of public panic on Chinese social networks amidst the COVID-19 pandemic,” Int. J. Disaster Risk Reduct., Vol.70, Article No.102762, 2022. https://doi.org/10.1016/j.ijdrr.2021.102762
- [47] Wuhan Statistics Bureau, “Communiqué of the Seventh National Population Census of Wuhan (No.1),” May 28, 2021 (in Chinese). https://tjj.wuhan.gov.cn/tjfw/tjgb/202105/t20210528_1707390.shtml [Accessed January 18, 2026]
- [48] A. Pan et al., “Association of public health interventions with the epidemiology of the COVID-19 outbreak in Wuhan, China,” JAMA, Vol.323, No.19, pp. 1915-1923, 2020. https://doi.org/10.1001/jama.2020.6130
- [49] F. Zhang, Y. Han, and B. Cong, “How to respond effectively to COVID-19? Reports based on environmental changes in Wuhan and Shanghai,” Research Square, 2021. https://doi.org/10.21203/rs.3.rs-795086/v1
- [50] G. Yang, “Demobilizing the emotions of online activism in China: A civilizing process,” Int. J. Commun., Vol.12, pp. 1945-1965, 2018.
- [51] M. O’Sullivan et al., “The role of the state in shaping zero hours work in an atypical liberal market economy,” Econ. Ind. Democr., Vol.41, No.3, pp. 652-671, 2020. https://doi.org/10.1177/0143831X17735181
- [52] J. Liu, M. Liu, and W. N. Liang, “The dynamic COVID-zero strategy in China,” China CDC Wkly., Vol.4, No.4, pp. 74-75, 2022. https://doi.org/10.46234/ccdcw2022.015
- [53] B. Goh and R. Woo, “COVID-hit Shanghai to end two-month lockdown on June 1,” Reuters, May 30, 2022. https://www.reuters.com/world/china/some-beijing-back-work-shanghai-inches-closer-ending-covid-lockdown-2022-05-30/ [Accessed January 18, 2026]
- [54] K. Jafari, A. Özduran, and M. B. Saydam, “Hospitality and tourism industry amid COVID-19 pandemic: Voices from a small Mediterranean town,” Int. Hosp. Rev., Vol.37, No.2, pp. 243-264, 2023. https://doi.org/10.1108/IHR-07-2021-0054
- [55] Z. Chen et al., “Epidemiological characteristics and transmission dynamics of the outbreak caused by the SARS-CoV-2 Omicron variant in Shanghai, China: A descriptive study,” Lancet Reg. Health West. Pac., Vol.29, Article No.100592, 2022. https://doi.org/10.1016/j.lanwpc.2022.100592
- [56] D. Zhu, Y. Li, J. Shi, Y. Xu, and W. Shen, “A service-oriented city portal framework and collaborative development platform,” Inf. Sci., Vol.179, No.15, pp. 2606-2617, 2009. https://doi.org/10.1016/j.ins.2009.01.038
- [57] G. Bristow and A. Healy, “Regional resilience: An agency perspective,” Reg. Stud., Vol.48, No.5, pp. 923-935, 2014. https://doi.org/10.1080/00343404.2013.854879
- [58] Z. Wu and J. M. McGoogan, “Characteristics of and important lessons from the coronavirus disease 2019 (COVID-19) outbreak in China: Summary of a report of 72 314 cases from the Chinese Center for Disease Control and Prevention,” JAMA, Vol.323, No.13, pp. 1239-1242, 2020. https://doi.org/10.1001/jama.2020.2648
- [59] World Health Organization, “Archived: WHO timeline—COVID-19,” April 27, 2020. https://www.who.int/news/item/27-04-2020-who-timeline---covid-19 [Accessed January 18, 2026]
- [60] National Health Commission of the People’s Republic of China, “Notice on strengthening community prevention and control of the COVID-19 pandemic,” January 26, 2020 (in Chinese). https://www.gov.cn/xinwen/2020-01/26/content_5472235.htm [Accessed January 18, 2026]
- [61] World Health Organization, “Constitution of the World Health Organization.” https://apps.who.int/gb/bd/PDF/bd47/EN/constitution-en.pdf?fbclid=IwAR3bSPmEMO5GR9oP9tFp5lD0BZFJM-fAtc12ogjAp8kFTD2t_fahFbfFeNY [Accessed January 18, 2026]
- [62] H. Pratomo, “From social distancing to physical distancing: A challenge for evaluating public health intervention against COVID-19,” Kesmas, Vol.15, No.5, pp. 60-63, 2020. https://doi.org/10.21109/kesmas.v15i2.4010
- [63] S. G. S. Shah, D. Nogueras, H. C. van Woerden, and V. Kiparoglou, “The COVID-19 pandemic: A pandemic of lockdown loneliness and the role of digital technology,” J. Med. Internet Res., Vol.22, No.11, Article No.e22287, 2020. https://doi.org/10.2196/22287
- [64] M. Park and T. Jones, “Going virtual: The impact of COVID-19 on internships in tourism, events, and hospitality education,” J. Hosp. Tour. Educ., Vol.33, No.3, pp. 176-193, 2021. https://doi.org/10.1080/10963758.2021.1907198
- [65] D. Agostino and M. Arnaboldi, “A measurement framework for assessing the contribution of social media to public engagement: An empirical analysis on Facebook,” Public Manag. Rev., Vol.18, No.9, pp. 1289-1307, 2016. https://doi.org/10.1080/14719037.2015.1100320
- [66] E. Bonsón, D. Perea, and M. Bednárová, “Twitter as a tool for citizen engagement: An empirical study of the Andalusian municipalities,” Gov. Inf. Q., Vol.36, No.3, pp. 480-489, 2019. https://doi.org/10.1016/j.giq.2019.03.001
- [67] M. W. Graham, E. J. Avery, and S. Park, “The role of social media in local government crisis communications,” Public Relat. Rev., Vol.41, No.3, pp. 386-394, 2015. https://doi.org/10.1016/j.pubrev.2015.02.001
- [68] Y. Hu, H. Huang, A. Chen, and X.-L. Mao, “Weibo-COV: A large-scale COVID-19 social media dataset from Weibo,” Proc. 1st Workshop NLP COVID-19 (Pt.2) EMNLP 2020, 2020. https://doi.org/10.18653/v1/2020.nlpcovid19-2.34
- [69] L. Liu et al., “Assessing reliability of Chinese geotagged social media data for spatiotemporal representation of human mobility,” ISPRS Int. J. Geo-Inf., Vol.11, No.2, Article No.145, 2022. https://doi.org/10.3390/ijgi11020145
- [70] C. Liu, Y. Tian, Y. Shi, Z. Huang, Y. Shao, “An analysis of public topics and sentiments based on social media during the COVID-19 Omicron variant outbreak in Shanghai 2022,” Comput. Urban Sci., Vol.4, No.1, Article No.19, 2024. https://doi.org/10.1007/s43762-024-00128-y
- [71] Jinhuakst, “weibo_senti_100k dataset,” GitHub. https://github.com/SophonPlus/ChineseNlpCorpus/blob/master/datasets/weibo_senti_100k [Accessed January 18, 2026]
- [72] S. Peng et al., “Emotion classification of text based on BERT and broad learning system,” Proc. 5th Int. Jt. Conf. APWeb-WAIM 2021, Part 1, pp. 382-396, 2021. https://doi.org/10.1007/978-3-030-85896-4_30
- [73] P. Ekman, “An argument for basic emotions,” Cogn. Emot., Vol.6, Nos.3-4, pp. 169-200, 1992. https://doi.org/10.1080/02699939208411068
- [74] A. Moreo and F. Sebastiani, “Tweet sentiment quantification: An experimental re-evaluation,” PLOS One, Vol.17, No.9, Article No.e0263449, 2022. https://doi.org/10.1371/journal.pone.0263449
- [75] Shanghai Municipal Government, “Press release for media briefing of the Shanghai Municipal Government on May 18, 2021 – Section 1: Introduction to the Seventh National Census,” May 18, 2021 (in Chinese). https://www.shanghai.gov.cn/nw12344/20210518/001a0cef127c499eb381fa8dc3208e95.html [Accessed January 18, 2026]
- [76] J. Y. M. Nip and K.-W. Fu, “Networked framing between source posts and their reposts: An analysis of public opinion on China’s microblogs,” Inf. Commun. Soc., Vol.19, No.8, pp. 1127-1149, 2016. https://doi.org/10.1080/1369118X.2015.1104372
- [77] G. King, J. Pan, and M. E. Roberts, “Reverse-engineering censorship in China: Randomized experimentation and participant observation,” Science, Vol.345, No.6199, Article No.1251722, 2014. https://doi.org/10.1126/science.1251722
This article is published under a Creative Commons Attribution-NoDerivatives 4.0 Internationa License.