
Paper:
Role of Asset Protection Strategies in the Recovery of Productive Assets: Evidence from Nepal’s Earthquake
Nirmal Kumar Raut*,†
 and Geetanjali Upadhyaya**
*Central Department of Economics, Tribhuvan University
Kirtipur, Kathmandu, Nepal
†Corresponding author
**Nepal Administrative Staff College
Lalitpur, Nepal

More than a decade after Nepal’s 2015 earthquake, empirical research on the recovery of productive assets, such as crops, livestock, and farm infrastructure remains limited. In particular, few studies have examined the effectiveness of various asset protection strategies, such as public aid and political connections, in supporting post-disaster recovery. Similarly, no empirical evidence has explicitly evaluated the adequacy of housing aid in covering reconstruction costs. This study addresses these gaps by investigating three main questions. First, it assesses the current status of asset recovery and examines the key factors, including protective strategies that have contributed to household recovery. Second, it analyzes the convergence patterns in the recovery process. Third, it evaluates whether the Government of Nepal’s housing grant sufficiently covered the costs of rebuilding homes. Using data from 680 rural households across nine earthquake-affected districts, the study applies econometric models to generate evidence-based insights. The results show that characteristics like the household head’s gender, marital status, and caste significantly influence recovery. Although migration, remittances, and borrowing offered limited support, strong ties with locally elected officials played a crucial role in asset restoration. The COVID-19 pandemic disrupted recovery efforts, and the analysis revealed a U-shaped convergence pattern in asset recovery. Importantly, the housing grant covered only about half of the reconstruction cost. These findings highlight the need for customized recovery strategies and robust disaster risk reduction policies to restore livelihoods and enhance resilience.
1. Introduction
Following the onset of natural disasters, such as earthquakes, household holdings of productive assets are typically disrupted. This is particularly seen in developing countries where insurance and financial markets are underdeveloped. These asset shocks affect long-term consumption stability, prompting households to adopt asset management strategies: accumulate assets during good times and draw them down during crises 1. Protecting poorer households with limited assets becomes critical, as selling them can risk future consumption and deepen poverty 2,3. This concern explains why many households opt for smoothing assets over consumption 4, a pattern supported by various studies 1,5,6. Moreover, the concept of asset-based poverty emerged in the literature, arguing that traditional poverty measures based on income or expenditure often overlook the structural aspects of poverty tied to asset loss, accumulation, and returns 7. Therefore, understanding the asset recovery dynamics is crucial for assessing whether households can withstand uninsured consumption shocks following disasters.
On April 25, 2015, a powerful earthquake with a magnitude of 7.8 struck Nepal, affecting nearly one-third of the country’s population and causing 8,790 deaths, 22,300 injuries, and an estimated $7 billion in damage and losses 8. Of the 39 hilly districts, 31 were severely affected, resulting in the widespread disruption of assets and livelihoods and profound socioeconomic consequences 9. The World Bank’s post-disaster needs assessment (PDNA) projected that the earthquake would increase poverty by 2.5%–3.5% in FY 2015–16, pushing an additional 700,000 people below the poverty line. The disaster destroyed important productive assets essential for sustaining consumption, leaving households with limited options for asset recovery and exacerbating their economic vulnerability.
Given Nepal’s heavy dependence on agriculture, the 2015 earthquake severely undermined the sector’s capacity to support household consumption. In FY 2014/15, agricultural growth was limited to just 1.7%, reflecting significant losses in farm infrastructure, including irrigation systems, as well as key household productive assets such as land, crops, livestock, and machinery 10,11. Despite this damage, the Government of Nepal’s Post-Disaster Recovery Framework (2016–2020) largely overlooked the recovery of such assets, prioritizing housing reconstruction grants and residential land acquisition instead 12. Although the framework acknowledges economic revitalization through support for micro-industries and skill development, there is limited evidence that meaningful efforts have been made in this direction. Assessing whether households have recovered these crucial assets over time is therefore crucial, given their importance for sustaining long-term consumption.
In this context, this study examines the key determinants of household asset recovery and evaluates the effectiveness of different asset protection strategies. Using self-reported recovery status as the dependent variable, it identifies the household characteristics and contextual factors that significantly influence recovery outcomes. In addition, asset recovery is assessed based on asset value using the framework developed by Carter et al. 13, which traces the asset accumulation trajectory and determines whether poor households with low pre-disaster asset levels follow a convergent recovery path. This study also investigates the long-term effects of asset protection strategies, including remittances, borrowing, and political connections, on recovery. Finally, it evaluates the impact of the housing grant disbursed by the Government of Nepal through the National Reconstruction Authority (NRA) on household recovery.
2. Review of Literature
Empirical studies examining the long-term recovery of productive household assets following natural disasters, particularly in the context of earthquakes, remain limited. Using the asset-based poverty trap framework developed by Carter and Barrett 7 for household-level panel data, Carter et al. 13 analyzed the aftermath of droughts and hurricanes in Ethiopia and Honduras, revealing that while wealthier households could partially restore lost assets within three years, poorer households faced an asset-based poverty trap due to limited access to recovery resources. Their findings highlight the critical role played by factor markets in facilitating asset recovery. Using a similar framework on household-level panel data, Giesbert and Schindler 14 found evidence of poverty traps among drought-affected households in postwar Mozambique, although those with labor market access and the ability to utilize unproductive assets were better positioned to preserve their productive asset bases.
In the broader South Asian context, borrowing has been identified as a key short-term coping strategy, particularly for food security, as demonstrated by Del Ninno et al. 15 and Khandker 16 in their analyses of the 1998 floods in Bangladesh. Their descriptive and econometric impact analyses highlighted the importance of microcredit and well-functioning markets in mitigating the impact of disasters. Quisumbing and Baulch 17 also found limited evidence of poverty traps among flood-affected Bangladeshi households using an asset-based poverty trap framework with household-level panel data, attributing resilience to the availability of factor markets. These findings suggest that poor households often struggle to rebuild their productive assets, particularly where financial systems are underdeveloped and institutions are weak. These findings are particularly relevant in economies such as Nepal, where underdeveloped financial systems often push households toward burdensome informal borrowing.
Limited research in South Asia has examined how political connections shape access to preferential treatment in disaster aid distribution, as well as their role in the recovery of important household assets essential to livelihoods. Gunawardena and Baland 18 studied post-tsunami aid in Sri Lanka, focusing on whether compensation efforts for lost boats and houses among fishing households restored pre-disaster asset levels. Their results indicated that, while housing aid was fairly distributed, boat allocations were uneven and likely skewed by local political ties favoring specific groups. Similarly, De Mel et al. 19 evaluated business recovery in Sri Lanka by examining changes in profit levels and found that constrained access to capital hindered effective recovery. In Nepal, Bhusal et al. 20 linked political affiliation to access to post-earthquake housing grants, revealing that elite clans/castes, those affiliated with the mayor’s group, and politically connected non-elites were more likely to benefit from government aid.
This study differs from previous studies on political connections in two ways. First, it examines whether public aid, both for house reconstruction and general aid, facilitates the household recovery of lost productive assets. Because neither type of aid explicitly targets the rebuilding of productive assets, it is important to ascertain whether households can reallocate their available resources toward asset recovery by leveraging the aid they receive. Additionally, it investigates whether housing reconstruction aid provided by the NRA has helped households rebuild their houses, thereby providing valuable insights into the effectiveness of this large institutional setup in addressing housing reconstruction needs in post-earthquake Nepal. Second, it extends the findings of Bhusal et al. 20 by evaluating the importance of political connections during the recovery of productive assets.
This study also extends prior research by incorporating additional variables such as private transfers, which are significant in the South Asian context for sustaining physical and human capital during the post-disaster period. In addition, it evaluates both asset growth and households’ self-reported recovery status, and includes asset convergence analysis to determine whether households eventually return to pre-disaster equilibrium or fall into a cycle of persistent underdevelopment. While convergence analysis offers valuable insights, it is subject to limitations, such as recall bias and inaccuracies in the self-assessment reporting of asset levels, a concern which is raised in previous studies, including Carter et al. 13. Nonetheless, this study applies convergence analysis to understand long-term asset recovery patterns.
| Sampling clusters | District number | Name of districts | NEQS I | NEQS II | ||
| No. of PSU | No. of original samples (NEQS I) | No. of PSU selected (NEQS II) | No. of selected samples (NEQS II) | |||
| Cluster I (160) | 1 | Dhading | 9 | 180 | 5 | 100 |
| 2 | Gorkha | 5 | 100 | 3 | 60 | |
| Cluster II (100) | 3 | Dolakha | 6 | 120 | 3 | 60 |
| 4 | Ramechaap | 5 | 100 | 2 | 40 | |
| Cluster III (220) | 5 | Kavre | 14 | 280 | 7 | 140 |
| 6 | Sindhupalchok | 9 | 180 | 4 | 80 | |
| Cluster IV (200) | 7 | Lalitpur | 6 | 120 | 3 | 60 |
| 8 | Makwanpur | 7 | 140 | 4 | 80 | |
| 9 | Nuwakot | 7 | 140 | 3 | 60 | |
| Total households sampled for interview | 68 | 1360 | 34 | 680 | ||
| Total households interviewed (after attrition rate of 9%) | 611 | |||||
Note: The names of selected PSUs are given in Appendix A.2.
Source: Based on NEQS I sampling design.
3. Data and Methods
This study draws on data from the Nepal Earthquake Survey II (NEQS II), conducted in February–March 2021, which builds on the Nepal Earthquake Survey I (NEQS I) carried out by the Central Department of Population Studies (CDPS) at Tribhuvan University in late 2015 21. NEQS I employed a two-stage stratified random sampling method across Nepal’s 14 most affected districts, categorized by the Government of Nepal’s PDNA classification into “severely hit,” “crisis hit,” and other levels of impact. A total of 3000 households (1360 rural and 1640 urban) were surveyed in 50 primary sampling units (PSUs).(1) For NEQS II, 50% of rural households (680 households) from nine selected districts were randomly sampled, focusing on rural areas where livelihoods depend heavily on productive assets (see Table 1 and Appendix A.1). The survey assessed household conditions related to damage, rescue, relief, and rehabilitation, as well as broader impacts on socio-demographic, employment, livelihoods, education, health, and mobility. It also placed particular emphasis on quantifying asset damage in both unit and monetary terms, thus offering a measure of post-earthquake asset losses.
This study uses NEQS II data to address all research questions, with a particular focus on analyzing the recovery trajectory of productive assets and evaluating the effectiveness of asset protection strategies. The survey gathers detailed information on households’ socioeconomic and demographic profiles and their current status of productive asset recovery. Data on the number of recovered assets (where applicable) and their estimated values were also collected. However, recognizing that many households struggled to accurately assess the current value of their assets, the survey also included self-assessments, asking respondents to classify their recovery status as completely recovered, partially recovered, or not recovered.
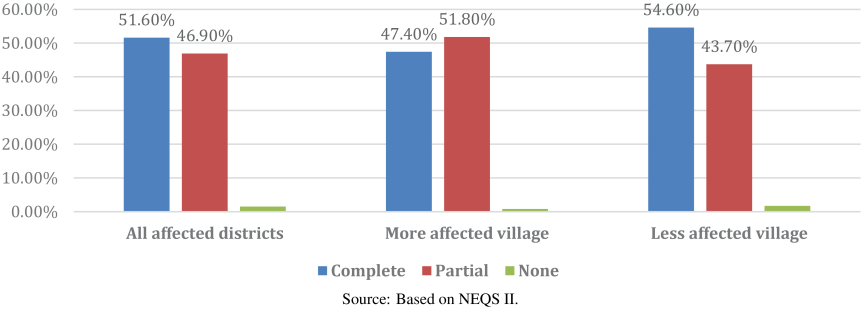
Fig. 1. Self-reported recovery status of productive assets.
As illustrated in Fig. 1, the survey found that 51.6% of households reported complete recovery, 46.9% reported partial recovery, and 1.5% reported no recovery. Notably, 47.4% of households in more severely affected villages reported complete recovery compared to 54.6% in less severely affected villages. Similarly, 51.8% of the highly affected areas reported partial recovery compared to 43.7% in the less affected areas. Given that most households answered this question without difficulty, self-reported recovery status, measured on an ordinal scale, was included in the baseline econometric model to identify the most effective asset protection strategies during the recovery process. An additional advantage of using self-assessed recovery is that it captures not only quantitative changes in assets but also households’ satisfaction with their overall recovery. Nonetheless, we also present recovery outcomes based on changes in asset values between the pre- and post-earthquake periods, as recorded in NEQS II.
3.1. Sampling Design
As previously discussed, NEQS II involved the resampling of rural households originally surveyed in NEQS I. From the 68 rural PSUs across nine districts in the initial design, 50% (or 34 PSUs) were randomly selected, ensuring proportionate representation from each district (see Appendix A.2). As 20 households were surveyed per PSU, the target sample comprised 680 households. All households within the selected PSUs were revisited; however, only 618 were located, reflecting an attrition rate of 9%. For the analysis, data from 571 households were used to address the first research question, and data from 590 households were used to address the second question due to missing information on one or more relevant variables.
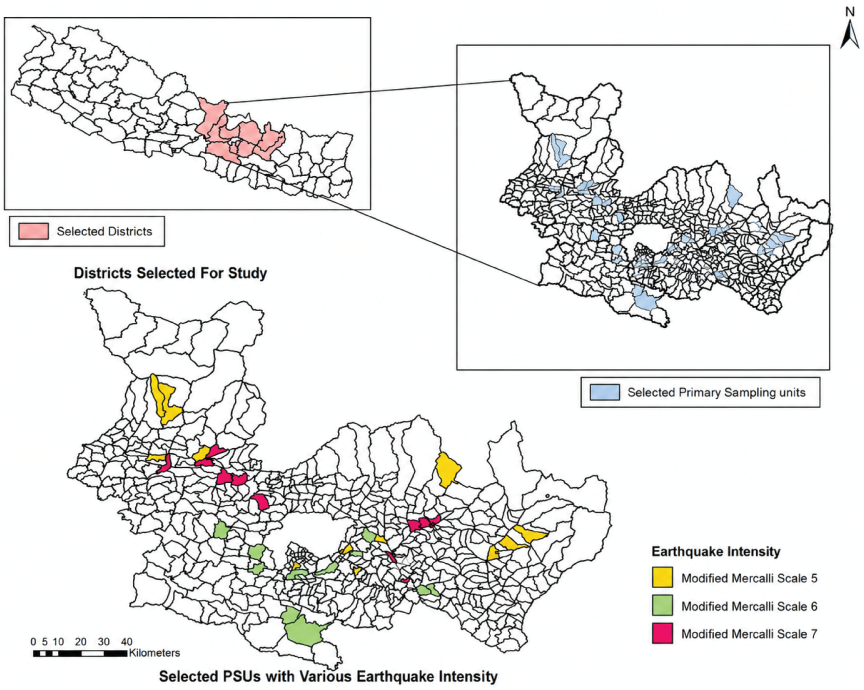
Fig. 2. Sampled PSUs with various earthquake intensities.
3.2. Earthquake Data
This study employs village-level seismic intensity data from the National Society of Earthquake Technology-Nepal (NSET-N) on a Modified Mercalli (MM) scale, which ranges from five to nine for the 2015 earthquake in Nepal 22. Based on the classifications used by Paudel and Ryu 23, Chaulagain et al. 24, and Raut 25, villages with an MM scale of seven or higher are defined as treatment (highly affected) villages, while those with an MM scale below seven are considered control (less affected) villages. This variation in earthquake intensity across villages is leveraged to assess its impact on key outcome variables (Fig. 2). For instance, among the five sampled villages in the Dhading district, three experienced intensity 7, one experienced intensity 6, and one recorded intensity 5 (see Appendix A.3).
3.3. Empirical Strategy
The empirical strategy used in this study helps us understand the determinants of the asset recovery process and explores the asset protection strategies that helped households during the process. An ordered probit model is used to account for the ordinal nature of the dependent variable. The empirical strategy is as follows:
In Eq. (1), \(Y_{hj}\) is the categorical variable representing whether household \(h\) in district \(j\) self-reported fully recovered (\(=1\)), partially recovered (\(=2\)), or not recovered (\(=3\)). \(\textit{EQ}_v\) is the earthquake intensity measured at the village level on an MM scale. The coefficient \(\beta_0\) is the intercept term, which gives the value of \(Y_{hj}\) when the variables on the right-hand side of Eq. (1) take the value of zero. Likewise, \(\beta_1\), \(\beta_2\), \(\beta_3\), \(\beta_4\), and \(\beta_5\) are the coefficients of variables on the right-hand side. The estimates of these coefficients can be interpreted as the change in \(Y_{hj}\) resulting from a one-unit change in the respective variable on the right-hand side. We use a continuous measure of earthquake intensity. \(S_{1hj}\) is the asset protection strategy adopted by the household. The coefficient of the interaction term \(\textit{EQ}_v\ast S_{1hj}\) indicates whether a particular asset protection strategy helped households recover lost assets. If \(\beta_3>0\), this indicates that the coping strategy is helpful for the recovery of household assets. \(X_{hj}\) is a vector of the household head characteristics, including age, age squared, sex, ethnicity, education, and marital status. It also includes the household’s distance from the district headquarters. This distinction is important because it reflects the opportunity costs embedded in the recovery process. For instance, a greater distance from district headquarters can increase transaction costs by making it more challenging to access nonfarm employment, obtain nonlocal materials essential for asset reconstruction, and establish the political and social connections necessary to secure public and private transfers. \(\textit{SH}_{hj}\) is a vector of adverse shocks experienced by the household that may delay the household recovery process. These shocks are discussed in the succeeding paragraph. \(d_j\) is a district fixed effect that captures unobserved heterogeneity at the district level. In particular, this entails local topography, the pre-earthquake status of poverty and inequality, the quality of infrastructure, and traditions and customs that generally do not change over time. \(\varepsilon_{hj}\) is a random error term clustered at the village level.
The regression model incorporates several types of shocks to account for the factors influencing recovery outcomes. First, asset shock is measured by the value of lost productive household assets. Second, income shock is modeled as a dummy variable for households that reported a decline in consumption after the earthquake. Third, housing shock is captured by the estimated value of housing damage. Finally, health shock is represented by a dummy for households whose employment was affected by the COVID-19 pandemic, recognizing that the pandemic may have hindered asset recovery, particularly between 2020 and 2021. While these shock variables may be correlated with each other and earthquake intensity, pairwise correlation tests indicate that multicollinearity is not a concern (results available upon request).
We estimate seven different model specifications to examine the effectiveness of various asset protection strategies. These strategies include public (non-house) aid and materials, public aid for house reconstruction (NRA receipt), migration, remittances, increased labor supply, borrowing, and political connections. Political connections are captured in two forms: first, whether the household head knows someone in the central or local government, and second, whether the household has a friend or relative serving as a locally elected representative. This distinction matters because the former reflects a general connection to officials, while the latter implies a closer and more influential relationship within the community, which may enhance access to public and even unsolicited aid. We present the marginal effects of the coefficient estimates for ease of interpretation. Marginal effects make the interpretation of the coefficients convenient by expressing the changes in the outcome category (say, \({Y_{hj}=1}\)) in probability terms, owing to the small change in an independent variable included on the right-hand side of Eq. (1).
As mentioned, we follow the empirical approach suggested by Carter et al. 13 to identify the convergence pattern, which is explained in detail in Appendix B. To test the effectiveness of the NRA housing grant, we use a specification similar to that in Eq. (1), except that the dependent variable is the log of the value of damaged houses and \(S_{1hj}\) is the dummy for the receipt of the NRA housing grant. \(\textit{SH}_{hj}\) controls only for health shocks.
4. Results and Discussion
4.1. Descriptive Statistics
Table 2 summarizes the key dependent and independent variables used in the study. The self-reported recovery status shows that 47.4% of households in highly affected areas reported complete recovery compared to 54.6% in less-affected areas, whereas partial recovery was higher in highly affected areas (51.8% vs. 43.7%). These differences are statistically significant, indicating relatively satisfactory recovery perceptions, although full recovery remained lower in the more affected regions. Shock-related variables reveal greater damage in highly affected areas with both asset and housing shocks, although only the difference in productive asset loss is statistically significant. Income shock, captured by a decline in consumption, is nearly twice as high in highly affected areas and is statistically significant, suggesting that asset and income shocks were more severe than housing-related damage. Interestingly, the health shock was greater in the less-affected regions, implying that the pandemic had a relatively smaller impact on earthquake-affected zones.
| Highly affected area | Less affected area | Difference | |
| Complete recovery \(=1\) | 0.474 | 0.546 | \(-\)0.072\(^*\) |
| Partial recovery (self-reported) \(=1\) | 0.518 | 0.437 | 0.081\(^{**}\) |
| No recovery (self-reported) \(=1\) | 0.08 | 0.017 | 0.009 |
| Asset shock (log value of productive assets damaged) | 7.79 | 5.29 | 2.50\(^{***}\) |
| House shock (log value of house damaged) | 13.10 | 12.985 | 0.117 |
| Income shock (\(=1\)) (\(=\) whether consumption declined) | 0.647 | 0.357 | 0.290\(^{***}\) |
| Health shock (\(=1\)) | 0.512 | 0.573 | \(-\)0.061 |
| Age of household head | 55.26 | 55.00 | 0.260 |
| Age of household squared | 3256.80 | 3204.73 | 52.07 |
| Gender of household head | 0.831 | 0.802 | 0.029 |
| No education | 0.379 | 0.373 | 0.006 |
| Less than primary (\(=1\)) | 0.286 | 0.270 | 0.016 |
| Primary completed (\(=1\)) | 0.143 | 0.167 | \(-\)0.024 |
| Secondary completed (\(=1\)) | 0.098 | 0.103 | \(-\)0.005 |
| Greater than secondary (\(=1\)) | 0.094 | 0.086 | 0.008 |
| Brahmin and Chettri (\(=1\)) | 0.314 | 0.466 | \(-\)0.152\(^{***}\) |
| Hill Adibasi and Janajati (\(=1\)) | 0.640 | 0.446 | \(-\)0.195\(^{***}\) |
| Hill Dalit (\(=1\)) | 0.045 | 0.088 | \(-\)0.044\(^{**}\) |
| Agriculture (\(=1\)) | 0.616 | 0.548 | 0.067 |
| Non-agriculture (\(=1\)) | 0.163 | 0.188 | \(-\)0.025 |
| Salaried workers | 0.061 | 0.060 | \(-\)0.001 |
| Foreign worker (\(=1\)) | 0.016 | 0.003 | \(-\)0.013\(^*\) |
| Others (\(=1\)) | 0.143 | 0.200 | \(-\)0.057\(^*\) |
| Married household (\(=1\)) | 0.841 | 0.860 | \(-\)0.019 |
| Distance to district headquarters [km] | 47.07 | 40.60 | 6.47\(^{***}\) |
| Aid received (\(=1\)) | 0.923 | 0.820 | 0.103\(^{***}\) |
| NRA housing grant received (\(=1\)) | 0.947 | 0.897 | 0.050\(^{**}\) |
| Migrant (\(=1\)) | 0.147 | 0.148 | \(-\)0.001 |
| Remittance receipt (\(=1\)) | 0.198 | 0.180 | 0.02 |
| Increase in labor supply (\(=1\)) | 0.380 | 0.380 | 0.00 |
| Borrowing (\(=1\)) | 0.692 | 0.717 | \(-\)0.025 |
| Know someone in the local or central government (\(=1\)) | 0.287 | 0.233 | 0.054 |
| Elected representative is a friend or relative (\(=1\)) | 0.227 | 0.200 | 0.027 |
| Observations | 251 | 365 |
Note: Highly affected areas are villages with an MM scale of at least 7, and less-affected areas are villages with an MM scale of less than 7. Robust standard errors are indicated in parentheses. *** \(p<0.01\), ** \(p<0.05\), and * \(p<0.1\).
Regarding other independent variables, there is a slight variation between the highly- and less-affected areas in terms of the household head’s age, gender, education, and marital status. The average age is approximately 55 years, 80% to 83% are male, approximately 19% have completed at least a secondary education, and nearly 85% are married. However, the caste composition shows notable differences. The majority of households in highly affected areas belong to indigenous groups (Hill Adibasi and Janajati; 64% vs. 45%), whereas Brahmin and Chettri households are more common in less-affected areas (46.6% vs. 31.4%). Similarly, Dalit households are more concentrated in less-affected areas (8.8% vs. 4.5%). These figures suggest that the Hill Indigenous communities were disproportionately affected by the earthquake. In terms of occupation, more households in the highly affected areas were engaged in agriculture (61.6% vs. 54.8%). In contrast, non-agricultural employment is more prevalent in less-affected areas (18.8% vs. 16.3%).
Regarding asset protection strategies, most households received non-household aid or relief materials, with a higher share in highly affected areas (92.3% vs. 82%). Housing aid from the NRA (Government of Nepal) was reported by 95% of the households in highly affected areas and 90% of the households in less affected areas, suggesting a reasonably equitable distribution across the impact levels. The number of migrants was similar across areas, while remittance receipt was slightly higher in highly affected areas (19.8% vs. 18%), although this difference was not statistically significant. The increases in labor supply were comparable between the two groups (38%). Interestingly, borrowing was marginally higher in the less-affected areas (69.2% vs. 71.7%). Political connection indicators—knowing someone in the local or central government and having a friend or relative as an elected representative—were more common in highly affected areas; however, the differences were not statistically significant.
In the following section, we conduct a regression analysis to confirm the results of the descriptive statistics.
4.2. Determinants of Assets Recovery
Table 3 presents the determinants of asset recovery from Eq. (1). The first, second, and third columns report the determinants of complete recovery, partial recovery, and no recovery, respectively.
| Complete recovery (\(\boldsymbol{=1}\)) | Partial recovery (\(\boldsymbol{=2}\)) | No recovery (\(\boldsymbol{=3}\)) | |
| Household head characteristics | |||
| Age | \(-\)0.001 (0.007) | 0.001 (0.007) | 0.0001 (0.0006) |
| Age squared | \(-\)0.00002 (0.00006) | 0.00002 (0.00006) | 1.96e\(-\)06 (5.46e\(-\)06) |
| Male (\(=1\)) | 0.115\(^{*}\) (0.068) | \(-\)0.105\(^{*}\) (0.063) | \(-\)0.009 (0.006) |
| Married (\(=1\)) | \(-\)0.105\(^{*}\) (0.061) | 0.096\(^{*}\) (0.057) | 0.009 (0.006) |
| No education | 0.017 (0.079) | \(-\)0.016 (0.072) | \(-\)0.001 (0.007) |
| Less than primary | 0.030 (0.073) | \(-\)0.028 (0.066) | \(-\)0.003 (0.006) |
| Primary completed | \(-\)0.040 (0.083) | 0.036 (0.075) | 0.004 (0.009) |
| Secondary completed | 0.135 (0.092) | \(-\)0.126 (0.086) | \(-\)0.009 (0.007) |
| Hill Adibasi and Janajati | \(-\)0.027 (0.057) | 0.025 (0.053) | 0.002 (0.004) |
| Hill Dalit | \(-\)0.157\(^{**}\) (0.074) | 0.138\(^{**}\)(0.064) | 0.018 (0.013) |
| Agriculture | 0.002 (0.089) | \(-\)0.002 (0.081) | \(-\)0.0002 (0.009) |
| Non-agriculture | 0.024 (0.101) | \(-\)0.021(0.092) | \(-\)0.002 (0.009) |
| Foreign labor | 0.075 (0.286) | \(-\)0.069 (0.267) | \(-\)0.006 (0.019) |
| Other occupation | 0.116 (0.081) | \(-\)0.108 (0.075) | \(-\)0.008 (0.007) |
| Shock-related variables | |||
| Assets shock | \(-\)0.009\(^{*}\) (0.006) | 0.009\(^{*}\) (0.005) | 0.0008 (0.0005) |
| Income shock | \(-\)0.021 (0.065) | 0.019 (0.059) | 0.002 (0.005) |
| House shock | \(-\)0.054\(^{**}\) (0.024) | 0.049\(^{**}\) (0.022) | 0.005\(^{*}\) (0.002) |
| Job affected by COVID-19 (\(=1\)) | \(-\)0.192\(^{***}\) (0.048) | 0.175\(^{***}\) (0.042) | 0.016\(^{**}\) (0.008) |
| Location characteristics | |||
| Distance to district headquarters | \(-\)0.003\(^{**}\) (0.001) | 0.003\(^{**}\) (0.001) | 0.0002 (0.0002) |
| District fixed effects | Yes | Yes | Yes |
| Number of observations | 576 | 576 | 576 |
Note: The marginal effects of the ordinal logit models are reported. * Significant at 10% level; ** significant at 5% level; and *** significant at 1% level. The standard errors are reported in parentheses.
The results show that the age and education of the household head do not play a significant role in the asset recovery status. In general, occupation is also not significantly associated with recovery. Likewise, income shock shows no significant effect on the recovery process. In addition, the distance from the household to district headquarters plays a significant role during the recovery process.
Male-headed households are more likely to report complete recovery, suggesting that female-headed households face greater challenges in restoring lost assets, possibly because of the added burden of household responsibilities in the absence of male support. In low-income male-dominated societies, women are often confined to unpaid domestic work, limiting their access to paid employment that could aid recovery. Even when engaged in wage labor, women tend to earn less, making it more difficult to rebuild productive assets. Moreover, the analysis shows that an increase in labor supply was not significantly helpful in the recovery process. Regarding marital status, households headed by married individuals are more likely to report partial recovery, suggesting that marriage may serve as an informal insurance, enabling resource pooling and faster recovery. In terms of caste, Hill Dalits appear more vulnerable and are more likely to report partial rather than complete recovery compared to Brahmin and Chettri households. This is likely due to limited resources, low educational attainment, and dependence on subsistence farming. Similarly, the Hill Adibasi Janajati households show a lower likelihood of complete recovery and a higher probability of partial recovery.
Let us now discuss the effects of various shocks on recovery. Asset shock is found to be negatively associated with complete recovery, which is statistically significant at the 10% level. This implies that households suffering greater losses in productive assets faced more difficulty in achieving full recovery. This is expected because larger damages require more resources to recover, thereby increasing financial stress. On average, households lost productive assets worth Nepalese rupees (NPR) 66,245 (USD 646 at 2015 prices),(2) which accounts for nearly 73.21% of GDP per capita, highlighting the substantial burden placed on already resource-constrained households and the importance of asset protection measures. Similarly, house shock negatively affects recovery, with a stronger and statistically significant (at the 5% level) impact on the likelihood of reporting a complete recovery. The average house damage was valued at NPR 712,237.8 (USD 6,949), nearly ten times the loss of productive assets, indicating the magnitude of the financial strain caused by structural damage. While this study does not focus on the house recovery process itself, it acknowledges that the NRA was the leading agency providing government housing grants, NPR 300,000 (USD 2,930) per household, depending on the level of damage, and that its effectiveness will be addressed separately.
The study also examines whether the COVID-19 pandemic disrupted the asset recovery process and finds that it had a significantly negative impact, even greater than the effects of asset and housing shocks. The estimated coefficient for complete recovery is negative and has a magnitude of 19.2%, indicating that households whose jobs were affected by the pandemic were substantially less likely to report complete recovery. Approximately 55% of surveyed households reported pandemic-related job disruptions. This aligns with findings from the Housing Recovery and Reconstruction Platform 26, which noted that shortages of construction materials, skilled labor, and masons delayed house reconstruction by three to six months. Similarly, Neupane and Mishra 27 and The Asia Foundation 28 found that many laborers, including masons from other districts or India, could not return after the pandemic began, leading to delays. These shortages also impeded the recovery of productive assets, as local markets for essential materials and labor were essentially non-functional. Moreover, the pandemic led to layoffs, wage cuts, and reduced working hours 29,30, compounding the challenges households faced. In addition, the distance to the district headquarters is negatively associated with complete recovery. Proximity to headquarters enhances access to markets and materials and facilitates social and political connections, which are important channels for mobilizing aid and support. The next section explores how political connections support recovery.
4.3. Evaluation of Asset Protection Strategies
This study considers eight major asset-protection strategies: aid and relief (non-house); house reconstruction aid (NRA receipt); migration; remittances; increases in labor supply; borrowing; and political connections (both general and close acquaintances). Table 4 shows that nearly half of the strategies could help households recover their productive assets, either partially or completely. Having migrants, receiving remittances, and borrowing contributed to partial recovery, whereas close acquaintance with a locally elected representative contributed to complete recovery. This result has important academic and policy implications, which are discussed in the following paragraphs.
| Asset protection strategies | Recovery (self-reported) | ||
| Complete (\(=1\)) | Partial (\(=2\)) | None (\(=3\)) | |
| Aid and relief | \(-\)0.0137 (0.096) | 0.0137 (0.096) | Not reported |
| NRA receipt | 0.112 (0.074) | \(-\)0.103 (0.067) | \(-\)0.009 (0.007) |
| Migrant | \(-\)0.173\(^{**}\) (0.067) | 0.158\(^{***}\) (0.062) | 0.015\(^{*}\) (0.008) |
| Receives remittance | \(-\)0.129\(^{**}\) (0.055) | 0.118\(^{**}\) (0.050) | 0.011\(^{*}\) (0.006) |
| Supply of labor | \(-\)0.055 (0.055) | 0.050 (0.050) | 0.004 (0.005) |
| Borrowing | \(-\)0.110\(^{**}\) (0.053) | 0.102\(^{**}\) (0.048) | 0.008 (0.006) |
| Know someone in the local or central government (general acquaintance) | 0.064 (0.067) | \(-\)0.059 (0.062) | \(-\)0.005 (0.005) |
| Locally elected representative, friend, or relative (close acquaintance) | 0.094\(^{**}\) (0.047) | \(-\)0.086\(^{**}\) (0.042) | \(-\)0.008 (0.006) |
Note: All coefficients reported are the interactions between earthquake intensity and the respective asset protection strategies. The marginal effects of the ordered probit model are reported. The equation controls for other household-level variables, such as age, age squared, gender, caste, education, occupation, and marital status of the household head. The equations also control for the various types of shocks defined above, such as asset, income, housing, and health shocks. Furthermore, the distance to the district headquarters and district fixed effects are controlled. The standard errors in parentheses are clustered at the village level. *** \(p<0.01\), ** \(p<0.05\), and * \(p<0.1\).
The study finds that aid and relief, whether in cash or in kind, did not significantly help households recover their productive assets. While the government was the primary provider of aid, complemented by various non-governmental organizations, the total cash assistance of NPR 25,000 (USD 234)—which included NPR 15,000 for temporary shelters in 2015 and NPR 10,000 as winter relief in early 2016—was insufficient to address broader recovery needs. This limited amount was mainly intended for immediate shelter rather than asset restoration. Moreover, concerns about inequitable distribution may have further reduced the effectiveness of the aid 31. Similarly, the housing grants provided by the NRA were allocated explicitly for permanent house reconstruction and disbursed in three tranches based on construction progress. These strict disbursement conditions made it difficult for households to divert the funds toward consumption or the recovery of productive assets, limiting the broader utility of this support in the recovery process.
Migration and remittances played a significant role in helping households partially restore their productive assets. Previous studies have shown that remittances often act as a coping mechanism during economic crises and post-disaster periods 32,33. In Nepal, both micro- and macro-level evidence indicates an increase in remittance flows following the 2015 earthquake 34,35, with several studies highlighting their positive impact on the livelihoods and asset recovery of affected households 25,36,37,38. Although the descriptive statistics in this study show no significant difference in remittance receipt between the high- and less-affected households (Table 1), the regression results based on Eq. (1) confirm that households with migrants and remittances were more likely to partially recover. It is possible that migrant workers extended their contracts or increased remittance flows to support reconstruction and asset restoration. Remittances, therefore, helped ease liquidity constraints, allowing households to not only smooth consumption but also invest in rebuilding their productive assets.
Borrowing played an important role in supporting the partial recovery of productive household assets. This became a common coping mechanism among affected households, mainly because the aid and non-house relief distributed were insufficient to meet their needs. Although access to formal and informal borrowing is often constrained in the immediate aftermath of disasters, especially in the rural areas of developing countries where financial institutions are limited and hesitant to lend against distressed assets 25, these barriers eased somewhat after the government introduced housing grants and concessional loans in 2017. However, the uptake of government loans remained low owing to bureaucratic delays and cumbersome procedures 39. According to The Asia Foundation 28, most borrowing occurred through cooperatives, savings groups, and social networks such as friends and relatives, which offered more favorable terms than traditional moneylenders, whose involvement remained minimal. Further evidence from a study by Dhakal et al. 40 highlights that access to finance, particularly microcredit, helped recipient households mobilize resources more effectively than non-recipients, thereby restoring their livelihoods by increasing employment and income. These findings underscore why borrowing was moderately successful in enabling households to recover lost productive assets.
Interestingly, this study found strong evidence that close acquaintances with locally elected representatives significantly increase the likelihood of complete recovery among affected households. The regression results show a positive and statistically significant association between political connections and complete recovery, suggesting that households with friends or relatives in elected local offices had better access to the resources required for rebuilding. This is particularly notable, given that other commonly observed strategies either failed to support recovery or offered only partial assistance. In contrast, no such benefit was observed for households that knew someone in the local or central government. This finding is consistent with that reported by Bhusal et al. 20 and Carter et al. 13, who also found that having a clan member in a position of local power, such as the mayoral office, conferred clear advantages in securing earthquake reconstruction grants. Therefore, it is not surprising that similar informal political ties extended access to other forms of aid and relief that helped restore productive assets.
It is worth reiterating that the sum of the marginal effects is zero in ordered probit models. For example, if the receipt of remittances increases the probability of partial recovery, it must decrease the probability of another category—in this case, complete recovery (Table 4). Hence, this finding can be explained as follows: receiving remittances reduces the probability of complete recovery but increases the probability of partial or no recovery. Thus, remittances may help people avoid total collapse (Category 3), but are not enough to achieve full recovery (Category 1). The other strategies’ marginal effects can be understood in a similar way.
4.4. Test of Convergence
We also test for asset convergence using the model suggested by Carter et al. 13. The model explores households’ asset recovery paths. Specifically, it assesses whether poor households with a low asset base pre-disaster follow a convergent accumulation process (see Appendix B for the model and its explanation). In other words, this study explores the underlying pattern of asset accumulation.
Table 5 shows the non-linear (U-shaped) relationship between the initial level of productive assets and their growth during the recovery period. In other words, the growth rate of pre-disaster low-wealth households first decreased and then increased. First, the coefficient is negative and significant at the initial level of productive assets. This means that during the initial phase of recovery, growth in productive assets among pre-disaster low-wealth households decreased. This indicates a tradeoff between reallocating resources among productive and housing assets and maintaining consumption standards. Households may have prioritized consumption smoothing and rebuilding over the recovery of productive assets in the first few years after the earthquake. Second, as shown by the squared term of the same variable, which is significant and positive, growth became positive (for pre-shock low-wealth households) after experiencing negative growth for some time. These results show that the affected households in Nepal prioritized recovering productive assets, the primary source of rural livelihood, during the later phase of recovery (see Appendix B for a detailed interpretation of the coefficient in the model).
| Variables | Without assets, income, and house shock (1) | With assets, income, and house shock (2) | With health/COVID-19 shock (3) |
| Growth in productive assets | |||
| Initial level of productive assets | \(-\)1.429\(^{**}\) (0.627) | \(-\)1.676\(^{**}\) (0.773) | \(-\)1.689\(^{**}\) (0.803) |
| Initial level of productive assets squared | 0.0597\(^{**}\) (0.0254) | 0.0696\(^{**}\) (0.0311) | 0.0703\(^{**}\) (0.0324) |
| Observations | 570 | 570 | 559 |
| \(R^2\) | 0.105 | 0.120 | 0.120 |
Note: The dependent variable is the growth of productive assets. This is the growth rate of productive assets between the pre-shock levels and the recovery period (the time of the NEQS II survey). The main variables of interest are the value of productive assets at the pre-shock level (baseline) and the squared term. All specifications controlled for household head characteristics, including age, age squared, gender, level of education, marital status, occupation, and caste. The equations also control for the various types of shocks defined above, such as asset, income, housing, and health shocks. Furthermore, the distance to the district headquarters and district fixed effects are controlled. The standard errors in parentheses are clustered at the village level. *** \(p<0.01\), ** \(p<0.05\), and * \(p<0.1\).
4.5. Was the NRA Housing Grant Effective?
The main results in Table 4 reveal that the NRA housing grant was ineffective in restoring productive assets, likely because it was allocated specifically for housing reconstruction. Given this, the analysis further investigates whether the NRA grant was effective in rebuilding damaged houses, thereby validating the dependent variable, self-reported recovery, as a true indicator of recovery of productive assets rather than house reconstruction. Notably, the NRA housing grant was earmarked for rebuilding damaged houses rather than for the recovery of productive assets. As shown in Table 6, the NRA grant helped mitigate housing losses in the highly affected areas. The interaction coefficient between earthquake intensity and NRA receipt is negative and statistically significant at the 1% level, indicating that, on average, households receiving the NRA grant were able to cover 50 percentage points of the value of their damaged housing assets. This finding reinforces our earlier findings that the housing grant was ineffective in recovering productive assets, as it was used for house reconstruction.
The positive coefficients of earthquake intensity and NRA receipt shown in Table 6 are also intuitive. The positive sign of the earthquake intensity indicates that areas more severely impacted by the earthquake incurred greater damage. Similarly, the positive coefficient on NRA receipt suggests that the NRA concentrated its grant distribution in regions that suffered greater destruction, consistent with the intended targeting of assistance.
| Variables | Log of the value of the house damaged |
| Intensity | 0.409\(^{**}\) (0.132) |
| NRA receipt (\(=1\)) | 2.998\(^{***}\) (0.768) |
| Intensity * NRA receipt | \(-\)0.505\(^{***}\) (0.119) |
| Other household characteristics | Yes |
| District fixed effects | Yes |
| Constant | 0.774\(^*\) |
| Observations | 577 |
| \(R^2\) | 0.141 |
Note: ordinary latest squares estimates. The equation controls for other household-level factors, such as age, gender, caste, education, occupation, and marital status of the household head. The equations also control for health shock, that is, the dummy variable for whether households’ jobs were affected by COVID-19. Furthermore, the distance to the district headquarters and district fixed effects are controlled. Standard errors are clustered at the village level. *** \({p<0.01}\), ** \({p<0.05}\), and * \({p<0.1}\).
5. Conclusion
This study examines the asset recovery process of earthquake-affected rural households in Nepal and evaluates the effectiveness of various asset protection strategies. Based on a survey of 611 households across 34 PSUs in nine districts, this study employs an ordinal logit model to identify the key determinants of recovery. The findings reveal that male-headed households are more likely to achieve complete recovery, whereas those headed by married individuals tend toward partial recovery. However, Dalit households are less likely to recover fully. Recovery is further hindered by asset, house, and health shocks, as well as the COVID-19 pandemic, all of which significantly reduce the likelihood of complete recovery. An additional analysis of asset values indicates a U-shaped growth pattern during the recovery process. Although the NRA housing grant was ineffective in restoring productive assets, it successfully subsidized approximately 50% of the costs of house reconstruction. The study also finds that households receiving remittances, engaging in borrowing, or sending migrants were better positioned for partial recovery. More importantly, having a close acquaintance with an elected representative significantly increases the probability of complete asset recovery.
This study offers several important findings. First, it reinforces, albeit to a limited extent, the role of migration and remittances in enhancing household resilience in Nepal, particularly during disasters when public aid is often insufficient or poorly targeted. Second, although borrowing emerged as another key recovery strategy, its effectiveness is constrained by affordability and access, particularly for households with limited collateral. Most affected households relied on local sources, such as cooperatives, savings groups, friends, and relatives, while the uptake of government concessional loans remained low owing to delays and procedural hurdles. This finding suggests that early, accessible financial support leveraging local financial institutions is crucial. Third, close ties with elected representatives significantly aided recovery, yet such access is limited, reflecting deeper issues of inequality and political favoritism in disaster aid distribution. These findings align with prior research on the unequal and exclusionary nature of post-disaster assistance. Finally, despite its limitations, the NRA played a key role in housing recovery by helping households cover nearly half the cost of rebuilding—a notable achievement given the government’s fiscal constraints. Overall, the study’s findings indicate that recovery is shaped not only by economic capacity but also by structural inequality and access to political networks.
This study has some limitations. First, it does not use a change in asset value as a measure of recovery. This was primarily due to measurement errors from recall bias in the self-reported asset values. Second, the study’s findings could be more robust if the issue of selection bias in the adoption of a particular asset protection strategy were addressed. This is due to the challenges of implementing econometric methods that yield causal estimates, such as the need for instrumental variables and high-quality data. Future research on asset recovery can leverage better data and methods to enhance analysis of the recovery process.
Acknowledgments
This study was supported by a research grant from the South Asian Network for Development and Environment Economics (ICIMOD) in Nepal. We thank Sheetal Sekhri, Mani Nepal, Enamuel A. Haque, Heman Das Lohano, Pranab Mukhopadhyay, Naveen Adhikari, Khagendra Katuwal, Kapil Dhungana, Deependra Paudel, Rashmi Dhakal, Rabina Thapa, Anu Adhikari, Heymant Panthi, Swodesh Rijal, Ramesh Khanal, and Sabina Dhakal for their support in conducting the study. We also thank the conference participants at AAERE 2022 and HPRC 2021 for their feedback on an earlier version of this paper.
Footnotes
(1) PSUs are the initial units from which subsequent samples are drawn. In NEQS I, PSUs are the wards, the lowest administrative unit in Nepal. Nepal has three tiers of government: Federal, Provincial, and Local. The local government is further divided into rural and urban municipalities. Each municipality is divided into wards.
(2) This includes all houses in the survey. Average exchange rate in 2015 is used (USD 1 \(=102.49\)). GDP per capita in 2015 was USD 882.3 (https://data.worldbank.org/indicator/NY.GDP.PCAP.CD?locations=NP) [Accessed October 22, 2023]
- [1] M. R. Carter and T. J. Lybbert, “Consumption versus asset smoothing: Testing the implications of poverty trap theory in Burkina Faso,” J. Dev. Econ., Vol.99, Issue 2, pp. 255-264, 2012. https://doi.org/10.1016/j.jdeveco.2012.02.003
- [2] J. Corbett, “Famine and household coping strategies,” World Dev., Vol.16, No.9, pp. 1099-1112, 1988. https://doi.org/10.1016/0305-750X(88)90112-X
- [3] S. Devereux, “Goats before ploughs: Dilemmas of household response sequencing during food shortages,” IDS Bull., Vol.24, Issue 4, pp. 52-59. 1993. https://doi.org/10.1111/j.1759-5436.1993.mp24004006.x
- [4] J. Hoddinott, “Shocks and their consequences across and within households in rural Zimbabwe,” J. Dev. Stud., Vol.42, No.2, pp. 301-321, 2006. https://doi.org/10.1080/00220380500405501
- [5] J. Drèze and A. Sen, “Hunger and public action,” Clarendon Press, 1989. https://doi.org/10.1093/0198283652.001.0001
- [6] F. J. Zimmerman and M. R. Carter, “Asset smoothing, consumption smoothing and the reproduction of inequality under risk and subsistence constraints,” J. Dev. Econ., Vol.71, Issue 2, pp. 233-260, 2003. https://doi.org/10.1016/S0304-3878(03)00028-2
- [7] M. R. Carter and C. B. Barrett, “The economics of poverty traps and persistent poverty: An asset-based approach,” J. Dev. Stud., Vol.42, Issue 2, pp. 178-199, 2006. https://doi.org/10.1080/00220380500405261
- [8] National Planning Commission, Government of Nepal, “Nepal Earthquake 2015: Post disaster needs assessment, Volume A: Key findings,” 2015.
- [9] United Nations Office for the Coordination of Humanitarian Affairs, “Nepal earthquake humanitarian response April to September 2015,” 2015.
- [10] K. Epstein et al., “Recovery and adaptation after the 2015 Nepal earthquakes: A smallholder household perspective,” Ecol. Soc., Vol.23, No.1, Article No.29, 2018. https://doi.org/10.5751/ES-09909-230129
- [11] South Asia Watch on Trade, Economics and Environment, “Impact of Nepal’s earthquake on food security and livelihood of the urban poor,” Policy Brief, No.31, 2015.
- [12] National Reconstruction Authority, Government of Nepal, “Nepal Earthquake 2015: Post disaster recovery framework (2016–2020),” 2016.
- [13] M. R. Carter, P. D. Little, T. Mogues, and W. Negatu, “Poverty traps and natural disasters in Ethiopia and Honduras,” World Dev., Vol.35, No.5, pp. 835-856, 2007. https://doi.org/10.1016/j.worlddev.2006.09.010
- [14] L. Giesbert and K. Schindler, “Assets, shocks, and poverty traps in Rural Mozambique,” World Dev., Vol.40, No.8, pp. 1594-1609, 2012. https://doi.org/10.1016/j.worlddev.2012.04.002
- [15] C. Del. Ninno, P. A. Dorosh, and L. C. Smith, “Public policy, markets and household coping strategies in Bangladesh: Avoiding a food security crisis following the 1998 floods,” World Dev., Vol.31, No.7, pp. 1221-1238, 2003. https://doi.org/10.1016/S0305-750X(03)00071-8
- [16] S. R. Khandker, “Coping with flood: Role of institutions in Bangladesh,” Agric. Econ., Vol.36, Issue 2, pp. 169-180, 2007. https://doi.org/10.1111/j.1574-0862.2007.00196.x
- [17] A. R. Quisumbing and B. Baulch, “Assets and poverty traps in rural Bangladesh,” J. Dev. Stud., Vol.49, No.7, pp. 898-916, 2013. https://doi.org/10.1080/00220388.2013.785524
- [18] A. Gunawardena and J.-M. Baland, “Targeting disaster aid in post-tsunami Sri Lanka,” Dev. Policy Rev., Vol.34, Issue 2, pp. 179-195, 2016. https://doi.org/10.1111/dpr.12148
- [19] S. De Mel, D. McKenzie, and C. Woodruff, “Enterprise recovery following natural disasters,” Econ. J., Vol.122, Issue 559, pp. 64-91, 2012. https://doi.org/10.1111/j.1468-0297.2011.02475.x
- [20] B. Bhusal et al., “Does revolution work? Evidence from Nepal’s people’s war,” CEGA Working Paper No.116, University of California, Berkeley, 2020. https://doi.org/10.26085/C3S886
- [21] Ministry of Population and Environment, CDPS/TU, UNFPA & IoM, “Nepal Earthquake 2015: A socio-demographic impact study,” 2016. https://nepal.unfpa.org/sites/default/files/pub-pdf/Final%20Setting_0.pdf [Accessed September 28, 2026]
- [22] National Society for Earthquake Technology-Nepal,“Gorkha Earthquake 2015: Situation of Earthquake,” 2015. https://nset.org.np/disaster/gorkha-earthquake/ [Accessed September 28, 2026]
- [23] J. Paudel and H. Ryu, “Natural disasters and human capital: The case of Nepal’s earthquake,” World Dev., Vol.111, pp. 1-12, 2018. https://doi.org/10.1016/j.worlddev.2018.06.019
- [24] H. Chaulagain, D. Gautam, and H. Rodrigues, “Revisiting major historical earthquakes in Nepal: Overview of 1833, 1934, 1980, 1988, 2011, and 2015 seismic events,” D. Gautam and H. Rodrigues (Eds.), “Impacts and Insights of Gorkha Earthquake in Nepal,” pp. 1-17, Elsevier, 2018. https://doi.org/10.1016/B978-0-12-812808-4.00001-8
- [25] N. K. Raut, “An assessment of livelihood recovery status of earthquake-affected households in Nepal: A study of coping strategies and their effectiveness,” Prog. Disaster Sci., Vol.9, Article No.100147, 2021. https://doi.org/10.1016/j.pdisas.2021.100147
- [26] Housing Recovery and Reconstruction Platform, “Impact of COVID-19 on post-earthquake recovery and reconstruction,” 2020.
- [27] B. R. Neupane and A. K. Mishra, “Impact of COVID-19 on labor management; A case of reconstruction works at Bharatpur Metropolitan City, Nepal,” East Afr. Sch. J. Econ. Bus. Manag., Vol.3, Issue 10, pp. 789-794, 2020. https://doi.org/10.36349/easjebm.2020.v03i10.004
- [28] The Asia Foundation, “Aid and recovery in post-earthquake Nepal,” 2019.
- [29] L. Hoehn-Velasco, A Silverio-Murillo, J. R. Balmori de la Miyar, and J. Penglase, “The impact of the COVID-19 recession on Mexican households: Evidence from employment and time use for men, women, and children,” Rev. Econ. Househ., Vol.20, No.3, pp. 763-797, 2022. https://doi.org/10.1007/s11150-022-09600-2
- [30] N. K. Raut, “A review of the economic impacts of the COVID-19 pandemic and economic policies in Nepal,” MPRA Paper, No.102778, 2020.
- [31] The Asia Foundation, “Independent Impacts and Recovery Monitoring Nepal Phase 1: June 2015,” Synthesis Report, 2015.
- [32] D. Yang and H. J. Choi, “Are remittances insurance? Evidence from rainfall shocks in the Philippines,” World Bank Econ. Rev., Vol.21, Issue 2, pp. 219-248, 2007. https://doi.org/10.1093/wber/lhm003
- [33] G. R. G. Clarke and S. Wallsten, “Do remittances act like insurance? Evidence from a natural disaster in Jamaica,” SSRN, 2003. https://doi.org/10.2139/ssrn.373480
- [34] T. Walker, Y. Kawasoe, and Jui Shrestha, “Risk and vulnerability in Nepal: Findings from the household risk and vulnerability survey” World Bank Group, Report No.AUS0001213, 2019.
- [35] World Bank, “Nepal Development Update, May 2016: Remittances at Risk,” 2016. https://doi.org/10.1596/24663
- [36] B. Manandhar, “Remittance and earthquake preparedness,” Int. J. Disaster Risk Reduct., Vol.15, pp. 52-60, 2016. https://doi.org/10.1016/j.ijdrr.2015.12.003
- [37] V. Rayamajhee and A. K. Bohara, “Natural disaster damages and their link to coping strategy choices: Field survey findings from post-earthquake nepal,” J. Int. Dev., Vol.31, Issue 4, pp. 336-343, 2019. https://doi.org/10.1002/jid.3406
- [38] T. Sato, T. Tachibana, T. Sakurai, and S. Rayamajhi, “Do remittances make poor households more resistant to ‘natural disasters’? Evidence from the 2015 earthquake in Nepal,” Int. J. Disaster Risk Reduct., Vol.73, Article No.102858, 2022. https://doi.org/10.1016/j.ijdrr.2022.102858
- [39] S. Adhikari and D. K. Adhikary, “Post-disaster housing reconstruction the case of Nepal,” Project Research and Management Associates, Article No.hal-04280513, 2023.
- [40] N. H. Dhakal, N. R. Simkhada, and M. Ozaki, “Microfinance for disaster recovery: Lessons from the 2015 Nepal earthquake,” Asian Development Bank (ADB) South Asia Working Paper Series, No.65, 2019. https://doi.org/10.22617/WPS190025-2
Appendix
Appendix A. Tables
A.1. \(t\)-test for Productive Assets Damage Between Rural Areas and Urban Areas in NEQS I
| Type of productive assets damage | Proportion of households reporting damage in rural areas (A) | Proportion of households reporting damage in urban areas (B) | Difference (A\(-\)B) |
| Cattle shed | 0.48 | 0.24 | 0.24\(^{***}\) |
| Cereal crops | 0.50 | 0.33 | 0.17\(^{***}\) |
| Cattle damage | 0.13 | 0.03 | 0.10\(^{***}\) |
| Poultry damage | 0.11 | 0.05 | 0.06\(^{***}\) |
| Land damage | 0.28 | 0.04 | 0.24\(^{***}\) |
*Significant at 1% level.
**Significant at 5% level.
***Significant at 10% level.
A.2. Randomly Selected PSUs District
| Dhading (5) | Bhumesthan, Gumdi, Marpak, Darkha, Salyantar |
| Gorkha (3) | Tandrang, Laprak, Gumda |
| Dolakha (3) | Jugu, Namdu, Suri |
| Ramechaap (2) | Bethan, Hiledevi |
| Kavre (7) | Rabi Opi, Kusadevi, Nala Ugrachandi, Shakhupati chur, Mahadesthan Mandan, Chadanimadan, Dolalghat |
| Sindhupalchok (4) | fulpingdanda, Mankha, Ramche, Tatopani |
| Lalitpur (3) | Nallu, Lele, Chapagaun |
| Makwanpur (4) | Chitlang, Kulekhani, Faparbari, Sikharapur |
| Nuwakot (3) | Madanpur, Kalyanpur, Samri |
Source: Based on CDPS sampling design.
A.3. Variation of Earthquake Intensity Across Sampled Villages in Nine Districts
| Serial No. | Districts | Number of sampled villages (earthquake intensity on MM scale) | Total | ||||
| V | VI | VII | VIII | IX | |||
| 1 | Ramechaap | 2 | 2 | ||||
| 2 | Nuwakot | 3 | 3 | ||||
| 3 | Makwanpur | 4 | 4 | ||||
| 4 | Lalitpur | 2 | 1 | 3 | |||
| 5 | Kavre | 3 | 3 | 1 | 7 | ||
| 6 | Gorkha | 3 | 3 | ||||
| 7 | Dhading | 1 | 1 | 3 | 5 | ||
| 8 | Sindhupalchok | 1 | 3 | 4 | |||
| 9 | Dolkha | 3 | 3 | ||||
| Total | 12 | 9 | 13 | 34 | |||
Source: 22.
Appendix B. Technical Details of the Assessment of the Recovery Process
As suggested earlier, the first strategy follows the model by Carter et al. 13 and is used to explore household asset recovery paths. In particular, this model is used to assess whether poor households with low pre-disaster asset bases follow a convergent accumulation process, that is, whether the assets of lower-wealth households grow rapidly toward the equilibrium level and whether the asset growth of wealthier households slows down and approaches zero as equilibrium is reached (Fig. 3). In other words, this study explores the underlying patterns of asset accumulation. Ordinary least squares is used for the estimation purposes.
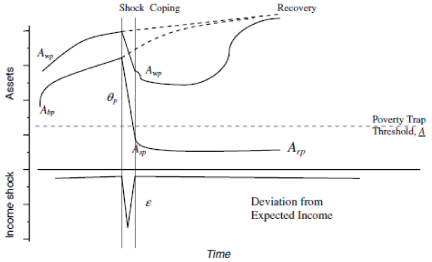
Fig. 3. Convergent assets accumulation process.
The empirical strategy used is as follows:
This article is published under a Creative Commons Attribution-NoDerivatives 4.0 Internationa License.