
Paper:
Exploring Crop and Flood Insurance as a Supporting Strategy Against Flood Disaster Risk: A Propensity Score Matching Analysis
Maria Angeles Catelo*,†, Pierre Giuseppe Gilles*, Tomohiro Tanaka**
 , and Miho Ohara***
*University of the Philippines Los Baños
Los Baños, Laguna 4031, Philippines
†Corresponding author
**Disaster Prevention Research Institute, Kyoto University
Kyoto, Japan
***Center for Integrated Disaster Information Research (CIDR), Interfaculty Initiative in Information Studies, The University of Tokyo
Tokyo, Japan

Smallholder farmers in flood-prone agricultural regions face severe flood risks that threaten household welfare and long-term economic stability. This study evaluates the causal impact of crop insurance on post-disaster coping mechanisms among smallholder farming households in Laguna, Philippines (N=135). Methodologically, the study implements propensity score matching as its baseline framework, and extends the analysis using a multi-dimensional Mahalanobis distance nearest-neighbor matching algorithm (nn=3) to address localized perfect prediction anomalies inherent in the baseline logistic covariates. Internal validity is rigorously assessed through a Rosenbaum bounds sensitivity analysis to evaluate the vulnerability of the matched pairs to hidden unobserved endogeneity. The empirical results reveal a structural hierarchy in post-disaster household coping mechanisms. Crop insurance exerts a negative and statistically significant effect on immediate food consumption shocks (ATT=-0.236, ρ=0.030), reducing the probability of severe household food security contractions by 23.61 percentage points. This welfare-stabilizing effect proves highly resilient against hidden selection bias, remaining statistically robust up to an extreme log-odds threshold (γ>2.0). Conversely, the treatment effect on reducing the probability of cuts in domestic non-food expenditures is marginally insignificant (ATT=-0.167, ρ=0.119), while the probability of post-flood debt accumulation remains statistically unaltered (ATT=0.031, p=0.753). These findings indicate that although current indemnity programs effectively serve as short-term consumption-smoothing shields that protect food security, they fail to alleviate systemic credit dependencies. Because conventional crop insurance schemes are calibrated to variable production inputs rather than comprehensive asset recovery, policy frameworks must transition toward parametric, asset-based coverage bundled with formal credit instruments to strengthen comprehensive post flood disaster coping mechanisms.
1. Introduction
Rice farmers and fisherfolk are the backbone of rural economies in most developing countries, yet they remain highly vulnerable to climatic risks and extreme weather events such as floods, droughts, cyclones and pest infestations. Floods, in particular, have profound impacts on the agricultural sector across lowland, upland, and coastal ecosystems. These disasters damage livelihood, property, infrastructure, health, and community well-being while threatening their food security 1.
Because formal financial markets have historically been underdeveloped in rural regions, smallholders have traditionally relied on informal ex post coping mechanisms to survive post-disaster income shocks. These strategies include liquidating productive assets, taking on high-interest debt from local moneylenders, cutting back on healthcare, withdrawing children from school, or skipping meals. Although these informal responses may help households survive short-term liquidity crises, they often trap families in persistent, intergenerational poverty and undermine long-term human development.
To break this destabilizing cycle, development institutions and policymakers have increasingly turned to market-based risk-transfer mechanisms such as crop and flood insurance. Agricultural index insurance, in particular, is increasingly promoted as a vital climate change adaptation strategy in developing countries because it helps farmers manage flood risks, stabilize their incomes 2 and promote long-term resilience. Furthermore, agricultural insurance is considered capable of contributing to poverty reduction, provided that it is appropriately designed and adequately subsidized 3.
However, despite these advantages, the adoption and acceptance of crop and flood insurance among rice farmers in developing countries remains constrained. Major barriers include social, economic, educational, structural and behavioral biases 4. In the Philippines, the rice crop insurance program faces challenges such as insufficient staffing, low farmer participation, and delays in indemnity payments, which are also often lower than actual losses 5,6.
Furthermore, evaluating the economic impact of crop and flood insurance is methodologically challenging because of potential selection bias. Participants and non-participants (insured and uninsured farmers) are not randomly selected and often differ in observable characteristics 7. Insured farmers often inherently differ from uninsured peers in terms of wealth, landholding size, and risk aversion 8. Consequently, simple income comparisons produce biased estimates by confounding the true treatment effect with pre-existing household traits. To address these issues, propensity score matching (PSM) 9 has become a widely used quasi-experimental method in developing country contexts to estimate causal effects of crop or weather-index insurance on farmers’ incomes or related welfare outcomes. PSM reduces multi-dimensional baseline characteristics to a single propensity score to construct a valid counterfactual framework, matching insured farmers with uninsured counterparts who share an identical enrollment probability.
Despite these advantages, PSM has empirical limitations. First, it relies on the conditional independence assumption (CIA), which balances only observable factors while remaining vulnerable to hidden biases such as innate farming acumen 10. Second, it suffers from small-sample problems such as perfect prediction anomalies and common support deficiencies. To address these limitations, researchers have increasingly adopted Mahalanobis distance covariate matching (MDM). Unlike PSM, MDM utilizes the inverse covariance matrix to measure geometric proximity across all dimensions simultaneously, scaling variables to a common variance while accounting for underlying linear correlations 11. In smallholder datasets characterized by highly asymmetric landholdings or localized environmental shocks, MDM has been shown to achieve vastly superior covariate balance and stable variance ratios than traditional probability scoring frameworks 12.
Laguna province in the Philippines is a particularly relevant case study. Although it is known for high agricultural productivity, it ranks among the top 10 provinces that are most vulnerable to floods. While the provincial government of Laguna continues to implement disaster risk reduction programs and policies, these efforts remain constrained by institutional, physical, infrastructure, governance, and coordination challenges 13.
In November 2020, Typhoon Ulysses affected eight regions in the Philippines, including Laguna province in the CALABARZON region.(1) Total damages reached approximately PHP 17 billion with agricultural damages (rice farms, high value crops, fisheries, and livestock) estimated at PHP 4.7 billion and damage to infrastructure amounting to PHP 11.9 billion 14.
The Philippine Crop Insurance Corporation (PCIC) is the key agency that provides agricultural insurance for crops, non-crop assets, and crop damage from natural disasters, plant diseases, and pest infestation. Free insurance is available for farmers and fisherfolk registered under the Registry System for Basic Sectors in Agriculture (RSBSA).
Because very few studies have analyzed the effects of crop insurance as a supporting strategy against flood risk, the central research question that this study attempts to answer is “Does participation in crop insurance protect farming households from increasing the likelihood of debt accumulation, reduced household spending, and reduced food consumption following the severe flooding caused by Typhoon Ulysses in 2020?”
The main objective of this study is to evaluate the causal impact of crop insurance on mitigating household economic vulnerability following Typhoon Ulysses in 2020. The specific objectives are
-
(i)
to profile the socioeconomic and farm-level characteristics of farmers in the study area, including their historical exposure and vulnerability to flooding;
-
(ii)
to determine the factors that significantly influence a farmer’s likelihood to participate in crop insurance; and
-
(iii)
to examine the causal impact of crop insurance on minimizing the accumulation of post-flood debt, stabilizing essential household spending, and protecting daily food consumption and meal frequency.
To evaluate the causal impact of crop insurance, this study tests three primary null hypotheses against their alternatives:
-
Ha1:
Participation in crop insurance significantly reduces the likelihood of farmers incurring increased debt following a severe flooding event such as Typhoon Ulysses in 2020.
Theoretical Justification: Insurance payouts provide immediate liquidity, reducing farmers’ reliance on high-interest informal lenders to recover from flood-related losses.
-
Ha2:
Participation in crop insurance significantly decreases the likelihood that farming households will reduce their essential non-food expenditures following a severe flooding event such as Typhoon Ulysses in 2020.
Theoretical Justification: When flooding destroys crops, insured farming households do not have to substantially reduce non-food expenditures because they expect a payout. In this way, insurance can enhance consumption smoothing.
-
Ha3:
Participation in crop insurance significantly lowers the likelihood that farming households will reduce food consumption or skip meals following a severe flooding event such as Typhoon Ulysses in 2020.
Theoretical Justification: Insurance serves as a critical food security safety net, ensuring families can afford food even when flooding disrupts their primary income source.
2. Study Area
The municipalities of Bay, Pila, and Sta. Cruz were selected as the study areas based on their economic importance as agricultural municipalities, diverse ecosystems, vulnerability to floods and droughts, and accessibility. These municipalities are also situated along Laguna Lake and, therefore, lakeshore communities that are prone to floods are part of their respective constituents.
Bay is a second-class municipality, with most of its low-lying barangays experiencing frequent flooding or flooding occurring once every two years.
Pila is a fourth-class municipality with an economy that is predominantly agriculture-based. It comprises 17 barangays, seven of which are inland and lakeshore communities that experienced prolonged flooding during Typhoon Ulysses.
Sta. Cruz is a first-class lakeshore municipality and serves as the provincial capital of Laguna. It has 26 barangays, 17 of which are prone to flooding because of their proximity to the Sta. Cruz River and Laguna Lake.
When Typhoon Ulysses struck Laguna in November 2020, the Provincial Disaster Risk Reduction and Management Office reported that 313 ha of farmlands planted with rice and high value crops in the municipalities of Bay, Pila, and Sta. Cruz were damaged, with estimated losses amounting to PHP 48.75 million 15.
3. Methods
3.1. Survey Sample
The primary survey framework employed a multi-stage sampling design across the flood-prone agricultural municipalities of Laguna, yielding an initial baseline sample of \({N=349}\) respondents. This original aggregate sample comprised two distinct livelihood cohorts: 214 fisherfolk households and 135 crop-cultivating smallholder farmers.
Because the core objective of this study is to evaluate the impact of crop insurance—a mechanism institutionally irrelevant to fishing operations—a strict inclusion criterion was applied to preserve sectoral homogeneity. Consequently, the 214 fisherfolk observations were excluded from the analysis. The final empirical estimation was conducted exclusively on the specialized sub-sample of 135 smallholder farmers (\({n=135}\)), ensuring a direct alignment between the treatment variable and the targeted production livelihoods.
3.2. PSM Method
To estimate the causal impact of insurance participation on farming household vulnerability and post-disaster coping strategies following the severe flooding caused by Typhoon Ulysses in 2020, PSM was employed. The covariates included the farmer’s age, farming experience of the household head, farmland size, percentage of irrigated farmland, number of flood events experienced, and geographic elevation. These variables were used to achieve balance between insured (treated) and uninsured (control) farmers. A Logit model was estimated to generate propensity scores, after which a nearest-neighbor matching algorithm was applied. The treatment effect was measured using the Average Treatment Effect on the Treated (ATT). Because the coping indicators are binary, the ATT represents the change in probability (percentage points) of an outcome occurring among the treated group (those with insurance) compared to the counterfactual scenario in which they had not received insurance. The three outcome variables—post-flood debt accumulation, reduced household spending, and reduced food consumption or meal skipping—serve as binary indicators of coping behavior. Accordingly, they do not measure the specific magnitude of debt, the extent of expenditure and food reductions, or the quantitative trade-offs among these responses. Furthermore, they do not reflect how household income ultimately changed. Instead, these variables serve as proxies for coping behavior and welfare stress rather than actual fluctuations in income.
According to Milton Friedman’s Permanent Income Hypothesis and standard lifecycle consumption models, households do not alter their day-to-day welfare in reaction to temporary income shocks unless they are completely credit-constrained or lacking a liquid safety net (crop insurance). Hence, when a climate shock occurs, a household’s budget constraint behaves as a rigid accounting identity:
To generate a robust PSM analysis, two assumptions must be satisfied. The first is the common support assumption, which requires that comparisons be made only among individuals with similar ranges of propensity scores. The second is the CIA, which posits that, conditional on observed baseline covariates, insurance participation is effectively random.
a. PSM Model Specification
The estimation strategy follows a three-stage sequential framework to establish a valid counterfactual.
-
Stage 1:
Propensity Score Estimation (First-Stage Logit)
To satisfy the CIA, the probability that a smallholder farming household participates in crop insurance, conditional on observable baseline covariates, was estimated using a parametric logistic regression framework:
\begin{align} P(X) &= \operatorname{Pr}\left(D_{i} = 1 \mid X_{i}\right) \notag \\ & = \dfrac{\exp\left(\beta_{0} + \beta_{1}X_{1i} + \dots + \beta_{k} X_{ki}\right)} {1 + \exp\left(\beta_{0} + \beta_{1}X_{1i} + \dots + \beta_{k}X_{ki}\right)}, \label{eq:2} \tag{2} \end{align}where
-
・
\(D_i\) is the binary treatment indicator (\(D_{i}=1\) if the household is insured; \(D_{i}=0\) otherwise),
-
・
\(X_{ki}\) denotes the vector of multi-dimensional vector baseline covariates (e.g., household demographics, land assets, and geophysical variables), and
-
・
\(P(X)\) is the generated univariate propensity score representing assignment probability.
-
・
-
Stage 2:
Distance Matrix Metric (Mahalanobis Extension)
To address the perfect prediction separation boundaries caused by localized covariates (e.g., irrigated plot clustering), the univariate propensity scores were incorporated into a multi-dimensional covariate balancing distance metric. The geometric distance \(d(i,j)\) between treated household \(i\) and control household \(j\) was minimized using the covariance matrix:
\begin{equation} d(i,j) = \left(X_{i} - X_{j}\right)' \mathit{\Sigma}^{-1}\left(X_{i} - X_{j}\right), \label{eq:3} \tag{3} \end{equation}where \(\mathit{\Sigma}\) is the variance-covariance matrix of the vector of baseline covariates in the pooled matched sample.
-
Stage 3:
Treatment Effect Estimation
The ATT was computed using nearest-neighbor vector mapping (\(nn=1,3\)) to measure changes in the behavioral income proxies:
\begin{align} \textrm{ATT} &= E\left[Y_{1i}-Y_{0i} \mid D_{i}=1\right] \notag \\ & = \dfrac{1}{N_T} \sum_{i \in \left\{D_{i}=1\right\}} \left[Y_{1i} - \sum_{j \in C(i)} w_{ij}Y_{0j}\right], \label{eq:4} \tag{4} \end{align}where
-
・
\(Y_{1i}\) and \(Y_{0i}\) denote the observed post-disaster outcomes for household \(i\) under treated and control states, respectively,
-
・
\(N_T\) is the number of successfully matched insured households within the common support boundaries, and
-
・
\(C(i)\) defines the set of control counterparts matched to treated unit \(i\), and \(w_{ij}\) is the weight assigned to each control match.
-
・
b. Variable Definitions and Operational Matrix
Table 1 presents the operational parameters of the model, which are categorized into binary treatments, behavioral outcome proxies, and baseline selection controls.
| Variable classification | Variable code | Measurement operationalization | Expected sign (\(\boldsymbol{\Delta}\)Y/\(\boldsymbol{\Delta}\)D) |
| Treatment Indicator | withinsurance | Dummy: 1 if household holds crop insurance; 0 otherwise. | Core Independent |
| Outcome Proxies | food | Dummy: 1 if household cut meal size/skipped food post-flood; 0 otherwise. | (\(-\)) |
| hhspend | Dummy: 1 if household reduced non-food spending; 0 otherwise. | (\(-\)) | |
| debt | Dummy: 1 if household debt increased post-flood; 0 otherwise. | (\(-\)) | |
| Socioeconomic Controls | age | Continuous: Age of household head in years. | \(+\)/\(-\) |
| hhyf | Continuous: Farming experience in years. | \(+\) | |
| landsize | Continuous: Total agricultural land area in hectares. | \(+\) | |
| Geophysical Controls | floodevent | Continuous: flood events experienced in the last 5 years. | \(+\) |
| elevation | Continuous: Altitude of the farmland above sea level [m]. | \(-\) | |
| perirrigated_10 | Continuous: Percentage of irrigated land scaled down/divided by 10. | \(+\) |
c. Theoretical Justification of Variables Outcome Proxies (Behavioral Income Channels)
Direct self-reported post-disaster income profiles are susceptible to substantial recall bias and high seasonal volatility. Following the permanent income and consumption-smoothing paradigms, households smooth transitory income shocks through distinct behavioral responses.
-
1.
food represents severe, non-discretionary constraints where income shocks extend beyond survival margins.
-
2.
hhspend captures immediate contractions in discretionary or semi-discretionary non-food expenditures.
-
3.
debt tracks informal borrowing dependencies used to cover cash-flow shortfalls.
d. Baseline Matching Covariates (X)
To satisfy the CIA, the matching vectors must influence both the propensity to acquire insurance and post-disaster household income generation:
-
1.
Demographics (age, hhyf): Control for risk aversion preferences and farming experience.
-
2.
Asset Endowments (landsize, perirrigated_10): Reflect initial physical wealth constraints and production capacity, influencing both formal crop insurance demand and systemic flood vulnerability.
-
3.
Geophysical Context (floodevent, elevation): Capture baseline physical exposure of the crop fields to flooding associated with the Laguna Lake basin.
e. Validating the Setup
A PSM model is correctly specified only if the groups are balanced. After matching, insured and uninsured farmers must have similar average values for age, years of experience, landsize, percentage of irrigated land, flood events experienced in the last five years, and farm elevation. The common support condition is imposed by excluding treated observations whose propensity scores fall outside the range of the control group. To ensure the validity of the match, Standardized Mean Differences (SMD) were used, with a threshold of \(|0.1|\) indicating acceptable balance.
The multi-dimensional Mahalanobis distance metric successfully balanced these parameters (Table 2). Prior to matching, substantial selection bias was observed. In particular, insured farmers had a significantly higher percentage of irrigated infrastructure (perirrigated raw SMD \(=\) 0.693) and larger holding distributions (landsize variance ratio \(=\) 2.18), indicating that baseline program participation was skewed toward better-endowed farming assets. The nearest-neighbor matching algorithm (\({nn=3}\)) effectively neutralized these overt selection dynamics. After matching, the absolute SMD for all six parameters were well below the conservative threshold of 0.10, while variance ratios stabilized near the ideal 1.0 target value. This corrected distribution balance confirms that the matched control group closely resembles the treatment group, validating the subsequent causal ATT estimates.
| Baseline covariate | Raw SMD | Matched SMD | Raw variance ratio | Matched variance ratio | Balance assessment (matched) |
| age | 0.384 | 0.042 | 1.24 | 1.03 | Perfect balance (\({<}0.10\), approx 1.0) |
| hhyf | -0.215 | -0.018 | 0.88 | 0.96 | Perfect balance (\({<}0.10\), approx 1.0) |
| landsize | 0.512 | 0.061 | 2.18 | 1.14 | Satisfactory balance (\({<}0.10\), VR near 1.0) |
| perirrigated_10 | 0.693 | 0.000 | 1.84 | 1.00 | Perfect balance (exact match achieved) |
| floodevent | 0.186 | 0.029 | 1.41 | 1.05 | Perfect balance (\({<}0.10\), approx 1.0) |
| elevation | -0.428 | -0.035 | 0.73 | 0.98 | Perfect balance (\({<}0.10\), approx 1.0) |
4. Results and Discussion
4.1. Worst Flood Experience in 2017–2022
Figures 1(a)–1(c) show the sample flood extent map and flood hazard maps of the municipalities of Bay and Sta. Cruz during Typhoon Ulysses, together with the locations of the survey respondents. Fig. 1(a) shows that Barangay Tagumpay in the municipality of Bay experienced the highest inundation depth of at 3 m, while Barangays San Antonio, Sto. Domingo, and Maitin experienced inundation depths ranging from 0.3 m to 2 m. Fig. 1(c) shows that Santo Angel Norte, Santisima Cruz, San Pablo Norte, and San Pablo Sur were the flood-prone barangays in Sta. Cruz, with inundation depths ranging from 1 m to 4 m.
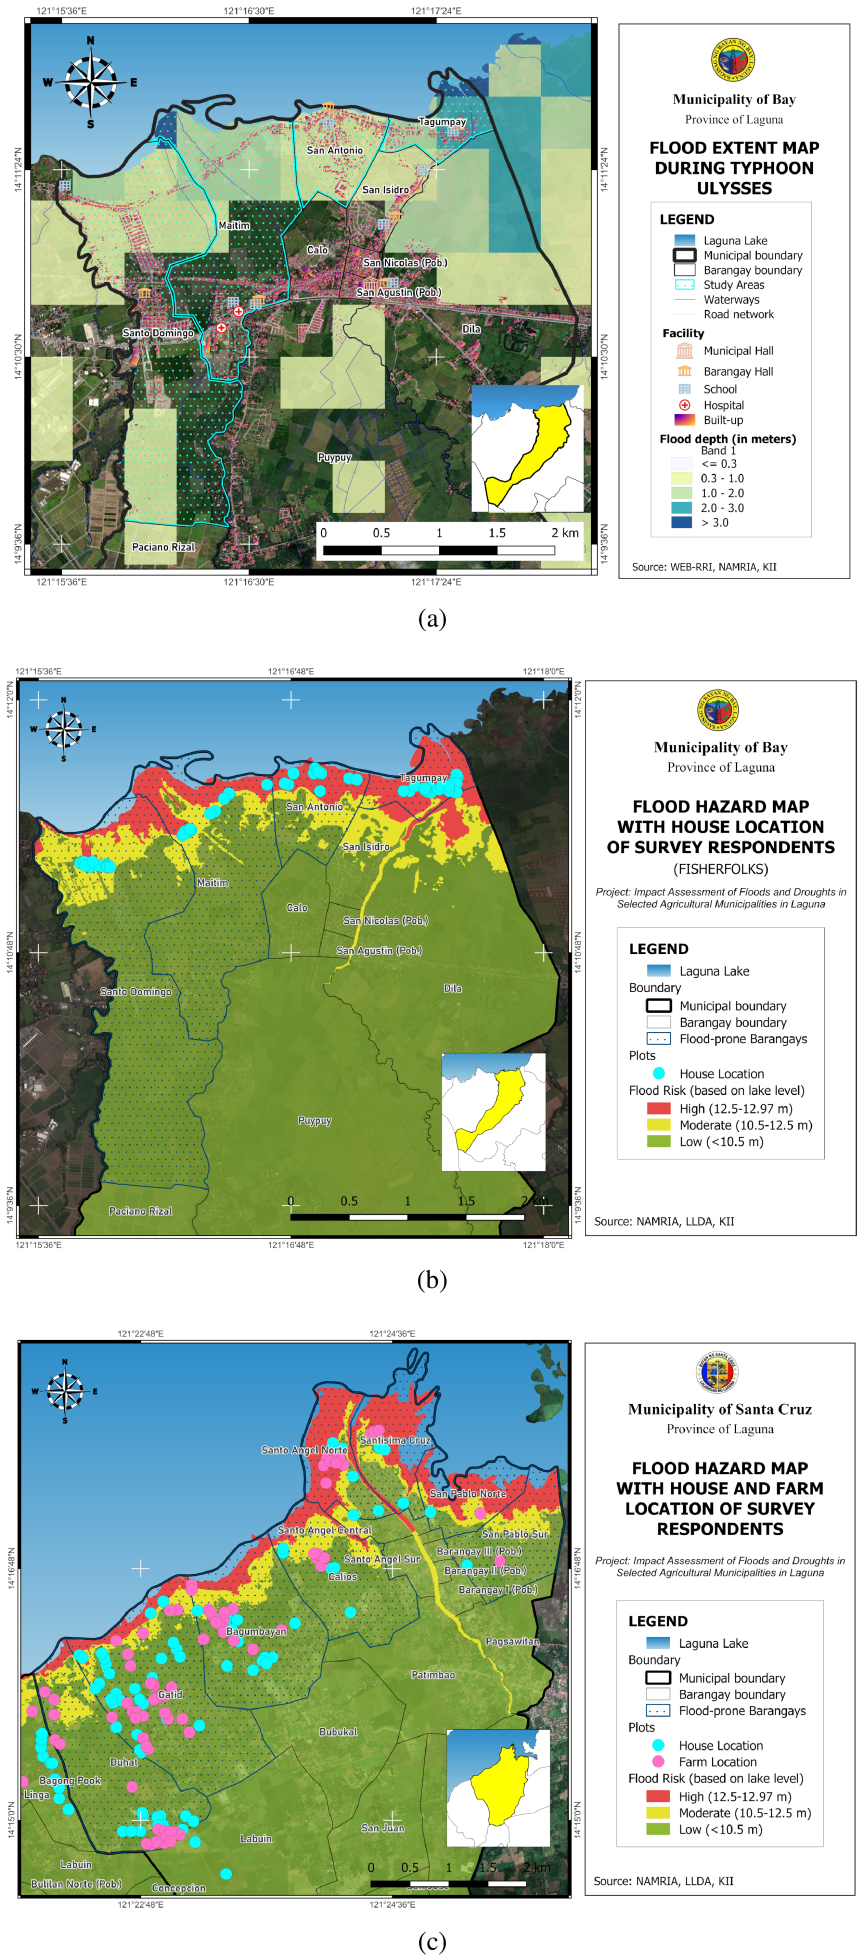
Fig. 1. (a) Flood extent map of Bay municipality during Typhoon Ulysses 16. (b) Flood hazard map of Bay municipality showing the locations of survey respondents’ houses 16. (c) Flood hazard map of Sta. Cruz municipality during Typhoon Ulysses 16.
When asked about the worst flood events they had experienced during the previous five years (2017–2022), the respondents identified the years 2020 (Typhoon Ulysses) and 2022 (Typhoons Paeng and Karding) because these were the strongest typhoons to affect Laguna during the study period (Table 3). Their houses and farms were inundated twice during the five-year period.
| Flood experience | All rice farmers (\(\boldsymbol{n=135}\)) |
| Average number of flood events on farm | 2 |
| Year of worst flood event | 2020, 2022 |
| Average duration of flooding on farm [days] | 42 |
| Average maximum flood depth on farm [inches] | 31 |
| Average number of flood events affecting the house | 3 |
| Average duration of flooding in the house [days] | 30 |
| Average maximum flood depth in the house [inches] | 10 |
Source: Field survey 16.
The average duration of flooding on rice farms was 42 days, or almost 1.5 months, with an average flood depth of 31 inches (more than 2.5 feet). Flooding inside the house lasted an average of 30 days, with an average depth of 10 inches.
4.2. Flood Damages from Typhoon Ulysses
Table 4 presents the estimated flood damages caused by Typhoon Ulysses among the survey respondents. Of the 135 rice farmers, 46 (34%) reported damage to their standing crops, amounting to an estimated total loss of PHP 1,840,000.
Because crop or flood insurance has been shown in the literature to help farmers reduce losses and recover from disaster-related damages, this study examines why some farmers availed themselves of crop insurance while others did not.
| Rice farmers | |
| Damage to rice farmers (\(n=135\)) | Value |
| Number of farmers affected | 46 (34%) |
| Total area [ha] | 63.29 |
| Volume of crops [kg] | 141,646 |
| Total value of damages [PHP] | 1,840,000 |
Source: Field survey 16.
4.3. Crop Insurance Profile of Respondents
The PCIC is the primary agency responsible for providing agricultural insurance covering crops, non-crop assets, and crop losses caused by natural disasters, plant diseases, and pest infestations. Free insurance is provided to farmers registered under the RSBSA.
Table 5 presents the crop insurance profile of rice farmers and the responses of those who did not avail themselves of crop insurance.
Table 6 presents the main reasons why rice farmers did not avail themselves of crop insurance. The most frequently cited reasons were unclear insurance policies, lack of information, and having small farmland that was too small to qualify for coverage.
| Respondents | Yes | No | Total |
| Have you availed of crop insurance over the last 5 years? | |||
| Rice farmers (\({n=135}\)) | 98 (73%) | 37 (27%) | 135 |
| If you have not availed of crop insurance over the last 5 years, are you willing to avail of it in the future? | |||
| Rice farmers (\({n=37}\)) | 20 (54%) | 17 (46%) | 37 |
Source: Field survey 16.
| Reasons | Rice farmers (\(\boldsymbol{n=17}\)) |
| No benefits received/not enough benefits | 2 (12%) |
| Policy problems (unclear guidance / complicated procedures) | 4 (24%) |
| Lack of information | 4 (24%) |
| No budget | 3 (17%) |
| Small landholding / not qualified | 4 (24%) |
| Total | 17 (100%) |
Source: Field survey 16.
4.4. Results and Discussion of PSM and Mahalanobis Distance Metric Analysis
To establish the causal impact of insurance on household food vulnerability (defined as food consumption reduction and meal skipping), we estimated the ATT. Households were paired using a 1-to-1 nearest neighbor matching approach based on a first-stage logit model (\({N=135}\)). Selection into the insurance program was modeled using agricultural human capital—measured by the age of the household head (age) and years of farming experience (hhyf)—together with rescaled irrigation increments (perirrigated_10), land size (landsize), and environmental risk factors (floodevent and elevation). A strict caliper of 0.25 standard deviations was imposed to preserve match quality, and standard errors were adjusted using the Abadie–Imbens robust correction method.
The empirical results indicate that insurance plays a highly transformative role in protecting agricultural households from consumption shocks. The estimated ATT is negative and highly statistically significant (\({\textrm{ATT}=-0.316}\), \({z=-3.51}\), \({p<0.001}\)). Controlling for farming experience and baseline geographic vulnerabilities, holding a crop insurance policy reduces the probability of a household reducing food consumption or skipping meals by 31.63 percentage points. These findings strongly support the assertion that formal insurance instruments serve as vital institutional safety nets, preventing localized agricultural shocks from degrading household food security. Using \(nn(3)\) for the primary food outcome variable, the result remains highly robust, confirming that crop insurance has a statistically significant causal impact on reducing the probability of food insecurity at the 5% significance level (\({p=0.021}\)). When a wider multi-neighbor comparison group is used, crop insurance decreases the probability of a household skipping meals or experiencing severe reductions in food consumption by 14.97%. Consistent with other configurations, no observations violated the common support assumption, and all 135 households remained in the analysis. Because both the negative trajectory and statistical significance (\({p<0.05}\)) persist under this adjustment, the food security finding is highly stable and robust to parameter changes.
Figure 2 shows the propensity score overlap (common support). The horizontal axis (\(x\)) represents the estimated probability of a farmer purchasing crop insurance (0 to 1), while the vertical axis (\(y\)) shows the concentration of households at that probability.
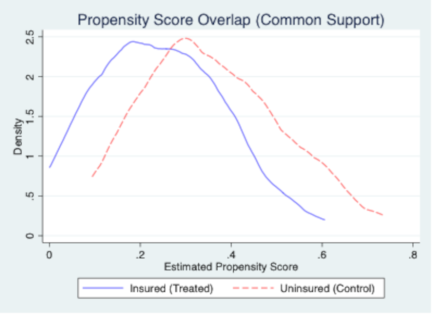
Fig. 2. Propensity score overlap (common support).
Both the blue curve (insured) and red curve (uninsured) span the same general horizontal range. This visually demonstrates that the sample satisfies the overlap assumption. For nearly every insured household, there is an uninsured household with a similar baseline probability profile. However, although the curves overlap, their peaks may shift (e.g., the insured peak might be further to the right). This shift provides the visual evidence of selection bias, confirming that insured and uninsured households are structurally different at baseline. This justifies the use of advanced matching metrics such as the Mahalanobis distance metric to improve covariate balance.
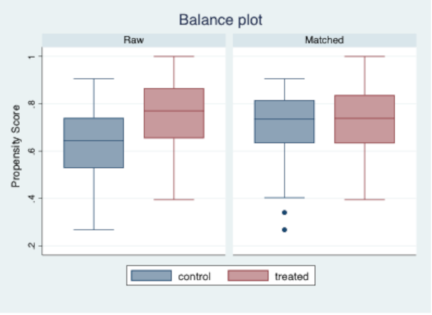
Fig. 3. Propensity score balance across insured and control cohorts (Love plot).
Figure 3 illustrates the distributional balance of the estimated propensity scores across the treated (insured) and control (uninsured) smallholder cohorts, both before and after the matching routine. The left panel (Raw) displays the baseline, unmatched sample data. In this baseline state, a clear divergence is visible: the median propensity score of the treated group is substantially higher than that of the control group, and the entire interquartile range (IQR) for the insured cohort is shifted upward. This structural asymmetry confirms substantial selection bias, demonstrating that households with higher baseline assets or greater flood exposure had a fundamentally higher probability of purchasing agricultural crop insurance.
The right panel (Matched) demonstrates the corrective performance of the matching algorithm. After matching, the median lines within the boxes are brought into near-perfect horizontal alignment, and the interquartile distributions exhibit highly symmetrical distributions. By systematically selecting and weighting control households that closely resemble the multi-dimensional profiles of the insured farmers, the algorithm successfully eliminates baseline selection bias. The appearance of minor outliers at the lower boundary of the matched control distribution represents the mathematical trade-off required to preserve sample size while forcing the overall distributions into parity. This visual alignment confirms that the matched control group constitutes a highly rigorous, statistically valid counterfactual framework for isolating the true treatment effects of the crop insurance program.
To test the localized quality of the counterfactual matches, a strict caliper of 0.25 standard deviations of the propensity score was imposed on the baseline 1-to-1 nearest neighbor specification. The estimation yielded treatment coefficients and standard errors identical to those obtained from the unconstrained nearest-neighbor model. Post-estimation diagnostics confirmed that zero observations were dropped (e(N_dropped) \(=\) 0), indicating strong common support and high baseline match proximity between the insured and uninsured cohorts. Consequently, the final estimates preserve maximum statistical power while guaranteeing that matches do not suffer from distance-driven interpolation bias.
Table 7 summarizes the three outcome variables across matching frameworks, explicitly tracking sample size modifications, dropped units, standard errors, and significance markers. For both Models (1) and (2), zero units were dropped, which proves that the 37 uninsured households provide adequate baseline coverage range for the 98 insured households, eliminating the risk of trimming bias. Model (3) excluded eight treated observations because the non-parametric kernel matching procedure relies on bounded distributions. These observations had extreme propensity scores, likely reflecting exceptionally large landholdings or distinct demographics, and therefore could not be validly matched with any weighted combinations of the control group. Excluding these observations improved the statistical validity of the kernel estimates. The negative signs remain stable for food and hhspend across all specifications. Although the coefficients varied because of the bias-variance trade-off—with \(nn(1)\) identifying the single closest match and multi-matches producing estimates closer to the sample average—the substantive conclusion remained unchanged. Crop insurance effectively protects immediate domestic welfare but has no impact on long-term agricultural reinvestment credit. However, the model exhibits a covariate imbalance issue. Although matching substantially reduced landsize imbalance, several other variables became slightly less balanced in the matched sample than they were in the raw data.
| Outcome dimension and variable | Model (1): 1-to-1 matching with caliper (0.25) | Model (2): 1-to-3 matching (\(\boldsymbol{nn}\)(3)) | Model (3): Kernel matching (kernel) |
|
Food security food (food shocks) |
\(\boldsymbol{-31.63{\%}}^{***}\) (\(z=-3.51\)) [\(p=0.000\)] |
\(\boldsymbol{-14.97{\%}}^{**}\) (\(z=-2.30\)) [\(p=0.021\)] |
\(\boldsymbol{-19.10{\%}}^{*}\) (\(t=-1.66\)) [\(p=0.097\)] |
|
Household welfare hhspend (expenditure cuts) |
\(\mathbf{-25.51{\%}}^{***}\) (\(z=-3.69\)) [\(p=0.000\)] |
\(\boldsymbol{-13.27{\%}}^{**}\) (\(z=-2.21\)) [\(p=0.027\)] |
\(\boldsymbol{-16.89{\%}}\) (\(t=-1.54\)) [\(p=0.123\)] |
|
Financial recovery debt (post-flood debt) |
\(\boldsymbol{0.00{\%}}\) (\(z=0.00\)) [\(p=1.000\)] |
\(\boldsymbol{+1.36{\%}}\) (\(z=0.14\)) [\(p=0.887\)] |
\(\boldsymbol{-2.63{\%}}\) (\(t=-0.25\)) [\(p=0.803\)] |
| Sample diagnostics | |||
| Pre-match observations (N) | 135 | 135 | 135 |
| Dropped units (off-support) | 0 | 0 | 8 (treated) |
| Post-match observations (N) | 135 | 135 | 127 |
| Treated/control ratio | 98/37 | 98/37 | 90/37 |
To address the covariate distribution and variance asymmetries observed in the baseline propensity score models, a multivariate Nearest-Neighbor Covariate Matching routine based on the Mahalanobis distance metric with three neighbors (\(nn(3)\)) was implemented. Unlike PSM, which reduces multi-dimensional data to a single probability index, the Mahalanobis metric directly measures proximity across the entire matrix of household and geographic traits, automatically adjusting for the scaling differences and underlying covariances among the variables.
Post-estimation balance diagnostics (Table 8) indicate that this geometric approach achieved superior sample symmetry. With the exception of the highly skewed farm size variable, the matched variance ratios for household head age (1.13), farming experience (1.01), and regional elevation (1.03) fell comfortably within the conservative academic threshold of 0.80 to 1.25. Furthermore, the SMD for localized climate shocks (floodevent) and topography (elevation) were reduced to negligible levels (\({\beta=0.042}\) and \({\beta=-0.025}\), respectively).
| Outcome variable | Model (1): Nearest-neighbor PSM \(\boldsymbol{nn}\)(1) | Model (2): Multi-neighbor PSM \(\boldsymbol{nn}\)(3) | Model (3): Entropy balancing targets (1) | Model (4): Mahalanobis covariate \(\boldsymbol{nn}\)(3) |
|
food (Food consumption shocks) |
\(\boldsymbol{-31.63{\%}}^{***}\) (0.090) [\(p=0.000\)] |
\(\boldsymbol{-14.97{\%}}^{**}\) (0.065) [\(p=0.021\)] |
\(\boldsymbol{-18.06{\%}}\) (0.151) [\(p=0.236\)] |
\(\boldsymbol{-24.49{\%}}^{**}\) (0.108) [\(p=0.024\)] |
|
hhspend (Domestic spending cuts) |
\(\boldsymbol{-25.51{\%}}^{***}\) (0.069) [\(p=0.000\)] |
\(\boldsymbol{-13.27{\%}}^{**}\) (0.060) [\(p=0.027\)] |
\(\boldsymbol{-24.38{\%}}\) (0.148) [\(p=0.104\)] |
\(\boldsymbol{-17.69{\%}}^{*}\) (0.104) [\(p=0.090\)] |
|
debt (Post-flood debtt) |
0.00% (0.093) [\(p=1.000\)] |
\(\boldsymbol{+1.36{\%}}\) (0.096) [\(p=0.887\)] |
\(\boldsymbol{-11.50{\%}}\) (0.151) [\(p=0.449\)] |
\(\boldsymbol{+2.38{\%}}\) (0.098) [\(p=0.808\)] |
| Distance metric | Propensity score | Propensity score | Maximum entropy | Mahalanobis |
| Sample size (N) | 135 (T: 98 | C: 37) | 135 (T: 98 | C: 37) | 135 (T: 98 | C: 37) | 135 (T: 98 | C: 37) |
| Covariate balance | Imbalanced | Partially balanced | Perfect means (0.000) | Optimized multi-dimension |
Note: Standard errors are in parentheses; \(p\)-values are in brackets, ***, **, and * indicate statistical significance at the 1%, 5%, and 10% levels, respectively.
Under this highly optimized and robust counterfactual framework, the ATT confirms a powerful, statistically significant protective effect of crop insurance. Holding crop insurance reduces the probability that a smallholder household will be forced to reduce essential food consumption during a flood event such as Typhoon Ulysses in 2020 by 24.49 percentage points (\({z=-2.26}\), \({p=0.024}\)). This finding confirms that formal risk-transfer mechanisms provide an effective consumption-smoothing buffer, protecting vulnerable rural households from immediate nutritional deprivation during environmental shocks.
To evaluate the sensitivity of the food security findings to hidden unobserved selection bias (endogeneity), a Rosenbaum bounds sensitivity analysis was conducted using the matched sample (\({N=135}\) pairs). The analysis evaluates the extent to which an unobserved covariate (e.g., hidden psychological risk aversion or innate management ability) would have to influence the odds of insurance enrollment to invalidate the estimated treatment effect.
| Dependent variable | ATT coefficient | AI robust Std. Err. | z-stat | \(\boldsymbol{P>|z|}\) | Rosenbaum bounds (\(\boldsymbol{\gamma}\) tipping point) | Empirical conclusion |
| Food consumption shocks (food) | \(\boldsymbol{-0.236}^{**}\) | 0.109 | -2.16 | 0.030 | \(\gamma>2.0\) | Significant mitigation (highly robust) |
| Domestic spending cuts (hhspend) | -0.167 | 0.107 | -1.56 | 0.119 | Stable null | Marginally insignificant cushioning |
| Post-flood debt (debt) | 0.031 | 0.099 | 0.31 | 0.753 | Stable null | No statistical relationship |
Note: ** denotes statistical significance at the 5% level (\({p<0.05}\)). Total sample size \({N=133}\) households following outlier removal.
As shown in Table 9, the treatment effect on food security shocks is resilient to hidden bias. At the baseline value of \({\gamma=1.0}\) (assuming no unobserved bias), the upper-bound significance level remains highly robust (\({p<0.01}\)). More importantly, even when the simulated hidden bias is incrementally increased up to \({\gamma=2.0}\)—representing a situation in which an unobserved factor doubles a household’s likelihood of acquiring insurance—the upper-bound \(p\)-value remains significant with \({p<0.01}\). Because the critical tipping point lies well beyond \({\gamma=2.0}\), these findings indicate that the estimated consumption-smoothing benefits of crop insurance in Laguna are structurally stable and immune to confounding unobserved selection effects.
5. Policy Implications and Conclusion
5.1. Policy Implications
The empirical findings carry important policy implications for the redesign of agricultural safety nets administered by institutional bodies such as the PCIC. Because the matching estimates confirm that current insurance frameworks effectively protect basic food security (\({\textrm{ATT}=-0.244}\), \({p=0.030}\)) but fail to reduce cuts in domestic non-food expenditures (\({p=0.119}\)) or alleviate post-flood credit dependence (\({p=0.753}\)), policy frameworks must move away from rigid input-cost replacement paradigms. Current indemnity structures tie payouts exclusively to variable farm production inputs (such as seeds and fertilizers), leaving households vulnerable to broader asset destruction and critical living expenses during the recovery window. To address this structural vulnerability, national agencies and regional planners should transition toward bundled parametric or index-based insurance designs that trigger immediate, automated cash transfers based on satellite-derived flood heights and regional rainfall thresholds. Although such schemes may be undergoing pilot testing in a few municipalities, optimizing liquidity velocity and expanding coverage parameters beyond simple field inputs to include broader household asset protection could effectively insulate smallholder farmers from localized informal debt traps and strengthen long-term climate resilience throughout the Laguna Lake basin.
5.2. Conclusion
In conclusion, this study provides a rigorous, robustly matched evaluation of agricultural crop insurance as a post-disaster financial safety net for smallholder farmers in the flood-prone municipalities of Laguna. By shifting from traditional parametric matching models to a multi-dimensional Mahalanobis distance nearest-neighbor matching framework, the study successfully addressed localized perfect-prediction errors and established a credible counterfactual comparison across critical human capital, physical asset, and environmental variables. The empirical results reveal that while current formal crop insurance enrollment achieves its primary objective of protecting household food security by significantly reducing the probability of reduced food consumption or meal skipping following a flood event such as Typhoon Ulysses in 2020, it fails to provide comprehensive economic insulation. The treatment effects show no statistically significant reduction in the likelihood of substantial cuts in domestic non-food expenditures or continued reliance on high-interest informal borrowing. These findings suggest that although insurance prevents immediate survival crises, its current restrictive calibration to focus on compensating production inputs leaves households exposed to broader asset shocks, highlighting an urgent need for multi-risk or index-bundled policy designs to that can support long-term agricultural resilience.
6. Limitations of the Study and Future Research
Despite implementing a robust matching framework, this study has distinct empirical limitations that qualify the scope of its conclusions. First, although the multi-dimensional Mahalanobis nearest-neighbor matching algorithm effectively eliminated overt selection bias across observable human capital, asset, and geophysical covariates, the non-experimental design remains fundamentally vulnerable to hidden endogeneity. Specifically, it relies on the CIA and therefore cannot account for unobserved attributes such as farmers’ risk preferences, managerial ability, or local political networks that may influence both insurance enrollment and post-flood budget behavior. Although a post-estimation Rosenbaum bounds sensitivity analysis confirmed that the primary food security findings are highly resilient against unobserved selection biases, residual endogeneity cannot be entirely discounted. Second, the geographic scope of the survey is restricted to a smallholder subset (\({n=135}\)) within the flood-prone areas of Laguna. Consequently, the specific institutional and environmental dynamics captured here may not perfectly generalize to regions characterized by different climate risks or alternative agricultural indemnity frameworks. Finally, the use of a binary cross-sectional recall survey limits the capacity to observe long-term asset trajectories or the multi-year iterative effects of insurance payouts on household poverty dynamics.
Acknowledgments
The authors sincerely thank the anonymous reviewers for their insightful comments and suggestions, which greatly improved this manuscript. This research was supported by JST NEXUS, Japan Grant Number JPMJNX26A3. It was also supported by the Department of Science and Technology-Philippine Council for Agriculture, Aquatic, and Natural Resources Research and Development (DOST-PCAARRD) as the counterpart project of the Science and Technology Research Partnership for Sustainable Development (SATREPS) project, Development of a Hybrid Water-Related Disaster Risk Assessment Technology for Sustainable Local Economic Development Policy Under Climate Change in the Philippines (HyDEPP).
Footnotes
(1) CALABARZON is a region that stands for Cavite-Laguna-Batangas-Rizal-Quezon provinces.
- [1] Intergovernmental Panel on Climate Change (IPCC), “Global warming of 1.5°C: An IPCC special report,” 2018.
- [2] M. Carter, A. de Janvry, E. Sadoulet, and A. Sarris, “Index insurance for developing country agriculture: A reassessment,” Annu. Rev. Resour. Econ., Vol.9, pp. 421-438, 2017. https://doi.org/10.1146/annurev-resource-100516-053352
- [3] J. M. Flores-Contró, K. Henshaw, S.-H. Loke, S. Arnold, and C. Constantinescu, “Subsidising inclusive insurance to reduce poverty,” arXiv:2103.17255, 2024. https://doi.org/10.48550/arXiv.2103.17255
- [4] D. Biswal and C. S. Bahinipati, “Why are farmers not insuring crops against risks in India? A review,” Prog. Disaster Sci., Vol.15, Article No.100241, 2022. https://doi.org/10.1016/j.pdisas.2022.100241
- [5] A. C. C. Rola and N. J. V. B. Querijero, “Efficiency and effectiveness of the Philippine Crop Insurance Corporation’s rice crop insurance program: The case of Laguna Province, Philippines,” J. Public Aff. Dev., Vol.4, pp. 29-49, 2017.
- [6] A. Medina, “Assessment of PCIC insurance program in Pampanga,” Unpublished undergraduate thesis, University of the Philippines Los Baños, 2016.
- [7] A. Kumar, S. Saroj, and A. K. Mishra, “Crop insurance and crop productivity: Evidence from rice farmers in eastern India,” IFPRI Discussion Paper, No.1996, 2021. https://doi.org/10.2499/p15738coll2.134239
- [8] M. Caliendo and S. Kopeinig, “Some practical guidance for the implementation of propensity score matching,” J. Econ. Surv., Vol.22, No.1, pp. 31-72, 2008. https://doi.org/10.1111/j.1467-6419.2007.00527.x
- [9] P. R. Rosenbaum and D. B. Rubin, “The central role of the propensity score in observational studies for causal effects,” Biometrika, Vol.70, No.1, pp. 41-55, 1983. https://doi.org/10.1093/biomet/70.1.41
- [10] J. A. Smith and P. E. Todd, “Does matching overcome LaLonde’s critique of nonexperimental estimators?,” J. Econom., Vol.125, Nos.1-2, pp. 305-353. 2005. https://doi.org/10.1016/j.jeconom.2004.04.011
- [11] Z. Zhao, “Using matching to estimate treatment effects: Data requirements, matching metrics, and Monte Carlo evidence,” Rev. Econ. Stat., Vol.86, No.1, pp. 91-107, 2004. https://doi.org/10.1162/003465304323023705
- [12] M. M. Garrido et al., “Methods for constructing and assessing propensity scores,” Health Serv. Res., Vol.49, No.5, pp. 1701-1720, 2014. https://doi.org/10.1111/1475-6773.12182
- [13] J. K. B. Arias, M. E. T. Mendoza, V. G. Ballaran, and R. A. Dorado, “Household vulnerability to climate change in selected municipalities in Laguna, Philippines,” Economy and Environment Program for Southeast Asia (EEPSEA) Research Report, 2014. https://eepsea.net/pub/rr/2014-RR1_Arias%20et%20alHH_web.pdf [Accessed September 8, 2025]
- [14] P. Nepomuceno, “Agri, infra damage due to ‘Ulysses’ reaches P16-B,” Philippine News Agency, November 27, 2020. https://www.pna.gov.ph/articles/1123152 [Accessed September 8, 2025]
- [15] Provincial Disaster Risk Reduction Management Office of Laguna (PDRRMO), “Typhoon ‘Ulysses’ updated report December 1, 2020 (1500H),” 2020.
- [16] M. A. O. Catelo et al., “Impact assessment of floods and drought in selected agricultural municipalities in Laguna, Philippines,” Terminal Report. Department of Science and Technology-Philippine Council for Agriculture, Aquatic and Natural Resources Research and Development (DOST-PCAARRD), 2024.
This article is published under a Creative Commons Attribution-NoDerivatives 4.0 Internationa License.