
Paper:
Roof-Snow-Falling Hazard Estimation Using Machine Learning and SNOWPACK Outputs with Snow-Disaster Data
Hiroyuki Hirashima*1,†
 , Katsuhisa Kawashima*2, Ken Motoya*3, and Hiroaki Sano*4
*1Snow and Ice Research Center, National Research Institute for Earth Science and Disaster Resilience (NIED)
187-16 Maeyama, Suyoshi, Nagaoka, Niigata 940-0821, Japan
†Corresponding author
*2Research Institute for Natural Hazards and Disaster Recovery, Niigata University
Niigata, Japan
*3Akita University
Akita, Japan
*4National Research Institute for Earth Science and Disaster Resilience (NIED)
Tsukuba, Japan

YukioroSignal was developed to mitigate house damage and accidents during snow removal, which is the most common cause of casualties in snow and ice disasters. It provides the spatial distribution of snow weight over a wide area to help people make decisions about roof snow removal. However, the current YukioroSignal cannot estimate the danger level of roof snow falling. SNOWPACK, a numerical snowpack model used in the YukioroSignal system, calculates the detailed layer structure of snow cover, and therefore has the potential to estimate this hazard. In this study, we attempted to develop a machine learning method for estimating roof-snow-falling hazard using the snow stratigraphy simulated by SNOWPACK and information on roof-snow-falling accidents from the snow and ice disaster database. Individual roof-snow-falling cases were classified into wet type and dry type based on the SNOWPACK simulation results. The hazard model was constructed using the past roof-snow-falling accident data as training data. As a result, the model showed a certain level of accuracy for both wet type and dry type during the fitting stage. In contrast, the evaluation conducted separately on training and test data showed some accuracy only for wet-type events and indicated the need for improvement for practical use. Based on the constructed machine learning model, a prototype of a roof-snow-falling hazard distribution estimation system was developed in conjunction with YukioroSignal and used to provide hazard distributions during the winter of fiscal year 2024.
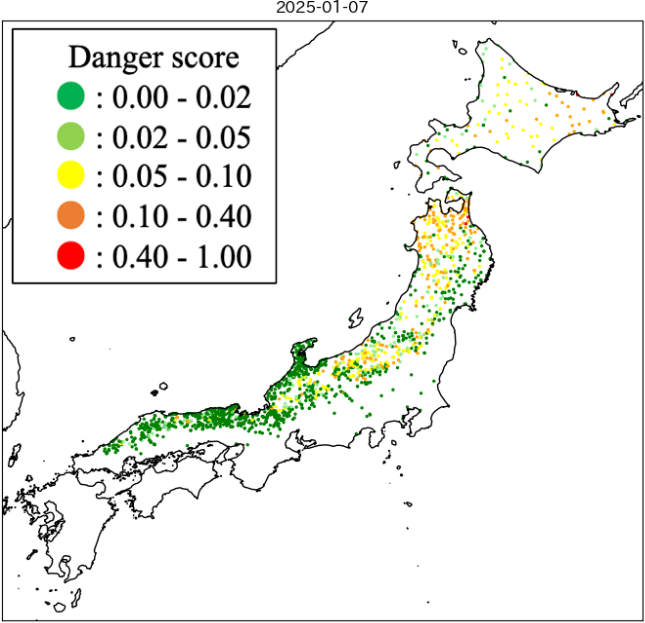
Roof-snow-fall hazard map, Jan. 7, 2025
1. Introduction
In Japan, snow and ice disasters claim around 100 fatalities each year 1, and more than half of these incidents are related to roof snow. Typical examples include falls from roofs during snow removal, house collapses, and burials caused by falling roof snow. To address these problems, we have developed the YukioroSignal system, which provides information on the 1 km\(^2\) mesh distribution of snow weight 2,3. YukioroSignal uses observed snow depth and meteorological data as inputs and estimates snow weight using the numerical snowpack model SNOWPACK. This system aims to reduce accidents involving falls from roofs and damage to houses by transmitting snow-weight information that helps people determine the appropriate timing for snow removal. Although the system uses snow weight (equivalent to snow water equivalent) as the final output, SNOWPACK simulates various physical parameters and the layered structure of a snowpack 4,5. These outputs can be used to assess snow instability and avalanche risks. Because roof snow falling, analogous to avalanches, involves downslope movement of snow on inclined surfaces, SNOWPACK has the potential to predict roof snow falling by utilizing physical quantities that have not been used in YukioroSignal.
Accidents caused by roof snow falling occur mainly when the snow cover on a roof collapses, slides down on the roof, and then falls. This leads to injuries when falling snow strikes people or when people are buried in fallen snow 6. Roof snow falling, similar to a small avalanche, is related to the balance between the driving force caused by gravity, which causes snow accumulated on a sloped roof to fall, and the resisting force that maintains the snow on the roof 7. The characteristics of roof snow falling are significantly influenced by physical factors such as melting, sintering, and changes in shear strength at the interface between the snow and roof material 8. Unlike natural snow on the ground, snow on a roof is exposed to outside air on its sides. As a result, it is subject to factors such as lateral snowmelt and cooling, making it prone to uneven temperature conditions across its width. Consequently, differences in how the roof surface is affected by indoor temperatures and outside air lead to temperature variations across the roof surface, causing the resisting force to become uneven, which can result in roof snow falling at the weakest points 9. In addition, the layout of buildings can alter wind patterns, thereby changing the distribution of snow within residential areas and potentially affecting the amount of snow accumulation on roofs 10,11. Factors affecting the resisting force include static friction, kinetic friction, freezing adhesion, and adhesion to the roof surface, as well as bonding between snow particles, roof slope, roof surface material, and the liquid water content (LWC) of the snow, all of which influence friction and freezing adhesion 8,9. In particular, because the LWC of snow fluctuates over time, it is a critical factor in determining when the roof snow will fall. The LWC at the interface between the roof and snow base is influenced not only by water infiltration from the surface due to rainfall or snowmelt, but also by warming caused by heat from inside the building 9 and by solar radiation penetrating the snow layer and warming the interface 12. Furthermore, the increase in grain size resulting from wet snow metamorphism leads to a decrease in adhesion strength 13. Consistent with this explanation, experimental results show that roof snow begins to fall not immediately after the outside temperature rises above 0 °C, but rather when that temperature remains above 0 °C for an extended period 14. Although technologies for dealing with snow on roofs have advanced alongside technological developments, such as improved building insulation, the problem of snow cornices remains a concern 15. As falling snow cornices can also lead to accidents, research is being conducted to prevent their formation 16. The main causes of falling snow cornices are an increase in the weight of the overhanging section and a decrease in the bearing capacity due to rising temperatures 17.
Therefore, roof snow falling can occur through multiple patterns, and its occurrence depends on the house and roof types; thus, structural information is necessary to predict the hazard level for individual houses. A system for predicting roof snow falling that considers these factors would be ideal. However, to achieve this, it is necessary to gather information on individual homes, such as roof pitch, surface shape, material, and thermal insulation conditions, and to conduct research on the underlying mechanisms. Furthermore, although snow cornices and roof snow falling involve different mechanisms, news reports and other sources often lump them together as “accidents caused by roof snow falling,” so little distinction is made between them 6. Therefore, when using spatially distributed snowpack data without information on housing structures, such as the YukioroSignal used in this study, a statistical or data-driven model is more realistic.
The Japan Meteorological Agency issues advisories related to heavy snowfall and snowmelt; however, no advisories directly address the hazard level of roof snow falling. At the regional level, Yamagata and Akita Prefectures provide information to warn residents about falls from roofs and accidents caused by roof snow falling, and they have established their own danger criteria based on temperature and snowfall thresholds 18,19,20. More recently, a similar study in Toyama Prefecture estimated the conditions associated with increased accidents using temperature and 7-day cumulative snowfall 21. However, there have been no attempts to scientifically estimate the risk of roof snow falling by considering snowpack properties simulated by numerical snowpack models. By using outputs from such models, it may be possible to develop a hazard estimation method for roof snow falling that is applicable beyond a specific region because the SNOWPACK model can reproduce snow profiles for various climatic conditions without specific parameter settings.
In the SNOWPACK model, the snow stability index 5,22 was used to assess the likelihood of dry snow avalanche occurrence, whereas the LWC index 23 was used for wet snow avalanches. These indices were derived directly from the numerical results and were closely related to the hazards associated with slope snow instability. Recently, machine learning methods have also been developed to determine avalanche risk based on avalanche forecasters’ assessments or records of avalanche occurrences 24,25.
In a machine learning approach, the model can infer the conditions under which roof snow falling is likely to occur from snow stratigraphy, together with information on roof snow falling; however, it is difficult to derive a risk index from the physical processes of snow falling that vary from house to house. Although the roof snow falling is strongly affected by processes at the roof-snow interface, such as a reduction in friction, these processes cannot be directly represented without detailed information on individual roof conditions. However, SNOWPACK-derived snow stratigraphy can reflect snowpack conditions that may influence roof snow falling, such as wetting, melt-freeze processes, snow amount, and snow instability. Therefore, rather than focusing only on the interface, snow stratigraphy was used in this study as an explanatory variable to enable the machine learning model to identify the relationships between the calculated snowpack conditions and the occurrence of roof snow falling. Accordingly, SNOWPACK outputs computed by the YukioroSignal system were used as explanatory variables together with meteorological data to estimate the hazard of roof snow falling. For training, we used a publicly available database of snow and ice disasters compiled by the Snow and Ice Research Center 6.
This study discusses (1) key meteorological and snowpack parameters associated with the roof-snow-falling hazard, (2) the usefulness of the estimated roof-snow-falling hazard obtained using a machine learning model, and (3) future approaches for improvements to obtain a more accurate roof-snow-falling hazard.
2. Method
2.1. Snow and Ice Disaster Database
The Snow and Ice Disaster Database is a collection of newspaper articles compiled by the Snow and Ice Research Center, National Research Institute for Earth Science and Disaster Resilience, since fiscal year (FY) 2000 6. The database summarizes situations reported in newspapers, as well as accidents and damage, organized by prefecture and type of snow and ice disaster. On the Snow and Ice Disaster Database website, users can choose either “Map View” or “List View”; when “List View” is selected, the target year, prefecture, and type of snow and ice disaster can be specified. “Across Japan” and “All Disaster Types” can also be selected. For the selected range, a table displays the date, location, circumstances and causes of each accident, number of victims, and type of economic loss. In this study, information on the dates and locations of roof-snow-falling incidents was extracted across Japan for each year from FY2019 onward and used as training data. In the disaster database, roof snow falling is in the “falling snow from artifact” category. From this category, we excluded incidents unrelated to buildings, such as snow falling from power lines, and used the remaining cases as training data. The training data included not only cases of snow sliding off a roof, but also instances where snow cornices collapsed or snow removal operations caused the roof snow to fall. The number of roof-snow-falling incidents per year from FY2019 to FY2024 was 1, 58, 51, 22, 8, and 21, respectively. As of March 2026, the website provides data through FY2022; data for FY2023 and FY2024 are not yet publicly available, but are held by the Snow and Ice Research Center and were used in this study.
The number of cases that could be used as training data was limited because the area covered by the YukioroSignal was restricted to a few prefectures in the early years 3. Consequently, 131 incident cases up to FY2024 fell within the YukioroSignal coverage area and were available for analysis.
2.2. Use of SNOWPACK Output Data Calculated by YukioroSignal
YukioroSignal expanded its coverage year by year. Following a previous report 3, the system was extended to western Japan and is currently applied to all heavy snowfall areas, except around Mt. Fuji. In the Chugoku region, for prefectures such as Shimane and Tottori, where most of the prefecture is designated as a heavy snowfall area, the YukioroSignal covers the entire prefecture. In contrast, for prefectures such as Hyogo, Okayama, and Hiroshima, where only mountainous areas are designated as heavy snowfall areas, the municipalities in heavy snowfall areas are included. Similarly, municipalities in Kyoto, Shiga, and Tochigi were selected to cover heavy snowfall areas. YukioroSignal coverage is shown in Fig. 1, together with the year of application for each prefecture. Within this coverage area, snow stratigraphy was calculated using SNOWPACK 2,3 at locations where snow depth observations were available. The model uses snow depth data from a quasi-real-time snow distribution monitoring system 26 and meteorological inputs from nearby Automated Meteorological Data Acquisition System (AMeDAS) stations. SNOWPACK simulations were performed at 1,762 observation points in this area.
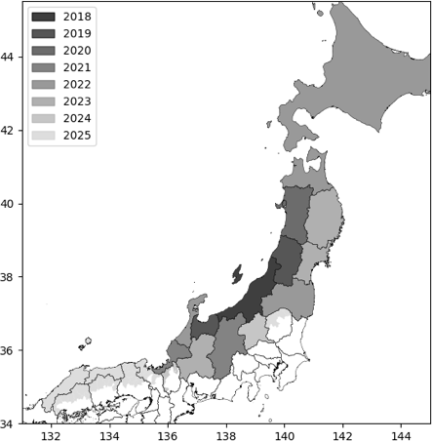
Fig. 1. Commencement year of YukioroSignal in each prefecture.
For the roof-snow-falling cases described in Section 2.1, we identified the names of municipalities and regions from individual newspaper articles, searched for those names on a “Calculation site for estimating the post-snow removal snow load” 2, and selected the nearest observation point. However, we excluded locations where snow depth observations were recorded daily and selected locations where observations were taken hourly.
Figure 2(a) shows a case study of an accident site in Yamagata Prefecture. Snow depth increased by approximately 70 cm due to heavy snowfall on December 23, and the upper part of the snow cover then metamorphosed into Melt Forms as temperatures rose and rainfall occurred the following day. In this study, “wet-type roof snow falling” is defined as roof snow falling associated with an increase in wet snow due to rising temperatures and rainfall, as in this case.
Figure 2(b) shows a case at an accident site in Hokkaido, where the roof snow fell under dry conditions, with no liquid water in the snow cover. This type of roof snow falling is defined as “dry-type roof snow falling.”
For classification, a case was classified as wet type if the upper 15 cm of the snow cover on the day of occurrence contained any layer with a volumetric water content greater than 2% and as dry type otherwise. Of the 131 cases included in the study, 49 were wet and 82 were dry.
Note that since this definition is not based on the LWC at the interface between the roof and the snowpack, a case will be classified as “dry type” even if snow melts due to heat from the building, provided there is no snowmelt or rainfall caused by weather conditions.
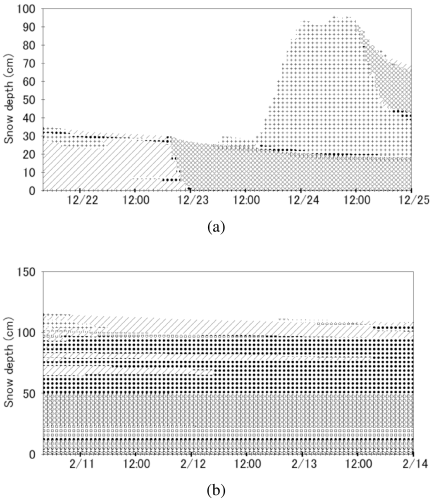
Fig. 2. Example of grain types simulated by SNOWPACK for roof-snow-falling accidents: (a) wet type on December 24, 2022; (b) dry type on February 13, 2023. Symbols: +, precipitation particles; /, decomposing and fragmented precipitation particles; ●, rounded grains; ○, melt forms; ◻, faceted crystals; |, melt-refreeze layer. The melt-refreeze layer is shown overlapping the melt-form symbol.
2.3. Construction of Machine Learning Models
When constructing the machine learning models, the meteorological data and SNOWPACK outputs corresponding to each roof-snow-falling accident were used as explanatory variables. The explanatory variables included (i) meteorological inputs to SNOWPACK (air temperature, relative humidity, wind speed, wind direction, solar radiation, long-wave radiation, precipitation, and snow depth) and (ii) all SNOWPACK output variables in the .met file generated using SNOWPACK version 3.7.0 including snow water equivalent, snowpack runoff, snowpack stability index, sensible heat flux, and latent heat flux. Because there are many output variables, please refer to the SNOWPACK website 27 for all parameter names.
Furthermore, to reflect information on snowpack stratigraphy, the snow profile data were processed into the following scalar values: average temperature across all layers, average density, average LWC, maximum LWC, depth of wet snow, proportion of wet snow, average LWC and proportion of wet snow in the top 15 cm, and average LWC and proportion of wet snow in the bottom 30 cm.
The selection of these processed scalar values followed the methodology of Hendrick et al. 25, who combined SNOWPACK outputs with machine learning to develop a wet snow avalanche prediction method. In their study, occurrence and non-occurrence days were used as the target variables. Because roof snow falling is influenced by the characteristics of individual houses, it is strictly speaking different from the occurrence of wet snow avalanches. However, because there is no information on the specific roof characteristics of individual houses and it is impossible to estimate the temperature conditions at the interface between the snowpack and roof, we used Hendrick et al.’s input variables, which are based on natural snow but have a proven track record. Because this model employs many explanatory variables, we believe that the differences in importance derived from the training results will yield a machine learning model that is distinct from that used for wet snow avalanches.
In this study, the meteorological and snow data were converted into daily averages and used as explanatory variables. The target variables were defined as dangerous days and safe days. Dangerous days were defined as days on which accidents occurred, whereas safe days were defined as the period from the beginning of the winter season to the day before an accident. Unlike pre-accident days, post-accident days cannot be classified as safe because houses with roof snow after an accident day may still be at risk of roof snow falling. However, they cannot be classified as dangerous days because there are no records of roof snow falling on these days. Therefore, post-accident days were excluded from the training data. A Random Forest model was constructed. Meteorological data used as input to SNOWPACK and SNOWPACK outputs were available at hourly resolution. Because the machine learning model used daily data, both were averaged to obtain daily values.
Because dry- and wet-type roof-snow-falling events occur under different snow conditions, separate Random Forest models were constructed, although the same explanatory variables were used.
The machine learning model was produced using Python’s scikit-learn library. Missing values were imputed using SimpleImputer and scalar values were standardized using StandardScaler. The RandomForestClassifier was used with the number of estimators (n_estimators) set to 100 to ensure that 100 “safe” or “dangerous” outputs were generated and random_state was set to a specific value to prevent different results from being generated each time.
3. Results
3.1. Importance of the Features
The Random Forest model provides information on the importance of each explanatory variable. Table 1 lists the 10 most important variables for the wet- and dry-type cases. For the wet-type roof snow falling (left in Table 1), variables related to liquid water in the upper snowpack showed the highest importance, including the proportion of wet snow (wet ratio) in the top 15 cm (No.1) and the total water content (total LWC) in the top 15 cm (No.3). Variables associated with melting and temperature rise, such as the melt-freeze part of the internal energy change (No.2) and the internal energy change (No.4), also had high importance, which is consistent with the idea that rising temperatures and rainfall increase the risk of roof snow falling. Variables commonly used in wet-snow avalanche risk assessment—the stability index and snowpack runoff—were ranked Nos.9 and 10, respectively. Although these variables were within the top 10, their importance was not particularly high compared with the top-ranked variables. The top three variables had importance values above 0.03, reflecting the characteristic conditions under which wet-type roof snow falling occurs.
For dry-type roof snow falling (right in Table 1), only snow water equivalent (SWE) exceeded an importance value of 0.03, and many of the top-ranked variables had importance values between 0.02 and 0.03. Features related to the positions at the minimum for various types of stability indices (Nos.2, 6, and 7) and features related to snow amount (Nos.1, 4, and 8) showed high importance. These results may provide useful reference information for inferring the conditions under which dry-type roof snow falling is likely to occur, and for identifying factors that may increase its risk.
| Importance for wet-type | [\(\times 10^{-2}\)] | Importance for dry-type | [\(\times 10^{-2}\)] |
| wet_ratio_15cm | 4.00 | SWE (of snowpack) | 3.27 |
| Melt freeze part of internal energy change | 3.24 | Position at minimum deformation stability index | 2.67 |
| total_LWC_15cm | 3.11 | Sublimation | 2.42 |
| Internal energy change | 2.58 | Modelled snow depth (vertical) | 2.39 |
| max_lwc | 2.52 | Downward long wave radiation | 2.32 |
| Evaporation | 2.21 | Position at minimum skier stability index | 2.27 |
| Modeled surface temperature | 2.00 | Position at minimum stability index | 2.19 |
| Sensible heat | 1.90 | all_thicknesses | 2.17 |
| Stability index S5 | 1.90 | Natural stability index | 2.05 |
| Snowpack runoff (virtual lysimeter) | 1.85 | Heat flux at ground surface | 2.04 |
3.2. Accuracy Verification in the Fitting Phase
When constructing the Random Forest model, 100 decision trees were used to assess danger levels. The model output was obtained using the predict_proba function of the RandomForestClassifier, and the output value for the dangerous class was used as a quantified danger score ranging from 0 to 1. This score was used as a relative indicator of danger and was not interpreted as the calibrated probability of roof snow falling. Fig. 3 shows the SNOWPACK results for the selected cases together with the temporal changes in the danger score estimated by the Random Forest model.
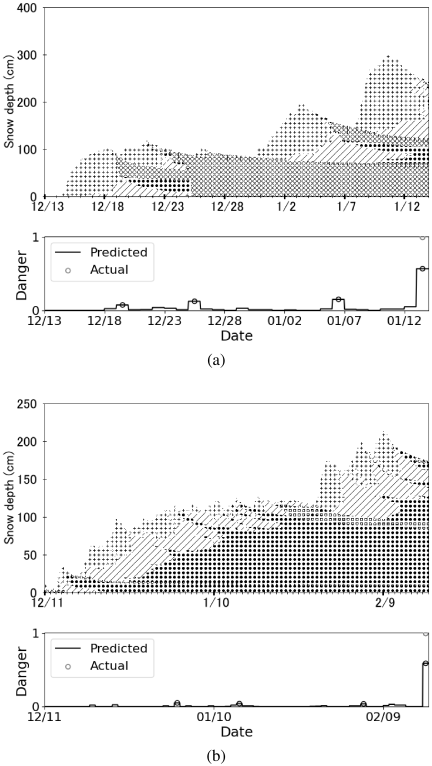
Fig. 3. Examples of danger-level estimates obtained using SNOWPACK outputs and the Random Forest model: (a) case of wet type at one accident site in Niigata on January 13, 2021; (b) case of dry type at one accident site in Hokkaido on February 16, 2022. Open circles on the predicted line indicate days when the estimated danger level exceeded the threshold of 0.05.
In the case of roof snow falling at one accident site in Niigata Prefecture (wet-type; Fig. 3(a)), the danger level increased during snowmelt but did not exceed 0.2 before the accident. In contrast, it reached 0.5 on January 13, the day of the accident, correctly indicating that roof snow falling occurred on a day with elevated danger. For the dry-type case at one accident site in Hokkaido (Fig. 3(b)), the danger level increased substantially even though no major change in snow cover was evident on the day of the accident. Examination of the explanatory variables suggested that the daily average wind speed on the day of the accident was higher than that on the preceding days, reaching 7.8 m/s.
Daily changes in danger levels were obtained for all cases. To evaluate accuracy, an optimal threshold is required to binarize the danger level into “safe” and “dangerous.” Therefore, a threshold sweep curve was created by varying the threshold from 0 to 1 (Fig. 4). The gray curve represents the rate at which the actual safe days were correctly identified, which increased as the threshold increased (i.e., fewer false alarms). The black curve represents the rate at which the actual dangerous days were correctly identified, which increased as the threshold decreased (i.e., fewer misses).
For wet-type cases, the intersection of the two curves was adopted as the threshold balancing the two hit rates, resulting in an optimal threshold of 0.05. The threshold is considerably smaller than 0.5 because the number of safe days is much larger than the number of dangerous days. This class imbalance poses a challenge for model training and evaluation; however, the dataset is not sufficiently large to downsample the majority class by discarding many safe-day samples. Therefore, we proceeded with the analysis as is, and left improvements for future work (see Discussion). Using a threshold of 0.05, the results were 47 hits, 139 false alarms, 2 misses, and 3279 correct no-event classifications. This indicates that if approximately two to three false alarms are allowed per roof-snow-falling event, risk can be detected with a success rate of over 90%.
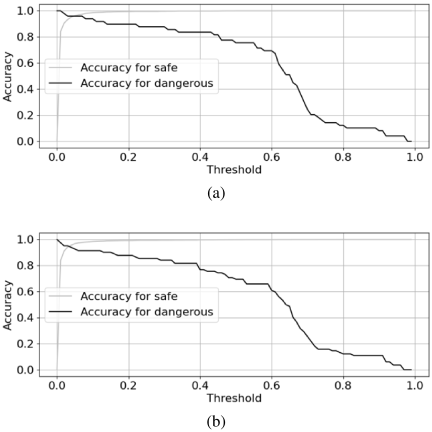
Fig. 4. Threshold-sweep curve for (a) wet type and (b) dry type.
For dry-type cases, the optimal threshold was 0.03, yielding 78 hits, 312 false alarms, four misses, and 5059 correct no-event judgments. This indicates that, if approximately three to four false alarms are allowed per roof-snow-falling event, the danger of roof snow falling can be detected, with a success rate of more than 90%. Overall, the fitting phase achieved relatively good accuracy in hazard estimation. The evaluation-data performance of the proposed models is evaluated in the following section.
3.3. Exploratory Evaluation of Model Performance
Because the results in Section 3.2 were evaluated using the same data used for training (i.e., without a separate test set), they do not directly indicate practical usefulness in real-time applications. Therefore, we conducted an exploratory evaluation by using separate temporal data.
In this study, the intended use case is that a model trained on past roof-snow-falling data is used to estimate real-time roof-snow-falling hazard. To reflect this assumption, data up to FY2023 were used for training, and data from FY2024 were used for evaluation. Fig. 5 shows the threshold sweep curves for the test data for wet-type roof snow falling. At the selected operating threshold of 0.08, defined by the intersection of the two curves, the test results were 6 hits, 1 miss, 59 false alarms, and 371 correct no-event judgments. It should be noted that because this threshold was selected using the FY2024 evaluation data, the results should be regarded as a post-hoc exploratory assessment rather than a fully independent test of generalization performance.
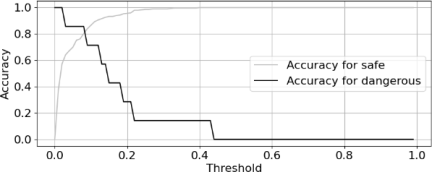
Fig. 5. Threshold-sweep curves for wet type using the FY2024 evaluation data.
As an example, Fig. 6 shows the temporal changes in the estimated roof-snow-falling hazard during a period of frequent snowfall in Aomori Prefecture on January 6, 2025. A roof-snow-falling accident occurred when the danger level reached 0.4. This correctly reproduced the increase in danger, because the danger level was lower before that date. As shown in Figs. 2(a) and 3(a), this was a typical wet-type roof-snow-falling case, in which the upper part of the snow cover metamorphosed into Melt Forms due to melting or rainfall when fresh snow was predominant. In such a typical wet-type case, the hazard increase can be estimated correctly even when using data not included in the training.
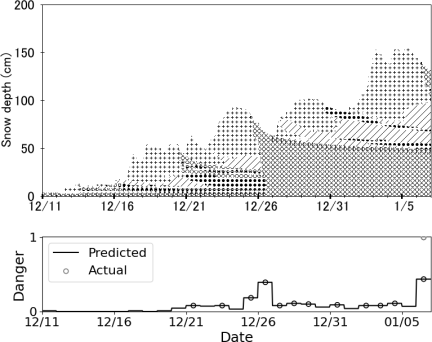
Fig. 6. Example of danger-level estimates obtained using SNOWPACK outputs and the Random Forest model in the exploratory evaluation (wet-type case at one site in Aomori on January 6, 2025). Open circles on the predicted line indicate days when the estimated danger level exceeded the threshold of 0.08.
In contrast, for dry-type roof snow falling, the test results were three hits, three misses, 200 false alarms, and 146 correct no-event judgments, indicating poor model performance and suggesting that a different approach is required (no figure).
Based on these results, we will continue to improve the practical usefulness of wet-type roof-snow-falling estimation through additional case-by-case verifications. For dry-type roof snow falling, it is necessary to begin by examining the conditions associated with roof-snow-falling accidents, for example, by analyzing the importance of the explanatory variables. In practice, wet-type roof snow falling is often considered dangerous when the temperature rises or rainfall occurs; however, no clear indicator has been established for dry-type roof snow falling, and estimating the danger level remains challenging.
3.4. Construction of Roof-Snow-Falling Hazard Prediction System
Based on the threshold-sweep analysis of the machine learning model described in Section 3.3 (exploratory evaluation), we assigned colors to the danger level in accordance with ISO 22324, consistent with the color scheme used in YukioroSignal. The color categories are operational categories for displaying danger scores and should not be interpreted as probability-calibrated categories of roof-snow-falling occurrence. The color categories were defined as follows:
-
・
Green: 0 to 0.02, very low danger score for roof-snow-falling events.
-
・
Yellow-green: over 0.02 to 0.05, low danger score.
-
・
Yellow: over 0.05 to 0.10, moderate-low danger score.
-
・
Orange: over 0.10 to 0.40, moderate danger score.
-
・
Red: over 0.40, high danger score.
Using a machine learning model trained on all cases available through the FY2023 winter and the color settings above, we applied the model to the FY2024 winter YukioroSignal data, which cover most of the heavy snowfall areas (Fig. 1), and calculated the spatial distribution of the roof-snow-falling hazard at each snow-depth observation point. As an example, the hazard distribution on January 7, 2025, is shown in Fig. 7. Roof-snow-falling accidents occurred in Hirosaki City and Fujisaki Town in Aomori Prefecture on that day, and in Aomori City on the following day (January 8); most areas in Aomori Prefecture were classified as yellow or orange. Although there is still room for improvement, the system reproduced the increase in roof-snow-falling hazard in certain cases, suggesting the potential for practical application with further refinement.
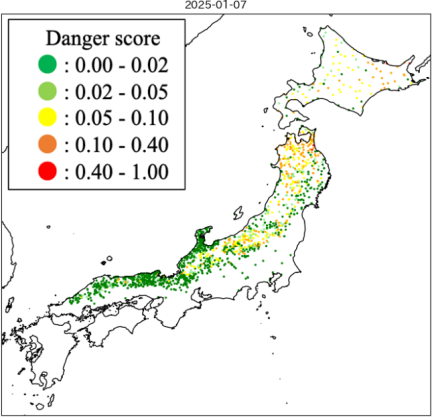
Fig. 7. Distribution of the roof-snow-falling hazard on January 7, 2025.
4. Discussion
4.1. Practicality and Limitations at the Present Stage
To evaluate the reproducibility of increases in risk of roof snow falling for practical use, we conducted an analysis using a test data split. The results showed some accuracy for the wet type, but poor accuracy for the dry type. In the full-winter analysis, many snow-covered areas tended to be assigned high danger levels for the wet type during late winter, that is, the snowmelt period. However, in practice, the risk is not necessarily high because snow removal and prior natural roof snow falling (not associated with accidents) can reduce the remaining roof snow; these effects are not captured in the current approach. In addition, because the study dataset did not include post-event periods after the accidental roof snow falling, the risk during the snowmelt season was not fully examined, and high-risk levels persisted because of the sustained LWC in the snowpack. Therefore, the proposed system may be useful for estimating wet-type roof-snow-falling hazards during severe winters.
While roof shape, slope, roofing materials, and snow guards are the major factors influencing roof snow falling, the inability to incorporate detailed conditions specific to each roof leads to limitations in accuracy. This model cannot be used to directly determine whether roof snow will fall from a specific house; rather, it is designed to estimate the meteorological and snow conditions that cause roof snow to fall on a regional or wide-area basis. Even if the model indicates a high risk, accidents are less likely to occur if a specific house is equipped with snow guards, has already had snow removed from its roof, or has already experienced roof snow falling. These circumstances can lead to false positives. The validation results indicate that determining an acceptable number of false positives per case for a given accuracy rate is necessary before this information is used operationally.
If it becomes possible to incorporate information on roof-snow-falling observations from specific houses, obtained using webcams and similar devices, along with roof slopes and shapes derived from 3D urban models, aerial LiDAR surveys, and municipal data, these data could enable the assessment of risk levels for individual houses in the future.
With regard to the “dry type,” verification of its generalizability has not yet reached a practical stage. According to the classification defined in Section 2.2, it is believed that even among cases classified as “dry type,” there are cases where roof snow fell due to the underside of the snowpack becoming wet as a result of heat transfer from the roof. Additionally, some cases classified as “dry type” may be associated with snow-cornice collapse, temperature inhomogeneity on roof surfaces, or roof snow falling as a result of snow removal. The poor model performance of the “dry type” is thought to stem from the difficulty of making estimates using meteorological data and the structure of natural snow accumulation as features, due to the involvement of individual house-specific conditions. More sophisticated approaches are required to achieve practical applications, such as analyzing observational data on the presence or absence of roof snow falling on houses with known structures in cold regions. Alternatively, it would be useful to focus the analysis on cases of snow falling from roofs classified as “dry type” that occurred under low-temperature conditions where it is unlikely that the interface had become wet.
Despite these limitations, the feature importance results of the dry-type model may provide useful clues regarding the conditions associated with dry-type accidents. The highly ranked variables were mainly related to snow amount, such as SWE and modeled snow depth, and snow instability, such as the values and positions of the stability indices. Snow-amount-related variables may be important because a larger amount of roof snow can increase the impact force and burial potential when a fall occurs, making accidents more likely. Instability-related variables may reflect unstable snow conditions caused by recent snowfall or weak layers, which may also favor the local failure of roof snow or the collapse of overhanging snow cornices. However, these interpretations should be regarded as hypotheses because the present model does not include roof-specific factors, such as roof shape, slope, roofing material, or snow guards.
Future improvements include refining the machine learning approach and increasing the amount of training data, as discussed in the next section; the incorporation of roof-specific information, as noted above, remains an important long-term issue.
4.2. Challenges in Machine Learning
In this study, only the Random Forest approach was evaluated. Random Forests were adopted because they have been used in related studies on wet-snow avalanche forecasting 25 and often perform well with limited training data and mixed, potentially nonlinear explanatory variables, while also providing interpretable feature importance. Model accuracy may be improved by testing and comparing multiple machine learning methods (e.g., \(k\)-nearest neighbors, Support Vector Machines, XGBoost), as well as by further refining the Random Forest model. In addition, the model accuracy could be improved through hyperparameter optimization, such as by tuning the number and depth of individual decision trees, the number of features considered at each split, and related settings. However, because the method is still under development and the amount of training data remains limited, we consider it premature to pursue detailed hyperparameter optimization or comparisons with other machine learning models at this stage. These analyses will be addressed in future studies as the dataset and methods are further developed.
In this study, the analysis was conducted primarily from the perspective of snow and ice research. Further development of this method, including collaborations with researchers specializing in machine learning and artificial intelligence, is important for improving its applicability.
4.3. Addressing Insufficient Training Data
Although a certain level of accuracy was achieved in the fitting phase of this study, there is room for improvement in the performance on the evaluation data, indicating that further accuracy improvements are necessary.
A major factor limiting the accuracy is the lack of training data. Therefore, a primary step toward improving the accuracy in future work is to increase the amount of training data. Possible approaches include collecting additional roof-snow-falling cases, incorporating more historical roof-snow-falling accident data, and increasing the effective size of the training dataset through data augmentation.
In this study, incidents were collected from newspaper articles and used as the training data. The dataset can be expanded by incorporating additional cases beyond newspaper-based records. If possible, it would be desirable to increase the dataset using non-public data related to roof snow falling; however, obtaining such data has practical hurdles, including the need for cooperation from local governments.
Under the current method, days with no accident records are classified as “safe,” even if unrecorded roof-snow-falling events occurred. This limits the accuracy of the risk estimation. An approach to avoid this is to identify roof-snow-falling event dates from webcam images and use the resulting information for analysis. Although events detected in this manner are not necessarily associated with accidents, this approach provides a direct means of determining whether an event has occurred. In addition, developing methods to detect the presence or absence of events from roof conditions using satellite or other remote-sensing data would also help increase data availability.
The Snow and Ice Disaster Database has compiled records of roof-snow-falling incidents since FY2000, which could be used to increase the amount of training data. In this case, retrospective (hindcast) calculations are required because these records predate the start of the YukioroSignal. Although historical AMeDAS data are readily available, snow-depth observations from other agencies are not available online. In addition, snow depth data from Snow Distribution Monitoring System 26 have only been available since 2014, which limits the application of the same calculation method. Alternative approaches include estimating snow depth without direct observations by applying elevation corrections to AMeDAS sites or using reanalysis data, such as JRA-55. However, because these approaches involve input data generation that differs from YukioroSignal, it is necessary to consider appropriate adjustments that account for these input differences.
When labeling days as safe or dangerous in the present approach, the number of safe days was much larger than the number of dangerous days, resulting in a class imbalance. As the amount of training data is limited, increasing the number of dangerous samples through data expansion may be preferable to downsampling the majority safe-day class to address this imbalance.
To increase the dataset, we recalculated SNOWPACK for the training cases using precipitation as input instead of snow depth (with snowfall estimated via rain/snow discrimination) and applied temperature perturbations of 1 °C and −1 °C. Including the original data increased the number of samples by a factor of four. As a result, the operating threshold (the intersection point of the threshold-sweep curves) increased, and the fitting-phase accuracy improved; however, the performance on the evaluation data decreased, indicating a stronger tendency toward overfitting. This may be because the augmented samples were highly similar to each other, and improved strategies for data augmentation are required. In the future, we plan to test other methods to address this imbalance, such as the synthetic minority oversampling technique (SMOTE). Furthermore, if the method discussed in this section is successfully implemented and a large amount of training data can be obtained, we will consider methods for addressing the imbalance using techniques such as random undersampling.
5. Conclusion
The results of this study, which investigated the use of YukioroSignal information and machine learning to estimate roof-snow-falling risk, indicate that a certain level of accuracy can be achieved in the fitting phase; however, there remains room for improvement in the performance on the evaluation data. A key contribution of this study is the estimation of the roof-snow-falling hazard using SNOWPACK-derived snow stratigraphy information in combination with meteorological variables and incident records. This approach showed promising performance for wet-type events, whereas its performance for dry-type events remained limited, indicating the need for further methodological development and additional data. In particular, because the influence of factors such as roof shapes and roofing materials on the mechanism of roof snow falling is not currently considered, determining how to incorporate these factors is important for improving accuracy in the future. As labeled training data are currently limited, it is necessary to incorporate more historical data. In addition, future work should consider using not only accident records, but also direct information on the presence or absence of roof snow falling, such as camera images, in the learning process. A prototype hazard distribution product has been developed, and we will continue to improve the prediction accuracy and examine effective ways to disseminate information.
Acknowledgments
This study is part of a project of the National Research Institute for Earth Science and Disaster Resilience (NIED), entitled “Research on improving snow and ice disaster resilience by upgrading observation and forecasting technology.” This research was supported by the Collaborative Research Project (2024-1) of the Research Institute for Natural Hazards and Disaster Recovery, Niigata University. We would like to thank the researchers and assistants at the Snow and Ice Research Center for providing information related to roof snow falling compiled from newspaper articles. The helpful comments and suggestions of anonymous reviewers are gratefully acknowledged. We used ChatGPT (OpenAI) to assist with English proofreading, wording refinement, and logical consistency checks. All revisions were carefully reviewed by the authors, who take full responsibility for the final text.
- [1] Cabinet Office, Government of Japan, “White paper disaster management in Japan 2022,” 2022. https://www.bousai.go.jp/en/documentation/white_paper/pdf/2022/R4_hakusho_english.pdf [Accessed April 10, 2026]
- [2] H. Hirashima, T. Iyobe, K. Kawashima, and H. Sano, “Development of a snow load alert system, ‘YukioroSignal’ for aiding roof snow removal decisions in snowy areas in Japan,” J. Disaster Res., Vol.15, No.6, pp. 688-697, 2020. https://doi.org/10.20965/jdr.2020.p0688
- [3] H. Hirashima, K. Kawashima, K. Motoya, and H. Sano, “Operation, expansion, and improvement of the snow load alert system ‘YukioroSignal’,” J. Disaster Res., Vol.19, No.5, pp. 741-749, 2024. https://doi.org/10.20965/jdr.2024.p0741
- [4] N. Wever et al., “Verification of the multi-layer SNOWPACK model with different water transport schemes,” Cryosphere, Vol.9, No.6, pp. 2271-2293, 2015. https://doi.org/10.5194/tc-9-2271-2015
- [5] H. Hirashima, “Numerical snowpack model simulation schemes for avalanche prediction in Japan,” Bull. Glaciol. Res., Vol.37S, pp. 31-41, 2019. https://doi.org/10.5331/bgr.18SW02
- [6] National Research Institute for Earth Science and Disaster Resilience, https://yukibousai.bosai.go.jp/obs/news/index.php [Accessed April 10, 2026]
- [7] J. Paine and L. Bruch, “Avalanches of snow from roofs of buildings,” Proc. Int. Snow Sci. Workshop (ISSW 1986), pp. 138-142, 1986.
- [8] X. Cao, H. Mo, G. Zhang, Q. Zhang, and F. Fan, “Experimental study on shear strength of roof–snow interfaces for prediction of roof snow sliding,” Buildings, Vol.14, No.4, Article No.1036, 2024. https://doi.org/10.3390/buildings14041036
- [9] T. Tomabechi, T. Ito, M. Takakura, and H. Yamaguchi, “Fundamental study on snow sliding on the roof,” J. Snow Eng. Jpn., Vol.11, No.2, pp. 88-95, 1995 (in Japanese with English abstract). https://doi.org/10.4106/jsse.11.88
- [10] G. Zhang et al., “Numerical investigations of snow load interference effects on multiple arched roofs under wind–snow coupled actions,” Appl. Sci., Vol.15, No.23, Article No.12414, 2025. https://doi.org/10.3390/app152312414
- [11] T. Tsutsumi et al., “Housing arrangement considering snow cover in heavy snow region—Experiments and numerical analysis on relationship between housing arrangement and snow distribution—,” J. Housing Res. Found. “JUSOKEN,” Vol.38, pp. 187-197, 2012 (in Japanese). https://doi.org/10.20803/jusokenronbun.38.0_187
- [12] R. E. Pawluk, M. Rezvanpour, Y. Chen, and Y. She, “A sensitivity analysis on effective parameters for sliding/melting prediction of snow cover on solar photovoltaic panels,” Cold Reg. Sci. Technol., Vol.185, Article No.103262, 2021. https://doi.org/10.1016/j.coldregions.2021.103262
- [13] M. Shimizu and T. Kimura, “Snow adhesion to roof sheets at sub-freezing temperatures,” J. Jpn. Soc. Snow Ice, Vol.54, No.3, pp. 269-275, 1992 (in Japanese with English abstract). https://doi.org/10.5331/seppyo.54.269
- [14] T. Chiba and T. Tomabechi, “Study on the evaluation of snow load on pitched roof,” J. Struct. Constr. Eng. (Trans. AIJ), Vol.66, No.539, pp. 37-42, 2001 (in Japanese with English abstract). https://doi.org/10.3130/aijs.66.37_1
- [15] T. Tsutsumi, “Snow and ice control on and around buildings—Summary of Japan Society for Snow Engineering Research Award 2010—,” Summ. JSSI JSSE Jt. Conf. Snow Ice Res. 2011, Session No.A1-11, 2011 (in Japanese). https://doi.org/10.14851/jcsir.2011.0.11.0
- [16] T. Tomabechi and T. Kobayashi, “A study on countermeasures against cornice on roof,” J. Snow Eng. Jpn., Vol.5, No.1, pp. 3-9, 1989 (in Japanese with English abstract). https://doi.org/10.4106/jsse.5.3
- [17] T. Chiba and M. Otsuki, “Study on snow cornice on eaves of flat roofs—Estimation method for forming location of the snow cornice based on roof shape coefficient considering wind speed dependence on the snow cornice—,” J. Struct. Constr. Eng. (Trans. AIJ), Vol.88, No.808, pp. 898-908, 2023 (in Japanese with English abstract). https://doi.org/10.3130/aijs.88.898
- [18] T. Sato, “Criterion for warning of accidents related to roof snow based on analysis of their occurrence rate in the inland of Yamagata Prefecture,” J. Snow Eng. Jpn., Vol.26, No.4, pp. 211-219, 2010 (in Japanese with English abstract).
- [19] Akita Prefecture (in Japanese). https://www.bousai-akita.jp/pages/index.html?article_id=99 [Accessed April 10, 2026]
- [20] Yamagata Prefecture (in Japanese). https://www.pref.yamagata.jp/020072/bosai/kochibou/bousaijouhou/setsugai/yukioroshi.html [Accessed April 10, 2026]
- [21] S. Kikuchi, K. Sugiura, and M. Hori, “Relationship between roof snow accidents and meteorological factors in Toyama Prefecture,” J. Jpn. Soc. Snow Ice, Vol.84, No.6, pp. 489-501, 2022 (in Japanese with English abstract). https://doi.org/10.5331/seppyo.84.6_489
- [22] M. Lehning, C. Fierz, B. Brown, and B. Jamieson, “Modeling snow instability with the snow-cover model SNOWPACK,” Ann. Glaciol., Vol.38, pp. 331-338, 2004. https://doi.org/10.3189/172756404781815220
- [23] C. Mitterer, F. Techel, C. Fierz, and J. Schweizer, “An operational supporting tool for assessing wet-snow avalanche danger,” Proc. Int. Snow Sci. Workshop (ISSW 2013), pp. 334-338, 2013.
- [24] C. Pérez-Guillén et al., “Data-driven automated predictions of the avalanche danger level for dry-snow conditions in Switzerland,” Nat. Hazards Earth Syst. Sci., Vol.22, No.6, pp. 2031-2056, 2022. https://doi.org/10.5194/nhess-22-2031-2022
- [25] M. Hendrick et al., “Automated prediction of wet-snow avalanche activity in the Swiss Alps,” J. Glaciol., Vol.69, No.277, pp. 1365-1378, 2023. https://doi.org/10.1017/jog.2023.24
- [26] T. Iyobe and K. Kawashima, “Development of quasi-real-time monitoring system for regional snow cover by utilizing multiple snow data,” J. Snow Eng. Jpn., Vol.36, No.1, pp. 1-13, 2020 (in Japanese with English abstract). https://doi.org/10.32120/jsej.36.1_1
- [27] “SNOWPACK: MET meteorological time series.” https://snowpack.slf.ch/doc-release/html/met_format.html [Accessed August 10, 2026]
This article is published under a Creative Commons Attribution-NoDerivatives 4.0 Internationa License.