
Paper:
Regional Impacts of Sea Surface Temperature on Snowfall During the 2024/2025 Early Winter in Japan
Kenta Tamura*,†
 and Tomonori Sato**
*Snow and Ice Research Center, National Research Institute for Earth Science and Disaster Resilience
187-16 Maeyama, Suyoshi, Nagaoka, Niigata 940-0821, Japan
†Corresponding author
**Faculty of Environmental Earth Science, Hokkaido University
Sapporo, Japan

Abnormally heavy snowfall occurred over central and northern Japan during the winter of 2024/2025, when sea surface temperature (SST) over the Sea of Japan was anomalously high in December to mid-January. We investigated how the SST influenced precipitation, snowfall, and snowpack characteristics during this period. Two numerical experiments using the Weather Research and Forecasting model were conducted: realistic and sensitivity experiments in which SST anomalies over the Sea of Japan were removed. We determined that high SST over the Sea of Japan in this winter enhanced precipitation and snowfall along the western coastal regions of Japan, although the response exhibited regional differences. Precipitation and snowfall increased more in northern Japan than in central Japan. Furthermore, snow density increased in northern Japan. These findings highlight that anomalously warm SST over the Sea of Japan can influence not only snowfall amount, but also snowpack characteristics, with spatial heterogeneity.
1. Introduction
Heavy snowfall during the winter of 2024/2025 brought widespread disruption and damage across Japan. From December to mid-January, precipitation was concentrated primarily along the western coastal regions from northern to western Japan, particularly in Aomori Prefecture in northern Japan and Niigata Prefecture in central Japan (Fig. 1). Aomori was one of the regions that experienced heavy precipitation, with a record-breaking monthly precipitation total of 318.0 mm observed in December 2024 1. According to observations at Aomori station, hourly snowfall rates exceeding 3 cm frequently occurred from December 2024 to mid-January 2025 (Fig. 2). On January 5, the maximum snow depth reached 139 cm, which was three times the climatological mean for the same calendar date. A snow survey report documented that snow depth and density in Aomori in January 2025 were higher than climatological means 2. In contrast, snow cover was absent even in January at low-elevation observation sites in Niigata, highlighting the regional contrast in snowfall conditions during winter. Considering the severe disruptions caused by intense snowfall in recent winters 3, understanding the factors that contribute to regional differences in snowfall and snowpack conditions is important for disaster prevention planning. Therefore, this study focuses on snowfall and snowpack in Japan during the early winter period from December 2024 to mid-January 2025.
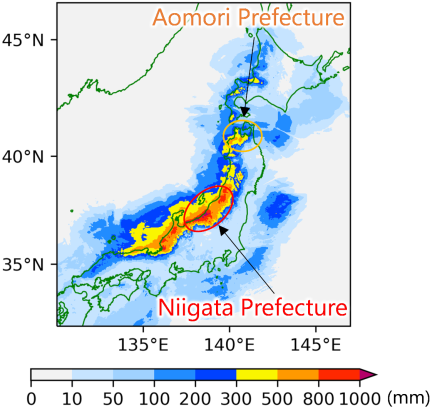
Fig. 1. Total precipitation from December 1, 2024, to January 20, 2025, based on radar/rain gauge analyzed rainfall data.
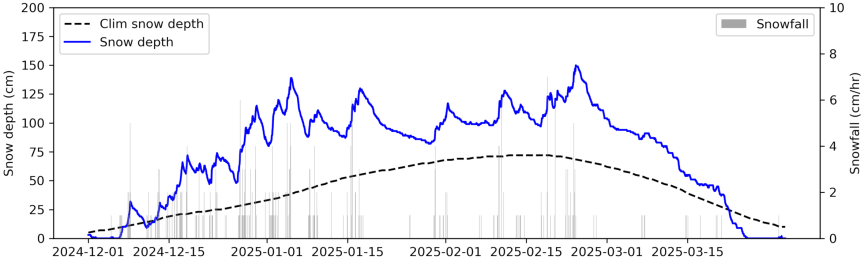
Fig. 2. Hourly snow depth (blue line) and snowfall (gray bars) observed at the Aomori station (AMeDAS). The black dashed line indicates the daily climatological mean snow depth for 1991–2020.
Heavy snowfall events occur because of various factors. Intense lake-effect snowstorms are frequently observed in the Great Lakes region of North America 4. Heat and moisture are supplied to the lower atmosphere when cold air passes over relatively warm lake surfaces, resulting in the formation of cloud bands that cause heavy snowfall. A similar energy supply plays a crucial role in heavy snowfall in Japan as the East Asian winter monsoon blows over the Sea of Japan and triggers cloud-band formation 5. In addition, a wind convergence zone known as the Japan Sea Polar Air Mass Convergence Zone (JPCZ) forms over the Sea of Japan to the east of the Korean Peninsula during the East Asian winter monsoon, primarily owing to orographic effects, and often leads to heavy snowfall 6. JPCZ, coupled with strong heat and moisture fluxes from the Sea of Japan, can produce heavy snowfall over Japan 7. Extratropical cyclones are another common cause of heavy snowfall in Japan. When an extratropical cyclone passes offshore, south of Japan, it can bring heavy snowfall to the eastern coastal areas of Japan 8.
Previous studies have suggested that recent heavy snowfall events in Japan may have been influenced by climate change 9,10. Oceanic warming enhances early winter snowfall by modulating atmospheric conditions through increased moisture supply to the atmosphere 11. However, the impact of oceanic warming on snow in Japan, including the relationship between the spatial distribution of sea surface temperature (SST) and regional snowfall and snowpack characteristics, remains poorly understood. This study aims to assess the impact of SST on heavy snowfall events that occurred from December 1, 2024, to January 20, 2025, using numerical simulations.
2. Data and Method
Winter precipitation in Japan is strongly influenced by SST over the Sea of Japan 5. SST over the Sea of Japan in the 2024/2025 early winter was higher than the climatological mean (Fig. 3). Therefore, to examine the impact of SST on snowfall and snowpack, we conducted two numerical experiments using the Weather Research and Forecasting (WRF) model version 4.4.1 12. One experiment involved a realistic simulation (CTL) using observed SST. In contrast, a sensitivity experiment (CLIM-SJ) was designed in which the positive SST anomaly over the Sea of Japan was removed. In the CLIM-SJ experiment, SST and sea ice concentrations over the Sea of Japan and surrounding areas (Fig. 3; green dots) were replaced with daily climatological values for 1991–2020, calculated for each calendar day. By comparing the results of the CTL and CLIM-SJ experiments, we investigated the influence of SST on the precipitation and snowpack over Japan from December 2024 to mid-January 2025.
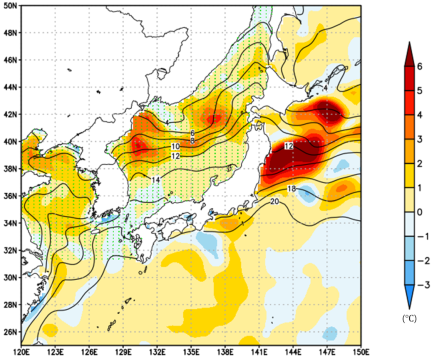
Fig. 3. Average SST from December 1, 2024, to January 20, 2025 (contour) and its difference from the daily climatology for the period 1991–2020. Green dots indicate the oceanic region modified in the sensitivity experiment.
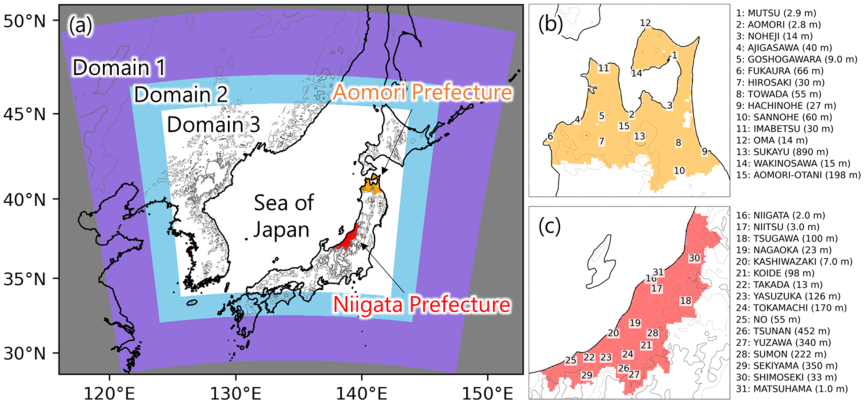
Fig. 4. (a) Domains of the numerical experiments. The purple area corresponds to the outer model domain (Domain 1; 18 km grid spacing), the light blue area corresponds to the intermediate domain (Domain 2; 6 km grid spacing), and the white area corresponds to the inner domain (Domain 3; 2 km grid spacing). The red and orange color indicate the area of Niigata and Aomori Prefectures, respectively. Thin and thick gray contours indicate elevations of 500 m and 1000 m, respectively. (b, c) Locations of observation sites recording snow depth from AMeDAS in (b) Aomori Prefecture and (c) Niigata Prefecture. Stations where precipitation had been missing for three days or more were excluded.
| Domain | Domain 1 | Domain 2 | Domain 3 |
| Horizontal resolution | 18 km | 6 km | 2 km |
| Grid number | \(145\times 130\) | \(313\times 268\) | \(763\times 628\) |
| Initial and boundary | ERA5 (atmosphere and land), DOISST (ocean) | 18 km runs | 6 km runs |
| Cumulus convection | Grell 3-D ensemble scheme 16 | Grell 3-D ensemble scheme 16 | None |
| Microphysics | Morrison 2–moment Scheme 17 | ||
| Longwave | Rapid radiative transfer model for longwave parameterization 18 | ||
| Shortwave | Dudhia shortwave scheme 19 | ||
| Boundary-layer process | Mellor–Yamada Nakanishi Niino (MYNN) Level 2.5 scheme 20 | ||
| Land surface | Noah-MP land surface model 21 | ||
Initial and boundary conditions were derived from the fifth-generation European Centre for Medium-Range Weather Forecasts global atmospheric reanalysis (ERA5), with a horizontal resolution of 0.25° 13. SST and sea ice distribution data were obtained from the National Oceanic and Atmospheric Administration (NOAA) 0.25° Daily Optimum Interpolation Sea Surface Temperature dataset (DOISST) 14. Three two-way nested domains were configured to cover Japan and the Sea of Japan with horizontal grid spacings of 18 km (Domain 1), 6 km (Domain 2), and 2 km (Domain 3) (Fig. 4(a)). The outer-domain (Domain 1) simulation was initialized on November 28, 2024, while the inner-domain simulations were initialized at 00 UTC on November 29 (Domain 2) and 00 UTC on November 30 (Domain 3), respectively, to ensure a sufficient spin-up period. The analysis period spans from December 1, 2024, to January 20, 2025, and encompasses major heavy snowfall events in early winter in Japan. The physical parameterization schemes employed in the experiments follow those used in a previous study 15 that successfully reproduced snowfall events in Japan (Table 1) 16,17,18,19,20,21. In the Noah-MP land surface model, snowfall density is primarily determined as a function of surface air temperature. The snowpack in this model is represented as a variable multilayer system with a maximum of three snow layers above the soil layers 21,22. The number and thickness of snow layers are determined dynamically according to the total snow depth. Snow depths of up to 0.05 m are represented as a single layer. When the snow depth is 0.05 m or above, the snow layer is represented as two layers, and when the snow depth is 0.15 m or above, the snow layer is represented as three layers. Temperatures of the snow and soil layers are calculated based on the surface energy balance. Snow water equivalent, snow depth, and snow density evolve through snowfall accumulation, melting, meltwater retention and percolation, refreezing, compaction owing to overlying snow, equi-temperature metamorphism, and melt metamorphism. As direct validation of snow density over Japan is limited by observational availability, this study focuses primarily on the relative differences in snowpack characteristics between the CTL and CLIM-SJ experiments. Moreover, we used station data from the Automated Meteorological Data Acquisition System (AMeDAS) (Figs. 4(b) and (c)) 23 and radar/rain gauge analyses of rainfall 24 to obtain an overview of precipitation and snow during winter in areas affected by snow-related disasters.
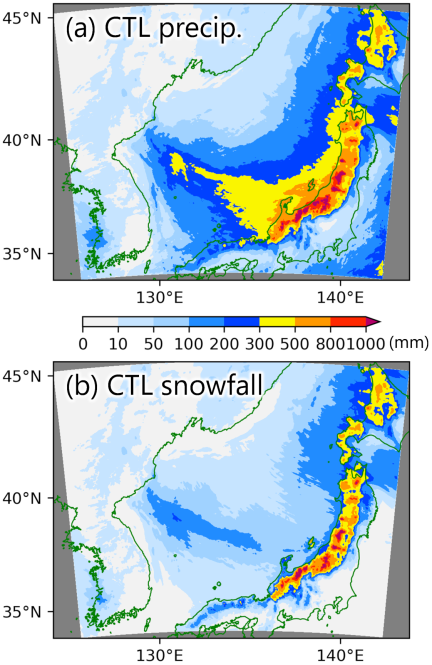
Fig. 5. Total precipitation and snowfall from December 1, 2024, to January 20, 2025. (a) Precipitation in the CTL experiment. (b) Snowfall in the CTL experiment.
3. Results
3.1. Numerical Experiments
This section assesses the performance of the CTL experiment in reproducing observed precipitation and snow depth. Fig. 5(a) demonstrates the accumulated precipitation from December 1, 2024, to January 20, 2025, derived from numerical simulations. During this period, precipitation exceeding 500 mm was recorded in Aomori and Niigata. In some coastal and inland areas, total precipitation exceeded 800 mm. Around Niigata, the total precipitation totals exceeded 1000 mm, particularly over high-elevation areas. The CTL experiment successfully reproduced the spatial precipitation patterns (Fig. 5(b)). Although the total precipitation exceeded 500 mm in Niigata, snowfall at low elevations was limited to 50–200 mm, indicating that precipitation in this area was dominated by rainfall. In contrast, snowfall exceeded 300 mm around Aomori, even in the low-elevation coastal areas, suggesting that snowfall was dominant. To highlight the regional characteristics of snowfall and snowpack in Aomori, the following analyses compare Aomori with Niigata, where precipitation during this winter was also greater than that in other regions.
Figure 6 summarizes the observational data and results of the CTL experiments in these prefectures. The model grid points closest to each observation site are presented for comparison (Figs. 4(b) and (c)). In Aomori, observed mean air temperatures were generally below 1 °C (Fig. 6(a)), and all observation sites had snow cover on January 20, 2025 (Fig. 6(c)). Snowfall was observed for 36 days from December 1, 2024, to January 20, 2025. In the CTL experiment, 42 days had daily snowfall greater than 1 mm, and the accumulated snowfall exceeded 300 mm, even in low-elevation coastal areas (Fig. 5(b)). These results indicate that snowfall dominated the precipitation in Aomori, even at low elevations. In contrast, in Niigata, many low-elevation sites experienced mean air temperatures above 3 °C, and snow cover was absent at some observation sites on January 20, 2025. At the Niigata station, the CTL experiment overestimated the number of snowfall days (observation: 9 days; CTL: 23 days with daily snowfall greater than 1 mm). Nevertheless, both the observations and model results indicate that snowfall in low-elevation areas in Niigata was less frequent than that in Aomori during the study period.
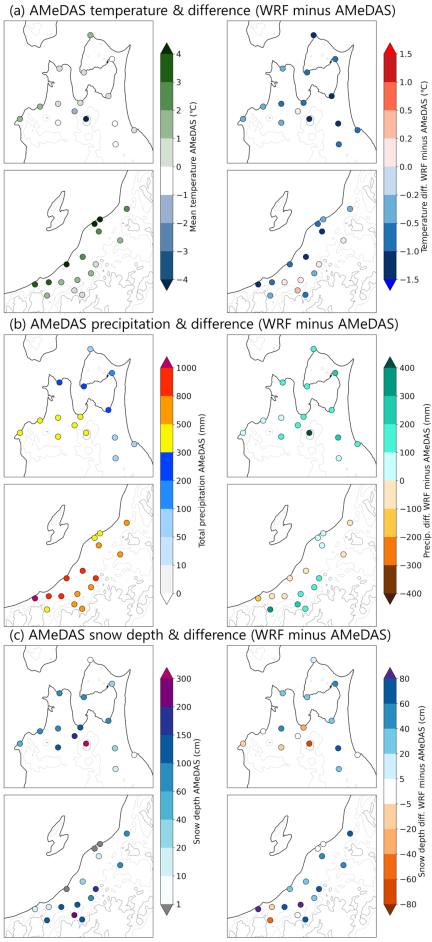
Fig. 6. (a) Mean air temperature and (b) total precipitation from December 1, 2024, to January 20, 2025, at AMeDAS stations and closest WRF grids. (c) Snow depth on January 20, 2025, after heavy snowfall in early winter.
Surface air temperatures in the CTL experiment were generally lower than those in Aomori and at low elevations in Niigata. The CTL experiment overestimated precipitation in Aomori, whereas in Niigata, the sign and magnitude of the model bias varied among the locations. Moreover, the reproducibility of snow depth differed among the observation sites. Although the CTL experiment did not accurately reproduce the absolute values of precipitation and snow depth, it reasonably captured the regional precipitation distribution. Therefore, we focused on the results based on the regional average of precipitation and snow characteristics in Aomori and Niigata.
3.2. Impact of SST Distribution on Precipitation and Snow
By comparing the CTL experiment with the CLIM-SJ experiment, we assess the impact of SST over the Sea of Japan on precipitation and snowfall during early winter. This section first summarizes the spatial patterns of SST, near-surface atmospheric conditions, surface heat fluxes, precipitation, snowfall, and snowpack density in the CTL experiment as well as the differences between the CTL and CLIM-SJ experiments (Figs. 7 and 8).
Figure 7(a) demonstrates the SST in the CTL experiment averaged over the period from December 1, 2024, to January 20, 2025. Fig. 7(b) presents the differences between the two experiments (CTL minus CLIM-SJ), confirming that the SST over the Sea of Japan in 2024/2025 winter were higher than the climatological mean SST. In particular, positive SST anomalies exceeding 3 °C were observed in the northern and western parts of the Sea of Japan.
Around Aomori, the temperature remained below 0 °C even in low-elevation areas (Fig. 7(c)). In contrast, around Niigata, the temperatures exceeded 0 °C except in high-elevation areas. Northwesterly winds predominated over the Sea of Japan, and wind convergence associated with JPCZ was evident. Surface air temperatures in the CTL experiment were more than 1.0 °C higher than in the CLIM-SJ experiment in two areas over the Sea of Japan: northeast of the Korean Peninsula and northwest of Aomori (Fig. 7(d)). In both regions, the wind differences converged toward regions with positive SST anomalies and their downwind areas (Fig. 7(b)). As Aomori was situated downwind of one of these positive SST anomaly regions, the surface air temperature in this area may have been locally enhanced by the influence of the high SST. In contrast to Aomori, no local temperature increases were observed in Niigata. In addition, both sensible and latent heat fluxes were large over the Sea of Japan west of Aomori in the CTL experiment, indicating strong heat and moisture transport from the sea surface to the lower atmosphere over the region upwind of Aomori (Figs. 7(e)–(h)). In contrast, the differences in the heat fluxes between the CTL and CLIM-SJ experiments near Niigata were small.
Next, we evaluate the impact of SST on precipitation and snowfall in Japan. The differences in the accumulated precipitation indicate that the precipitation amounts were larger in the CTL experiment than in the CLIM-SJ experiment along the western coastal regions from northern to central Japan (Fig. 8(a)). In Aomori (Fig. 4(a), orange), the accumulated precipitation increased by 48.7% in CTL (491.0 mm) relative to CLIM-SJ (330.1 mm). The percentage of change was calculated relative to the CLIM-SJ experiment as follows: \((\textrm{CTL} - \textrm{CLIM-SJ})/\textrm{CLIM-SJ}\). In Niigata (Fig. 4(a), red), the difference in precipitation was small, with only a 4.3% increase owing to warmed SST in 2024/2025 (CTL: 837.2 mm, CLIM-SJ: 802.9 mm). This is consistent with the small differences in heat and moisture supply over the Sea of Japan upstream of Niigata (Figs. 7(f) and (h)). A similar analysis of accumulated snowfall (Fig. 8(b)) indicates an increase of 42.8% in the Aomori in CTL (406.6 mm) relative to CLIM-SJ (284.7 mm), while snowfall in the Niigata (CTL: 560.5 mm, CLIM-SJ: 568.9 mm) exhibited minimal change (\(-\)1.5%). These results indicate that the impact of SST over the Sea of Japan during the 2024/2025 winter was spatially heterogeneous across the Japanese Archipelago, with local precipitation and snowfall changes occurring in specific regions associated with the distribution of SST anomalies.
Furthermore, to examine the impact of SST on snowpack characteristics, we evaluated the differences in snow density at 00 UTC on January 20, 2025, which represents the snowpack state after the major early-winter snowfall events. In this analysis, snow density is averaged only in grids where the land surface model could represent snowpack in three layers, specifically, where snow depths exceed 0.15 m. The results reveal that snow density increased locally by 11.1% in Aomori because of high SST, whereas only a small change of 0.28% was found in Niigata (Figs. 8(c) and (d)). These results suggest that in addition to increased snowfall amounts, high SST may have influenced the physical properties of the snowpack.
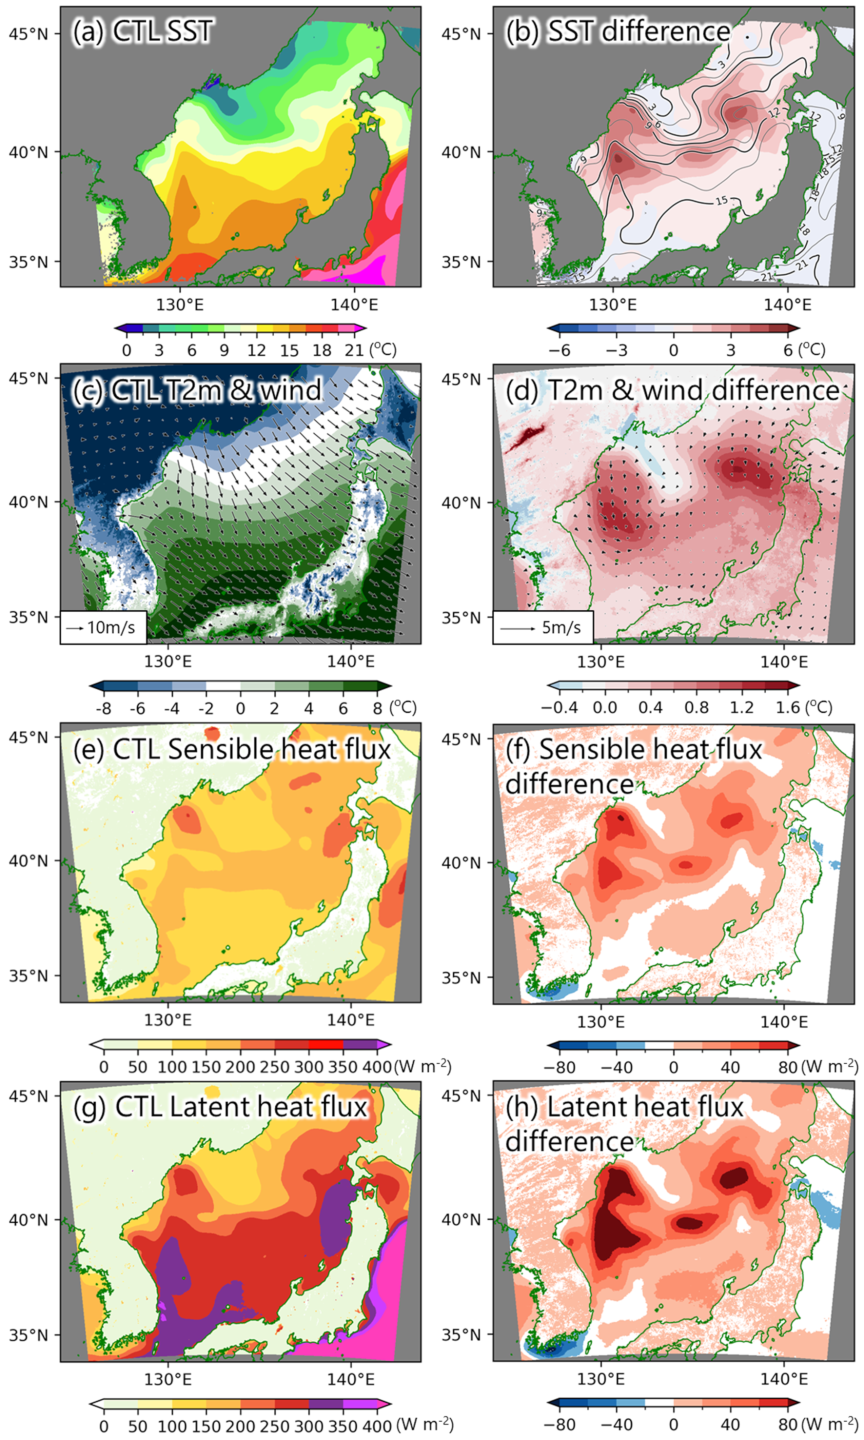
Fig. 7. Results of the CTL experiment and the differences between CTL and CLIM-SJ for the period from December 1, 2024, to January 20, 2025. (a) Average SST in CTL. (b) Average SST in CTL (contours) and SST differences between the experiments (shading). (c) Average surface 2-m air temperature (shading) and surface 10-m wind (vectors) in CTL. (d) Differences in the surface 2-m air temperature and the surface 10-m wind between the experiments. (e) Average upward sensible heat flux. (f) Differences in the sensible heat flux between the experiments. (g) Average upward latent heat flux. (h) Differences in the upward latent heat flux between the experiments.
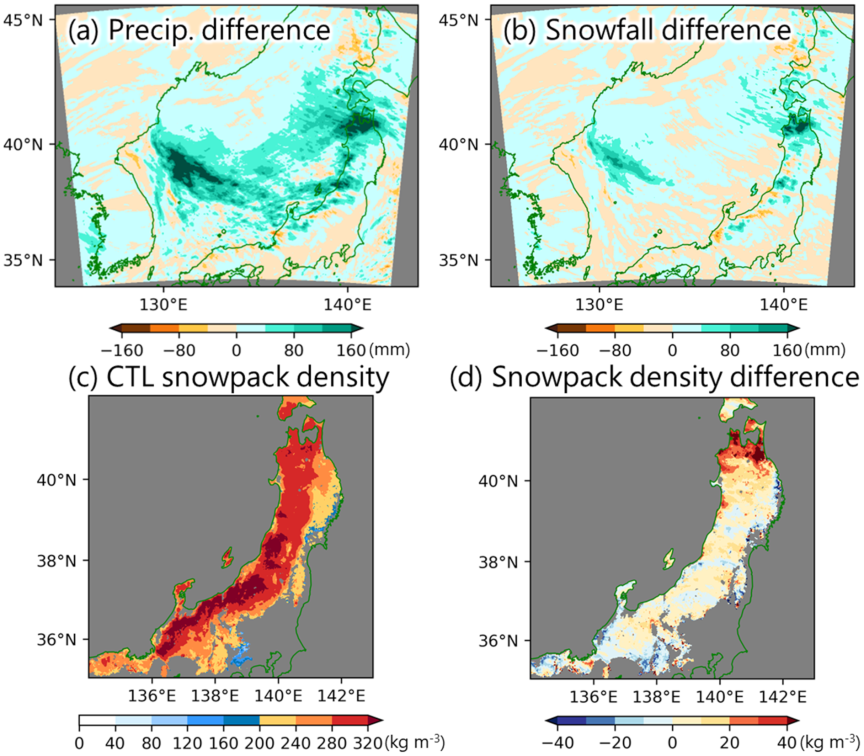
Fig. 8. Results of the CTL experiment and their differences (CTL minus CLIM-SJ) for the period from December 1, 2024, to January 20, 2025. (a) Differences in accumulated precipitation over the period. (b) Differences in accumulated snowfall over the period. (c) Snowpack density at 00 UTC on January 20, 2025. (d) Differences in the snowpack density between the experiments.
To investigate how the impact of SST depends on latitude and elevation, we created latitude–elevation cross-sections of snowfall amount and snow density along the Japanese Archipelago (Fig. 9). In this figure, to focus on the western coastal region of the Japanese Archipelago, where precipitation was particularly large during this winter, the longitudinal averages were computed only over land grid points where accumulated precipitation exceeded 300 mm, as presented in Fig. 5(a) (areas indicated by orange and red shading). Snowfall generally increased with elevation (Fig. 9(a)). In the differences, negative changes, meaning weaker snowfall in CTL compared with CLIM-SJ, appear in low-elevation areas (\({\leq}500\) m) around 36°N (Fig. 9(b)). This suggests that the increase in air temperature associated with high SST may have shifted the precipitation type from snow to rain in these regions. In contrast, around Aomori (40–41°N), snowfall was greater in the CTL than in the CLIM-SJ across all elevations, indicating that sufficiently cold conditions favorable for snowfall were maintained even at low elevations under the high SST conditions of this winter. Snow density exhibited a similar pattern with localized positive differences around Aomori (Fig. 9(d)). No significant changes were observed around Niigata (37°N). The concurrent increases in both snowfall amount and snow density suggest that localized warming associated with high SST may have altered the characteristics of snowfall and snowpacks around Aomori.
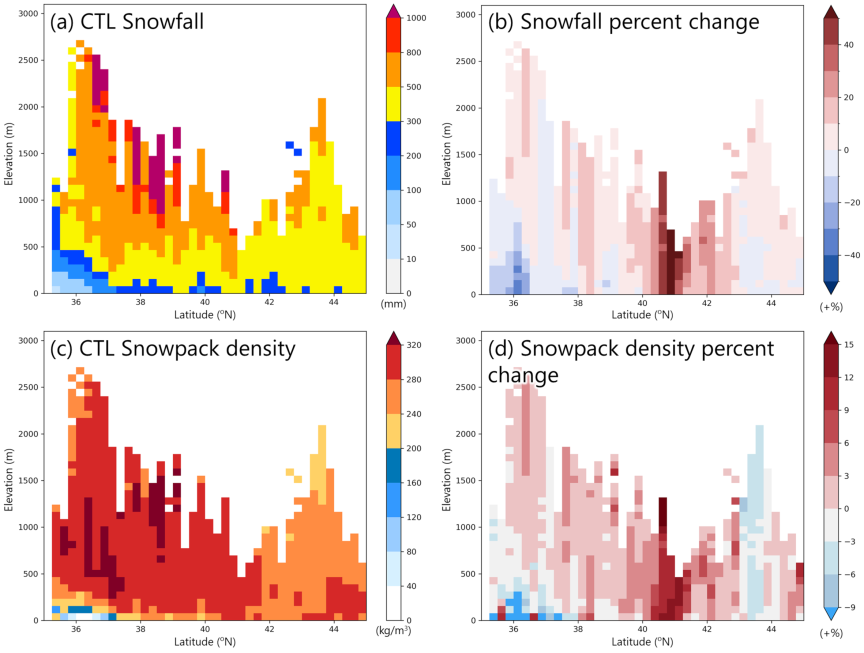
Fig. 9. Latitude–elevation cross sections of snowfall and snow density for the period from December 1, 2024, to January 20, 2025. Values are averaged in the longitudinal direction over land grid points of the Japanese Archipelago where accumulated precipitation exceeds 300 mm in Fig. 5(a). (a) Accumulated snowfall in the CTL experiment. (b) Percentage change in accumulated snowfall in CTL relative to CLIM-SJ. (c) Snow density at 00 UTC on January 20, 2025. (d) Percentage change in snow density in CTL relative to CLIM-SJ.
Finally, we compared the temporal evolution of snow depth and snowpack density, as well as the differences between the experiments in Aomori and Niigata. As snow accumulation was limited to the low-elevation areas of Niigata, the analysis was conducted separately for each elevation range. Fig. 10 presents the daily maximum snow depth and corresponding snowpack density averaged for each elevation range in Aomori and Niigata.
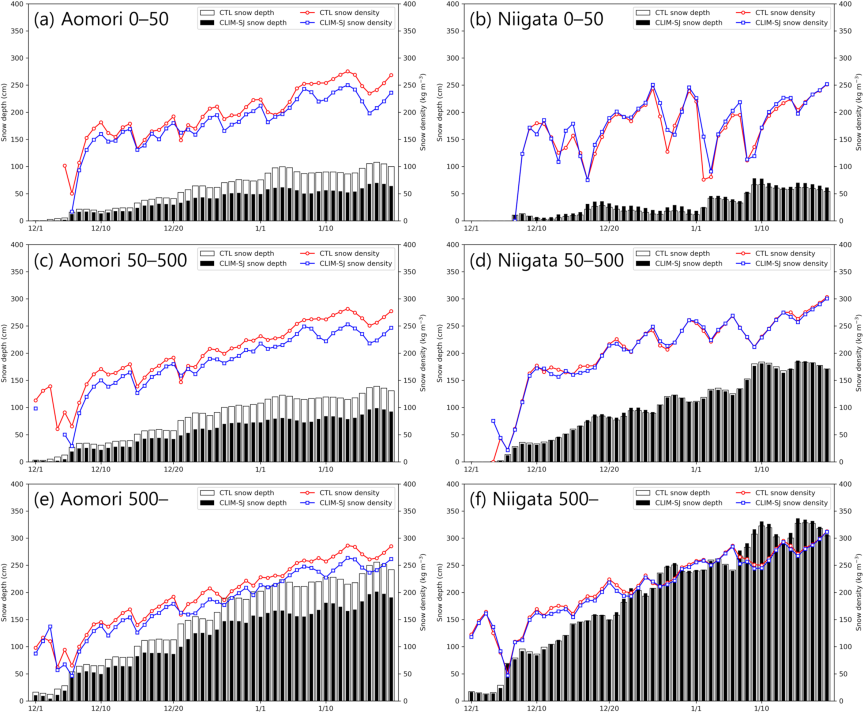
Fig. 10. Daily time series of area-averaged snow depth and snow density for each elevation range in Aomori and Niigata Prefectures (Fig. 4(a)). White and black bars indicate the daily maximum snow depth in the CTL and CLIM-SJ experiments, respectively. Red and blue lines indicate the snow density at the time of the daily maximum snow depth detected in the CTL and CLIM-SJ experiments, respectively. Panels (a) and (b) present averages for elevations of 0–50 m, panels (c) and (d) for 50–500 m, and panels (e) and (f) for elevations above 500 m.
In Aomori, both the snow depth and snowpack density gradually increased from December to January across all elevation ranges (Figs. 10(a), (c), and (d)). The differences in snowpack densities between the CTL and CLIM-SJ experiments increased during the latter half of the study period. A similar characteristic was observed for snow depth, with larger differences between the experiments toward the end of the period. In the first half of the period, when the snow depth increased, the snowpack density temporarily decreased to a similar level in both experiments. This temporary decrease likely reflects the addition of newly fallen snow with a relatively low density to the preexisting snowpack. In contrast, in the latter half of the study period, the difference in snowpack density between the experiments remained large, even when the snow depth increased. As the snow depth was larger in the CTL experiment than in the CLIM-SJ experiment during the latter half of the period, the larger snowfall in the CTL experiment may have promoted stronger compaction of the snowpack, contributing to the higher snowpack density.
In low-elevation areas of Niigata, there was large daily variation in snowpack density (Fig. 10). Snow depth was slightly greater in the CLIM-SJ experiment than in the CTL experiment, and the snowpack density was temporarily higher in the CLIM-SJ experiment on certain days. However, limited difference in snowpack density was observed between experiments during the latter half of the study period. In the high-elevation areas, both snow depth and snowpack density indicated limited difference between the experiments (Figs. 10(d) and (f)). These results suggest that, in Aomori, the larger snowfall amount in the CTL experiment promoted snowpack accumulation and compaction, leading to a higher snowpack density. In contrast, in Niigata, the snowfall difference between the experiments was relatively small; therefore, the difference in snowpack density was limited.
Based on two numerical experiments, we demonstrate that precipitation and snowfall during the early winter of 2024/2025 in Japan were influenced by SST conditions over the Sea of Japan. In particular, around Aomori in northern Japan, localized high SST increased surface air temperatures, leading to enhanced snowfall and changes in snow characteristics, as indicated by increased snow density.
4. Discussion and Summary
In this study, we investigated the impact of SST over the Sea of Japan on snowfall during the early winter of 2024/2025. During this winter, SST over the Sea of Japan were higher than the climatological mean, with local positive anomalies exceeding 3 °C. Numerical experiments revealed that high SST enhanced precipitation and snowfall over Japan, particularly along the western coastal regions of the Japanese Archipelago; however, the magnitude of the response exhibited regional differences. Notably, in Aomori, an increase in snow density was detected, in addition to locally enhanced snowfall.
Around Aomori during this winter, the locally high SST in the adjacent Sea of Japan likely increased the near-surface air temperature and moisture supply. Previous studies have revealed that warm SST over the Sea of Japan can enhance moisture fluxes, increase the instability of the lower atmosphere, and increase precipitation and snowfall along the Sea of Japan side of Japan 11,25. In the present study, sufficiently cold conditions for snowfall were maintained around Aomori, even under high SST conditions. Therefore, the enhanced moisture supply associated with warm SST was likely to increase snowfall rather than rainfall. Moreover, warm SST increased the temperature in the lower atmosphere. Consequently, the snow surface approaches its melting point, thereby promoting snowpack densification. In the Noah-MP, snow density evolves through compaction owing to the overlying snow, equi-temperature metamorphism, melt metamorphism, meltwater retention, and refreezing 21. Thus, the increase in snowpack density around Aomori may reflect the combined effects of enhanced snowfall, which increases compaction and warmer near-surface and snowpack conditions, favoring melt metamorphism and liquid-water-related densification. As this study did not directly diagnose the fresh-snow density, liquid water content, or individual snow metamorphism terms, the relative contributions of these processes remain uncertain and should be examined in future studies.
In contrast to Aomori, Niigata exhibited a relatively weak precipitation sensitivity to SST during winter. Fujiwara and Kawamura reported that positive SST anomalies over the western Sea of Japan could intensify precipitation along the JPCZ by enhancing low-level convergence, whereas positive SST anomalies over the central Sea of Japan could shift or weaken the convergence zone, thereby suppressing precipitation 26. These competing processes may partially account for the weak net SST impact around Niigata in this study, although they were not directly determined. Further investigations focusing on the temporal evolution of the JPCZ and its relationship with the spatial distribution of SST anomalies would help clarify why the net SST impact around Niigata was limited.
Many previous studies have highlighted that SST over the Sea of Japan influences the intensity of the JPCZ and precipitation over the western coastal regions of Japan 11,26,25. In recent years, extreme precipitation events have been associated with high SST in seas surrounding Japan 15,27. This study demonstrates that SST over the Sea of Japan affects not only the amount of precipitation, but also snow characteristics. As wet and heavy snow occurring under warm conditions can contribute to various snow-related disasters such as snow accretion and transportation disruptions 5, it is important to appropriately monitor and predict changes in snow quality and snowfall amount from a disaster prevention perspective. Therefore, investigating the relationship between the SST in adjacent oceans and the regional amount and characteristics of snowfall can provide important insights for assessing snow hazard risks under ongoing and future climate conditions.
Acknowledgments
This work was supported by the Arctic Challenge for Sustainability III (ArCS III; Grant No.JPMXD1720251001), SENTAN program (Grant No.JPMXD0722680734), and Japan Society for the Promotion of Science KAKENHI (Grant Nos.JP19H05697 and JP24H02228).
- [1] Aomori Local Meteorological Observatory, Japan Meteorological Agency, “Weather report for Aomori Prefecture in December 2024,” January 6, 2025 (in Japanese). https://www.jma-net.go.jp/aomori/pub-relations/pdf/summary/20250106_tukinotenkou.pdf [Accessed January 23, 2026]
- [2] H. Arakawa et al., “Report on the snow survey of the heavy snowfall in the Tsugaru region of Aomori Prefecture during the 2024/2025 winter season,” J. Jpn. Soc. Snow Ice, Vol.87, No.6, pp. 361-372, 2025 (in Japanese). https://doi.org/10.5331/seppyo.87.6_361
- [3] S. Yamaguchi et al., “Overview: Results of snow and ice disaster mitigation conducted by the National Research Institute for Earth Science and Disaster Resilience,” J. Disaster Res., Vol.19, No.5, pp. 733-740, 2024. https://doi.org/10.20965/jdr.2024.p0733
- [4] R. L. Peace Jr. and R. B. Sykes Jr., “Mesoscale study of a lake effect snow storm,” Mon. Weather Rev., Vol.94, No.8, pp. 495-507, 1966. https://doi.org/10.1175/1520-0493(1966)094<0495:MSOALE>2.3.CO;2
- [5] S. Manabe, “On the modification of air-mass over the Japan Sea when the outburst of cold air predominates,” J. Meteorol. Soc. Jpn., Ser. II, Vol.35, No.6, pp. 311-326, 1957. https://doi.org/10.2151/jmsj1923.35.6_311
- [6] T. Asai, “Meso-scale features of heavy snowfalls in Japan Sea coastal regions of Japan,” Tenki, Vol.35, No.3, pp. 156-161, 1988 (in Japanese).
- [7] Y. Tachibana et al., “High moisture confluence in Japan Sea polar air mass convergence zone captured by hourly radiosonde launches from a ship,” Sci. Rep., Vol.12, Article No.21674, 2022. https://doi.org/10.1038/s41598-022-23371-x
- [8] I. Takano, “Analysis of an intense winter extratropical cyclone that advanced along the south coast of Japan,” J. Meteorol. Soc. Jpn., Ser. II, Vol.80, No.4, pp. 669-695, 2002. https://doi.org/10.2151/jmsj.80.669
- [9] H. Kawase, S. I. Watanabe, T. Nakaegawa, and Y. Imada, “Heavy snowfall has already been enhanced by anthropogenic global warming in Japan,” SOLA, Vol.20, pp. 167-176, 2024. https://doi.org/10.2151/sola.2024-023
- [10] K. Tamura and T. Sato, “Evaluating how historical climate change affected a heavy snowfall event in northern Japan in mid-December 2021 using two pseudo global warming methods,” J. Geophys. Res.: Atmos., Vol.129, No.24, Article No.e2024JD041553, 2024. https://doi.org/10.1029/2024JD041553
- [11] H. Kawase, Y. Imada and S. Watanabe, “Impacts of historical atmospheric and oceanic warming on heavy snowfall in December 2020 in Japan,” J. Geophys. Res.: Atmos., Vol.127, No.21, Article No.e2022JD036996, 2022. https://doi.org/10.1029/2022JD036996
- [12] W. C. Skamarock et al., “A description of the advanced research WRF model version 4.3,” National Center for Atmospheric Research (NCAR) Technical Notes, No.NCAR/TN-556+STR, 2021. https://data.ucar.edu/dataset/a-description-of-the-advanced-research-wrf-model-version-4-3 [Accessed March 26, 2026]
- [13] H. Hersbach et al., “The ERA5 global reanalysis,” Q. J. R. Meteorol. Soc., Vol.146, No.730, pp. 1999-2049, 2020. https://doi.org/10.1002/qj.3803
- [14] B. Huang et al., “Improvements of the Daily Optimum Interpolation Sea Surface Temperature (DOISST) version 2.1,” J. Clim., Vol.34, No.8, pp. 2923-2939, 2021. https://doi.org/10.1175/JCLI-D-20-0166.1
- [15] H. Hirata, K. Tamura, T. Morioka, and T. Sato, “Mechanisms behind the record-breaking snowfall in Obihiro, Hokkaido, Japan, in February 2025: Roles of atmospheric environment and a marine heatwave,” SOLA, Vol.21C, pp. 1-9, 2025. https://doi.org/10.2151/sola.21c-001
- [16] G. A. Grell and D. Dévényi, “A generalized approach to parameterizing convection combining ensemble and data assimilation techniques,” Geophys. Res. Lett., Vol.29, No.14, pp. 38-1-38-4, 2002. https://doi.org/10.1029/2002GL015311
- [17] H. Morrison, G. Thompson, and V. Tatarskii, “Impact of cloud microphysics on the development of trailing stratiform precipitation in a simulated squall line: Comparison of one- and two-moment schemes,” Mon. Weather Rev., Vol.137, No.3, pp. 991-1007, 2009. https://doi.org/10.1175/2008MWR2556.1
- [18] E. J. Mlawer, S. J. Taubman, P. D. Brown, M. J. Iacono, and S. A. Clough, “Radiative transfer for inhomogeneous atmospheres: RRTM, a validated correlated-k model for the longwave,” J. Geophys. Res.: Atmos., Vol.102, No.D14, pp. 16663-16682, 1997. https://doi.org/10.1029/97JD00237
- [19] J. Dudhia, “Numerical study of convection observed during the winter monsoon experiment using a mesoscale two-dimensional model,” J. Atmos. Sci., Vol.46, No.20, pp. 3077-3107, 1989. https://doi.org/10.1175/1520-0469(1989)046<3077:NSOCOD>2.0.CO;2
- [20] M. Nakanishi and H. Niino, “An improved Mellor–Yamada Level-3 model: Its numerical stability and application to a regional prediction of advection fog,” Bound.-Layer Meteorol., Vol.119, No.2, pp. 397-407, 2006. https://doi.org/10.1007/s10546-005-9030-8
- [21] G.-Y. Niu et al., “The community Noah land surface model with multiparameterization options (Noah-MP): 1. Model description and evaluation with local-scale measurements,” J. Geophys. Res.: Atmos., Vol.116, No.D12, Article No.D12109, 2011. https://doi.org/10.1029/2010JD015139
- [22] N. R. Hedstrom and J. W. Pomeroy, “Measurements and modelling of snow interception in the boreal forest,” Hydrol. Process., Vol.12, Nos.10-11, pp. 1611-1625, 1998. https://doi.org/10.1002/(SICI)1099-1085(199808/09)12:10/11%3C1611::AID-HYP684%3E3.0.co;2-4
- [23] Japan Meteorological Agency, “Automated meteorological data acquisition system (AMeDAS).” https://www.jma.go.jp/jma/en/Activities/amedas/amedas.html [Accessed March 26, 2026]
- [24] Japan Meteorological Agency, “Radar/raingauge-analyzed precipitation,” 2018. https://www.jma.go.jp/jma/en/Activities/qmws_2018/Presentation/3.1/Radar%20Rain%20Gauge-Analyzed%20Precipitation_revised.pdf [Accessed March 26, 2026]
- [25] T. Sato and S. Sugimoto, “A numerical experiment on the influence of the interannual variation of sea surface temperature on terrestrial precipitation in northern Japan during the cold season,” Water Resour. Res., Vol.49, No.11, pp. 7763-7777, 2013. https://doi.org/10.1002/2012WR013206
- [26] K. Fujiwara and R. Kawamura, “Contradictory impacts of anomalous sea surface temperatures over the Sea of Japan in the Japan-Sea Polar-Airmass Convergence Zone,” SOLA, Vol.21, pp. 293-301, 2025. https://doi.org/10.2151/sola.2025-036
- [27] K. Takemura, S. Maeda, and R. Kawamura, “An underlying factor of increasing early winter precipitation in the Hokuriku region of Japan in recent decades,” Atmos. Sci. Lett., Vol.25, No.7, No.e1229, 2024. https://doi.org/10.1002/asl.1229
This article is published under a Creative Commons Attribution-NoDerivatives 4.0 Internationa License.