
Paper:
Characteristics of the Expansion of Land Below Sea Level due to Coseismic Subsidence for Great Earthquakes Along the Nankai Trough
Yuji Dohi*,†
 , Hiromitsu Nakamura*, Hiroyuki Fujiwara*, and Sho Akagi**
*National Research Institute for Earth Science and Disaster Resilience
3-1 Tennodai, Tsukuba, Ibaraki 305-0006, Japan
†Corresponding author
**Mitsubishi Electric Software Corporation
Tsukuba, Japan

Effective preparedness and countermeasures against great earthquakes require considering not only single-hazard scenarios, such as strong motion, but also multi-hazard situations and their cascading effects. This study focuses on coseismic subsidence, especially the resulting expansion of land below sea level. Land below sea level cannot naturally drain water, so it is vulnerable to the long-term flooding. There are concerns that long-term damage may occur not only from tsunami inundation caused by great earthquakes but also from other inundation caused by disasters other than earthquakes, such as storm surges and river flooding. To understand the characteristics of the expansion of land below sea level, we analyzed the likelihood and extent of such expansion due to coseismic subsidence for great earthquakes along the Nankai Trough. Additionally, prior research has examined a limited number of earthquake scenarios and does not adequately consider the variation across great earthquakes along the Nankai Trough in terms of magnitude, source area extension, and the number of occurrences that compose a seismic cycle. Considering this variety, we analyzed coseismic subsidence for more than 900,000 occurrence patterns. We then discussed the likelihood of land falling below sea level and their total areas for four regions using two different approaches. From the viewpoint of multi-hazards and their cascading effects, by comprehensively addressing our results and hazard information on possible inundation areas attributable to other hazards, we expect that the results of this study will contribute to effective preparedness and countermeasures against long-term flooding, such as determining which areas require countermeasures and prioritizing investments.
1. Introduction
Great earthquakes have multi-hazard effects (“multi-hazards”) such as tsunamis, coseismic deformation, liquefaction, and landslides. Effective preparedness and countermeasures against great earthquakes require hazard and risk assessment, not only for single-hazard scenarios, such as strong motion, but also for multi-hazards and their cascading effects. This study focuses on coseismic subsidence related to great earthquakes along the Nankai Trough, especially the resulting expansion of land below sea level.
In southwest Japan, the oceanic Philippine Sea Plate is subducting beneath the continental plate along the Nankai Trough. Megathrust earthquakes have occurred repeatedly along the Nankai Trough (Fig. 1). The Earthquake Research Committee (ERC) issued a long- term evaluation of seismic activity in the Nankai Trough based on research and observations 1. Recently, the ERC reported two ranges for the probability of \(M\)8- to \(M\)9-class earthquakes occurring along the Nankai Trough within the next 30 years as of January 1, 2026: 60% to 90% or more and 20% to 50%, respectively 3. The ERC also issued probabilistic seismic 4 and tsunami 2 hazard assessments based on the long-term evaluation. The Cabinet Office has also simulated strong motion and tsunamis using a deterministic approach 5 and estimated damages 6.
Coseismic subsidence is a major multi-hazard caused by great earthquakes. Coseismic subsidence causes the expansion of land below sea level, making it vulnerable to tsunamis, storm surges, and river flooding. Land below sea level cannot naturally drain water and, therefore, is vulnerable to long-term flooding.
During the 1946 Showa-Nankai earthquake (\(M\) 8.0), the resulting tsunami subsided and flooded a wide area in Kochi City 7,8,9. It took approximately one month to resolve the inundation, which caused significant disruption to residents’ lives 9. During the 2011 Tohoku earthquake (\(\mathit{M}_{\mathrm{w}}\) 9.0), it was reported that land below sea level along the coast of Miyagi Prefecture increased 3.4 times due to coseismic subsidence 10. Drainage operations were conducted in flooded areas for over 122 days 11. Other countries have also reported widespread flooding resulting from coseismic subsidence, such as the 1960 Chilean earthquake (\(\mathit{M}_{\mathrm{w}}\) 9.5) 12 and the 2004 Sumatra–Andaman earthquake (\(\mathit{M}_{\mathrm{w}}\) 9.3) 13. Therefore, the damage caused by coseismic subsidence is an important national and international problem.
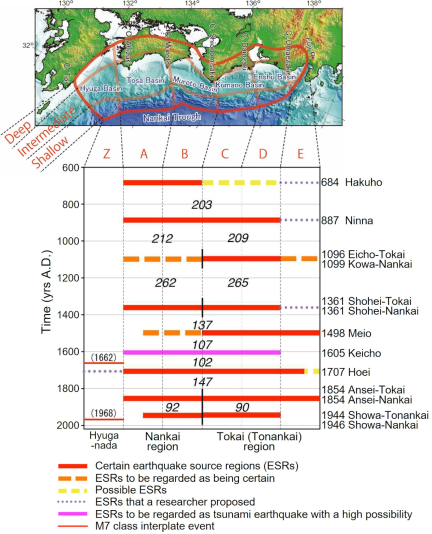
Fig. 1. Segmentation of the seismogenic zone for interplate earthquakes along the Nankai Trough and space-time history of occurrence patterns of earthquake source regions (adapted from the ERC 1,2).
Focusing on long-term flooding resulting from coseismic subsidence for great earthquakes along the Nankai Trough, Maki et al. 14 discussed disaster response and recovery strategies in Kochi City. Sato et al. 15 evaluated the risk of long-term flooding by comparing land below sea level before and after the Nankai Trough earthquake. The Cabinet Office 6 qualitatively indicated the damage caused by long-term flooding resulting from coseismic subsidence. Kochi 9,16 and Hyogo Prefectures 17 focused on the largest possible earthquake along the Nankai Trough, estimated damages caused by long-term flooding resulting from coseismic subsidence, and indicated countermeasures against it.
These studies and countermeasures are based on a limited number of earthquake scenarios. According to the ERC 1, great earthquakes occurring along the Nankai Trough vary in terms of magnitude, source area extension, and the number of occurrences that compose a seismic cycle. Therefore, we believe that this variation must be considered when discussing coseismic subsidence. Considering the variety of great earthquake occurrences along the Nankai Trough, we have been researching the characteristics of coseismic vertical deformation. We recently reported on the characteristics of coseismic uplift at ports 18. This previous research 18 analyzed whether emergency relief ships could berth at ports affected by coseismic uplift and discussed the extent to which ports function as disaster-management bases. However, concerns regarding coseismic subsidence remain. Based on past damage caused by coseismic subsidence, previous research, and related countermeasures, we recognized the need to analyze the likelihood and extent of land falling below sea level due to coseismic subsidence.
This study examined coseismic subsidence following great earthquakes along the Nankai Trough, focusing on the expansion of land below sea level. A key objective of this study is to understand the characteristics of coseismic subsidence in low-lying areas, not for a specific scenario, but for a variety of occurrences of great earthquakes along the Nankai Trough. Furthermore, this study focused on coseismic subsidence from the viewpoint not of a specific location but of the areal extent. Post-seismic deformation was outside the scope of this study. Section 2 describes the method of expressing various occurrences of great earthquakes along the Nankai Trough and analyzing the land falling below sea level. Section 3 describes the study’s four areas of focus. Section 4 presents the results regarding the likelihood and extent of land falling below sea level due to coseismic subsidence for great earthquakes along the Nankai Trough. Section 5 discusses the likelihood and total area below sea level obtained using two approaches. In addition, we discuss effective preparedness and countermeasures against long-term flooding as well as the limitations of this study and future prospects. Finally, Section 6 concludes the paper.
2. Method
2.1. Expression of Various Occurrences of Great Earthquakes Along the Nankai Trough
We recently examined coseismic uplift at ports for more than 900,000 occurrence patterns of great earthquakes along the Nankai Trough, considering variations in magnitude, source area extension, and the number of occurrences that compose a seismic cycle 18. This study used the same expression method as in our previous study 18. In this section, we briefly describe the expression method.
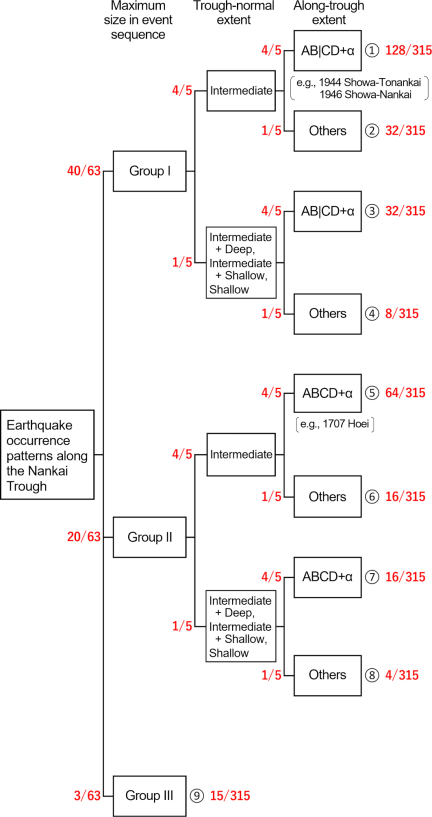
Fig. 2. Category of ESR occurrence patterns 18. Fractional numbers indicate relative weight ratios.
First, we constructed 83 earthquake source regions (ESRs) and 3,480 characterized earthquake fault models (CEFMs) based on the 18 segments of the subducting Philippine Sea Plate geometry (Fig. 1). To express the heterogeneity in the slip distribution, large and super-large slip areas (twice and four times the average slip, respectively) were introduced into the CEFMs. The moment magnitudes of the CEFMs ranged from \(\mathit{M}_{\mathrm{w}}\) 7.7 to \(\mathit{M}_{\mathrm{w}}\) 9.2. Next, to express the variations in magnitude, source area extension, and number of occurrences, we constructed 180 combinations of ESRs (ESR occurrence patterns) and 916,669 combinations of CEFMs (CEFM occurrence patterns) for the next event sequence. The ESR occurrence patterns were categorized into nine patterns, each assigned a relative weight ratio (ratio of relative occurrence probability), as shown in Fig. 2. The weights assigned to each category were equally distributed among the ESR occurrence patterns included in the category. Similarly, the weights assigned to the ESR occurrence patterns were distributed equally among the CEFM occurrence patterns.
2.2. Analysis of the Land Falling Below Sea Level
This study used elevation and coseismic deformation data for 3,480 CEFMs calculated by Nakamura et al. 19. They calculated coseismic deformation over a nesting grid system with a minimum grid size of 10 m using the analytical solution for a semi-infinite homogeneous elastic body 20 for the purpose of simulating tsunami propagation and run-up. Using these data, we analyzed the likelihood that the elevation would fall below sea level for 916,669 CEFM occurrence patterns. We focused on the land falling below sea level due to coseismic subsidence for the next Nankai Trough event sequence, which is composed of combinations of CEFMs. We did not consider the order in which earthquakes (CEFMs) occurred or the cumulative deformation caused by each earthquake (CEFM) because discussing these factors requires considering temporal changes in crustal deformation, including post-seismic deformation.
We focused on the land that subsided from above to below sea level due to coseismic deformation \(h\) [m], expressed as
At a certain 10-m grid \(i\) with \(H_{0}\geq 0\), the conditional exceedance probability \({P_{i}(H<0)}\) that the elevation falls below sea level when a great earthquake occurs along the Nankai Trough is expressed as
3. Study Area
3.1. Overview of the Areas
This study focused on the following four 10-m grid domains from among those where Nakamura et al. 19 calculated coseismic deformation:
-
(a)
Kochi City and surrounding area (Kochi Plain)
-
(b)
Osaka City and surrounding area (Osaka Plain)
-
(c)
Nagoya City and surrounding area (Nobi Plain)
-
(d)
Nishio City and surrounding area (Nishimikawa Plain)
The characteristics of these four domains are as follows:
-
・
Low-lying areas where coseismic subsidence was expected with reference to the distribution of a mean vertical deformation from the 3,480 CEFMs (Fig. 3)
-
・
Low-lying areas where the population and capital stock are concentrated
-
・
Existing land below sea level
Osaka City and Nagoya City are areas with concentrated population and capital stock and widely distributed land below sea level.
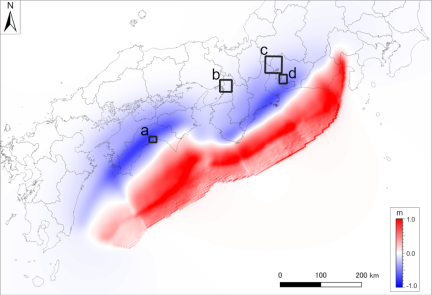
Fig. 3. Selected domains and distribution of mean vertical deformation from the 3,480 CEFMs. (a) Kochi City and surrounding area, (b) Osaka City and surrounding area, (c) Nagoya City and surrounding area, and (d) Nishio City and surrounding area.
3.2. Coseismic Subsidence in Historical Records
This section briefly reviews historical records of coseismic subsidence in the four 10-m grid domains. Here, we focus on the three most recent seismic cycles: (1) the 1944 Showa-Tonankai (\(M\) 7.9) and 1946 Showa-Nankai earthquakes (\(M\) 8.0), (2) the 1854 Ansei-Tokai (\(M\) 8.4) and 1854 Ansei-Nankai earthquakes (\(M\) 8.4), and (3) the 1707 Hoei earthquake (\(M\) 8.6). Historical records may contain errors in the transmission of information and factors other than coseismic deformation. Since no clear records could be found for Osaka City and surrounding area (rectangle (b) in Fig. 3), we focused on the historical records in the other three domains.
3.2.1. The 1944 Showa-Tonankai and 1946 Showa-Nankai Earthquakes
For the 1944 Showa-Tonankai earthquake, subsidence of 0.3 to 1.0 m in the lower reaches of the Kiso River (rectangle (c) in Fig. 3) 21 and 0.2 to 0.35 m in the coastal areas along the Mikawa Bay and Ise Bay (rectangles (c) and (d) in Fig. 3) 22 were reported. For the 1946 Showa-Nankai earthquake, 1.2 m subsidence was reported in Kochi City (rectangle (a) in Fig. 3) 22,23,24,25.
3.2.2. The 1854 Ansei-Tokai and 1854 Ansei-Nankai Earthquakes
For the 1854 Ansei-Tokai earthquake, subsidence was reported in the lower reaches of the Kiso River (rectangle (c) in Fig. 3) 21 and Hazu-gun (Hazu District; rectangle (d) in Fig. 3) 22,25. For the 1854 Ansei-Nankai earthquake, subsidence of approximately 1 m in Kochi City (rectangle (a) in Fig. 3) was reported 22,23,24,25.
3.2.3. The 1707 Hoei Earthquake
Subsidence was reported in Kochi City (rectangle (a) in Fig. 3) 22,23,24,26; the lower reaches of the Kiso River (rectangle (c) in Fig. 3) 21; and Higashibata, Yonezu, Nakane, and Ookashinden (rectangle (d) in Fig. 3) 26. In Kochi City, subsidence of approximately 2 m 24, 2.2 m 26, and 2 m or greater 22 was reported.
4. Results
Figure 4 shows the distribution of the conditional exceedance probability \({P_{i}(H<0)}\) that the elevation will fall below sea level when a great earthquake occurs along the Nankai Trough.
Figure 4(a) (Kochi City and surrounding area) shows a significant expansion of land below sea level in the inner reaches of Urado Bay. Compared with the other domains (Figs. 4(b)–(d)), a relatively high \({P_{i}(H<0)}\) accounted for a large proportion of the expanded land below sea level.
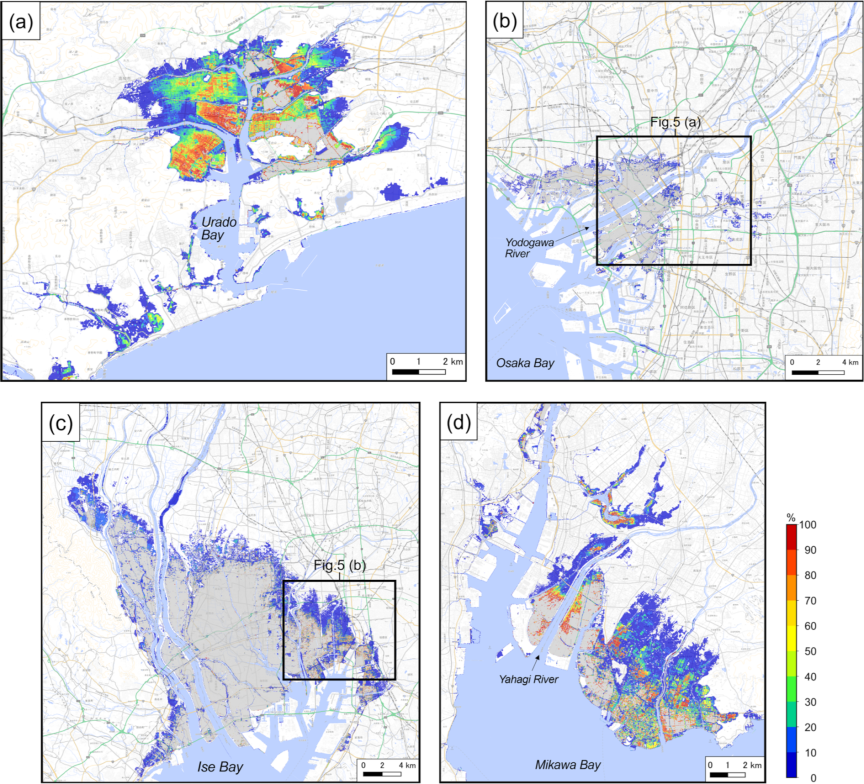
Fig. 4. Distribution of the conditional exceedance probability that the elevation falls below sea level when a great earthquake occurs along the Nankai Trough. (a) Kochi City and surrounding area, (b) Osaka City and surrounding area, (c) Nagoya City and surrounding area, and (d) Nishio City and surrounding area. The gray color indicates existing land below sea level. The data were plotted on Geospatial Information Authority of Japan Tiles.
Figure 4(b) (Osaka City and surrounding area) shows widespread land below sea level around the lower reaches of the Yodogawa River. Not only in coastal areas but also in regions farther inland, scattered areas could potentially fall below sea level due to coseismic subsidence. Fig. 5(a) presents an enlarged map of central Osaka City. Focusing on the area around Osaka Station, areas with \({P_{i}(H<0)}\) exceeding several percent are observed in the north. Focusing on the area around Shin-Osaka Station, areas with \({P_{i}(H<0)}\) exceeding several percent are observed in the southwest. These areas are concentrated in terms of population and capital stock because they are key transportation and commercial hubs. From the viewpoint of long-term flooding, there is a concern that the expansion of land below sea level will have a significant impact.
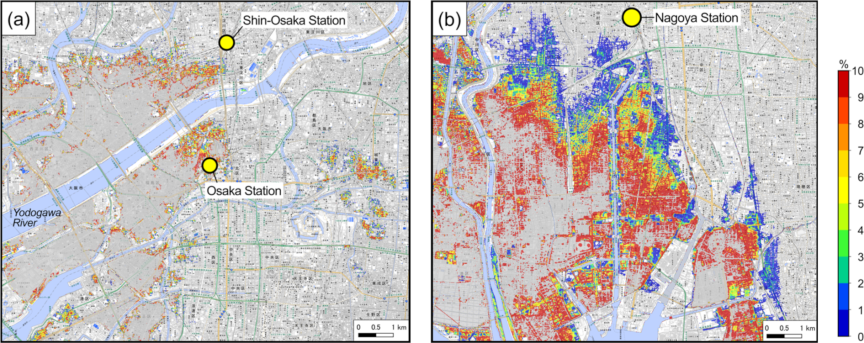
Fig. 5. Distribution of the conditional exceedance probability that the elevation falls below sea level when a great earthquake occurs along the Nankai Trough. (a) and (b) are enlarged maps within the black rectangles in Figs. 4(b) and (c), respectively. The gray color indicates existing land below sea level. Note that the upper limit of the color scale differs from that in Fig. 4. The data were plotted on Geospatial Information Authority of Japan Tiles.
Figure 4(c) (Nagoya City and surrounding area) shows widespread land below sea level, extending over 20 km inland from the inner reaches of Ise Bay. Fig. 5(b) presents an enlarged map of central Nagoya City. Focusing on the south of Nagoya Station, \({P_{i}(H<0)}\) exceeding several percent is widespread, and areas where \({P_{i}(H<0)}\) is 10% or higher are also observed. Similar to central Osaka City, these areas are concentrated in terms of population and capital stock. There is a concern that the expansion of land below sea level will have a significant impact.
Figure 4(d) (Nishio City and surrounding area) shows an expansion of land below sea level due to coseismic subsidence, mainly around the lower reaches of the Yahagi River and eastward from there. Similar to Fig. 4(a) (Kochi City and surrounding area), the extent of land that could potentially fall below sea level due to coseismic subsidence is larger than the current area below sea level.
5. Discussion
5.1. Total Area Falling Below Sea Level for the Next Nankai Trough Event Sequence
We discuss the total area and likelihood of the elevation falling below sea level due to coseismic deformation when a great earthquake occurs along the Nankai Trough. The conditional exceedance probability \({P(A>\alpha)}\) of the total area \(A\) [km\(^2\)] falling below sea level when a great earthquake occurs along the Nankai Trough becomes larger than the critical area \(\alpha\) [km\(^2\)] is expressed as
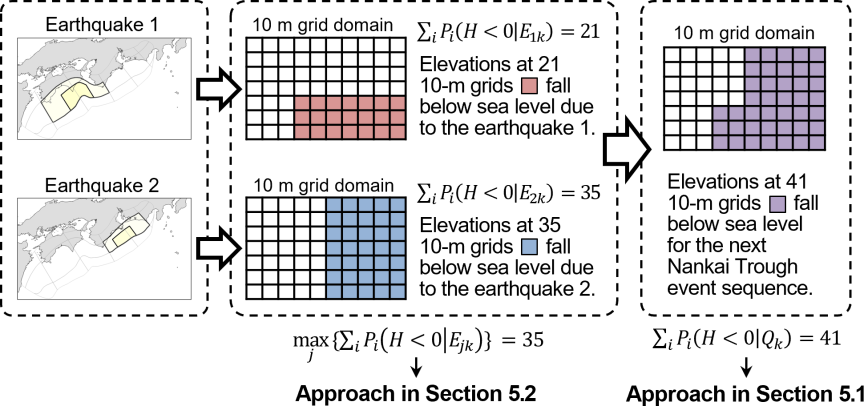
Fig. 6. Conceptual diagram illustrating the two approaches for analyzing total area falling below sea level; a case in which the next Nankai Trough event sequence consists of two earthquakes. The right and center panels illustrate the approaches described in Sections 5.1 and 5.2, respectively.
Figure 7 shows the histogram and cumulative weight of the total area \(A\) falling below sea level in the four 10-m grid domains for 916,669 CEFM occurrence patterns. The cumulative weight is, in other words, the conditional non-exceedance probability \(1-{P(A>\alpha)}\) when a great earthquake occurs along the Nankai Trough. We focused on the total area \(A\) corresponding to 5%, 25%, 50%, and 75% of the conditional exceedance probability \({P(A>\alpha)}\). Additionally, we also focused on \({P(A>\alpha)}\) when the current area \(A_0\) [km\(^2\)] below sea level in the domains is taken as the critical area \(\alpha\).
In Kochi City and surrounding area, the values of \(A\) corresponding to 5%, 25%, 50%, and 75% of \({P(A>\alpha)}\) were 20.8, 15.1, 6.6, and 4.7 km\(^2\), respectively. The values of \({P(A>\alpha)}\) for \(\alpha=0.5A_{0}\), \(A_0\), and \(2A_0\) were 87%, 73%, 32%, respectively. This suggests high potential for the area below sea level to expand to double or more than the current area.
In Osaka City and surrounding area, the values of \(A\) corresponding to 5%, 25%, 50%, and 75% of \({P(A>\alpha)}\) were 8.0, 1.2, 0.8, and 0.6 km\(^2\), respectively. The values of \({P(A>\alpha)}\) for \(\alpha=0.5A_{0}\), \(A_0\), and \(2A_0\) were all 0%. Compared to the other three domains, the amount and likelihood of the land falling below sea level were not as high.
In Nagoya City and surrounding area, the values of \(A\) corresponding to 5%, 25%, 50%, and 75% of \({P(A>\alpha)}\) were 70.7, 17.8, 12.2, and 8.7 km\(^2\), respectively. The value of \({P(A>\alpha)}\) for \(\alpha=0.5A_{0}\) was 0.2%. The values of \({P(A>\alpha)}\) for \(\alpha=A_{0}\) and \(2A_0\) were 0%.
In Nishio City and surrounding area, the values of \(A\) corresponding to 5%, 25%, 50%, and 75% of \({P(A>\alpha)}\) were 32.3, 14.9, 9.5, and 6.8 km\(^2\), respectively. The values of \({P(A>\alpha)}\) for \(\alpha=0.5A_{0}\), \(A_0\), and \(2A_0\) were 60%, 23%, and 5%, respectively. This suggests potential for the area below sea level to expand to double or more than the current area.
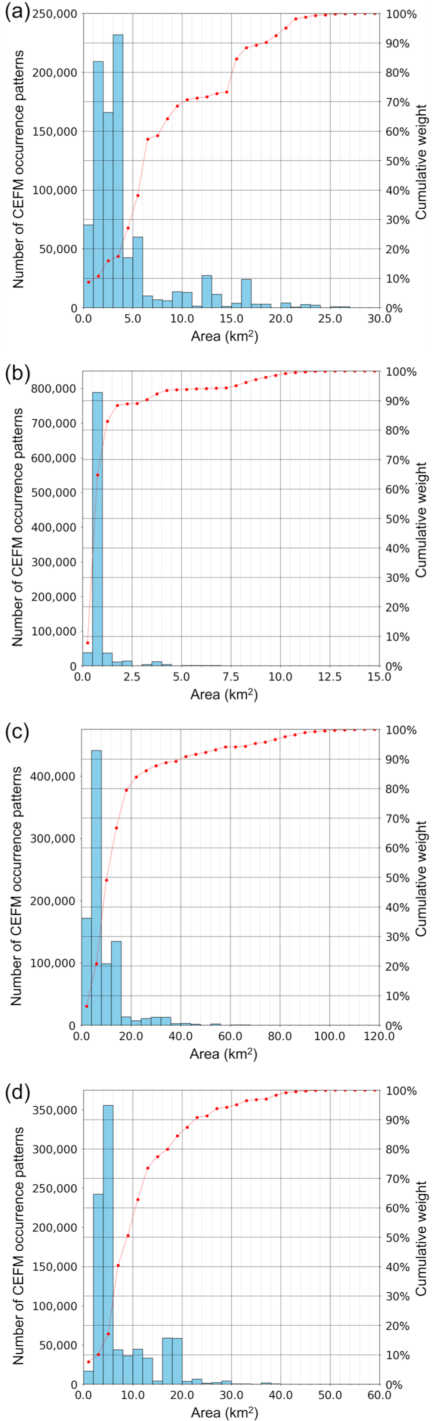
Fig. 7. Histogram and cumulative weight (red line) of the total area falling below sea level for 916,669 CEFM occurrence patterns (Section 5.1). Left and right vertical axes correspond to the histogram and cumulative weight, respectively. (a) Kochi City and surrounding area, (b) Osaka City and surrounding area, (c) Nagoya City and surrounding area, and (d) Nishio City and surrounding area.
5.2. Another Approach for Analyzing Total Area Falling Below Sea Level
In Section 5.1, we discussed the total area and likelihood of the elevation falling below sea level due to coseismic deformation for the next Nankai Trough event sequence consisting of one to five earthquakes. However, it may also be useful to understand the characteristics of not only the entire sequence but also a single earthquake during the sequence. From this viewpoint, this section focuses on the total area \(A\) falling below sea level for a single earthquake, especially when \(A\) is the largest of the one to five earthquakes in a sequence. The conditional exceedance probability \({P(A>\alpha\mid Q_{k})}\) is expressed as
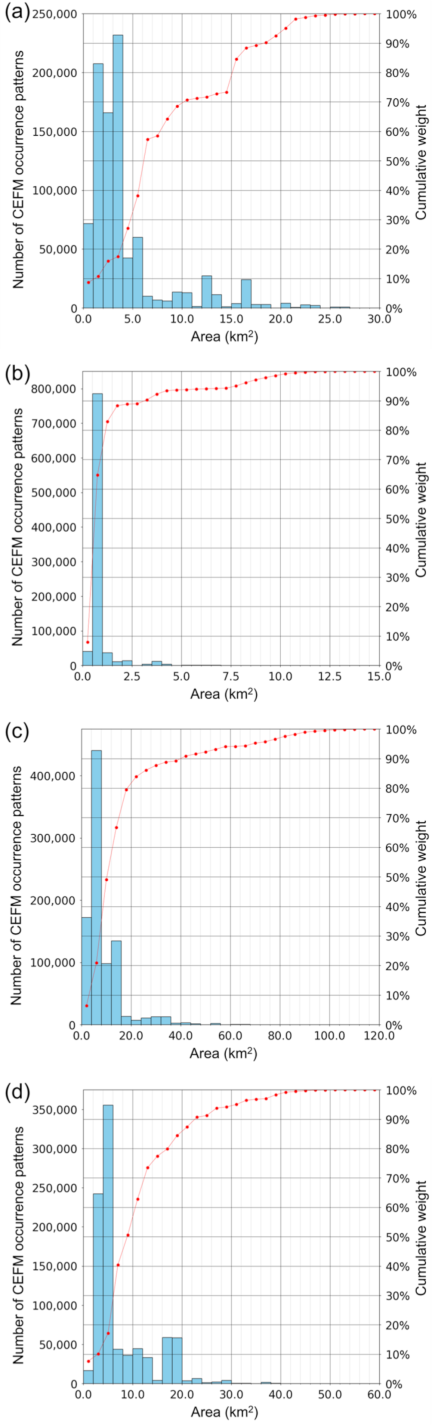
Fig. 8. Another histogram and cumulative weight (red line) of the total area falling below sea level for 916,669 CEFM occurrence patterns (Section 5.2). Left and right vertical axes correspond to the histogram and cumulative weight, respectively. (a) Kochi City and surrounding area, (b) Osaka City and surrounding area, (c) Nagoya City and surrounding area, and (d) Nishio City and surrounding area.
Figure 8 shows the histogram and cumulative weight (i.e., \(1-{P(A>\alpha)}\)) of the total area \(A\) falling below sea level in the four domains for 916,669 CEFM occurrence patterns. In Kochi City and surrounding area, the values of \(A\) corresponding to 5%, 25%, 50%, and 75% of \({P(A>\alpha)}\) were 20.8, 15.1, 6.6, and 4.7 km\(^2\), respectively. In Osaka City and surrounding area, the values of \(A\) corresponding to 5%, 25%, 50%, and 75% of \({P(A>\alpha)}\) were 8.0, 1.2, 0.8, and 0.6 km\(^2\), respectively. In Nagoya City and surrounding area, the values of \(A\) corresponding to 5%, 25%, 50%, and 75% of \({P(A>\alpha)}\) were 70.7, 17.8, 12.2, and 8.7 km\(^2\), respectively. In Nishio City and surrounding area, the values of \(A\) corresponding to 5%, 25%, 50%, and 75% of \({P(A>\alpha)}\) were 32.3, 14.9, 9.5, and 6.8 km\(^2\), respectively.
Each histogram and cumulative weight in Fig. 8 was almost identical to the corresponding histogram and cumulative weight in Fig. 7. The values of \(A\) corresponding to 5%, 25%, 50%, and 75% of \({P(A>\alpha)}\) in the four domains obtained in this section were identical to those obtained in Section 5.1. This suggests that, in the case of the four selected domains, the total areas falling below sea level for the next Nankai Trough event sequence can be dominated by the total area for a certain single earthquake event in the sequence.
5.3. Toward Effective Preparedness and Countermeasures Against Long-Term Flooding
To support effective preparedness and countermeasures against long-term flooding, we believe it is necessary to consider both the potential for land to fall below sea level and the potential for it to be inundated—that is, the viewpoint of multi-hazards or their cascading effects. A recent study suggested the effectiveness of multi-hazard overlay maps and identified blind spots due to relying on a single hazard 27. Overlaying the results of this study (e.g., Figs. 4 and 5) on the possible tsunami-inundation area for future Nankai Trough earthquakes is expected to contribute to discussions on preparing for long-term flooding caused by tsunamis, which may not be obtained from tsunami hazard information alone. Furthermore, overlaying the results of this study on possible inundation areas caused by tsunamis, storm surges, and river flooding is expected to contribute to the discussion of long-term flooding caused by various hazards. These ideas are expected to contribute to discussions on areas requiring countermeasures and prioritizing investments for countermeasures.
5.4. Limitations and Future Prospects
The purpose of this study is to understand the characteristics of the expansion of land below sea level due to coseismic subsidence (crustal deformation) following great earthquakes along the Nankai Trough. However, there are other factors of subsidence due to earthquakes, such as liquefaction. Subsidence believed to be caused by liquefaction in past Nankai Trough earthquakes has been reported 26,28. Recently, Miyamoto et al. 29 proposed a method for predicting subsidence due to liquefaction based on seismic intensity and geographical information such as microtopography classification. They used this method to evaluate the probabilistic liquefaction hazards and risks. In the future, we believe it is necessary to consider both coseismic subsidence and subsidence due to liquefaction to evaluate land falling below sea level following great earthquakes.
It may also be important to consider not only coseismic subsidence but also post-seismic deformation, depending on the period in focus. In the case of the 2011 Tohoku earthquake, the 10-year cumulative post-seismic vertical deformation on the Oshika Peninsula and surrounding area was reported to exceed 0.6 m the day after the earthquake occurred 30. The important effects of afterslip and viscoelastic relaxation in the post-seismic process of the 2011 Tohoku earthquake have been reported 31. In recent years, research has examined afterslip and viscoelastic relaxation following a Nankai Trough earthquake 32,33. From a long-term perspective such as city planning or land use, it may be necessary to consider not only coseismic subsidence but also post-seismic deformation. Furthermore, from the viewpoint of temporal changes in crustal deformation, the order in which earthquakes occur in the next Nankai Trough event sequence may also need to be considered.
6. Conclusions
This study analyzed the characteristics of the expansion of land below sea level due to coseismic subsidence for great earthquakes along the Nankai Trough. Expressing the variety of occurrences of great earthquakes along the Nankai Trough as more than 900,000 occurrence patterns, we analyzed the likelihood and extent of land falling below sea level due to coseismic subsidence for four regions. The results suggested that the extent of land that could potentially fall below sea level as a result of coseismic subsidence could be larger than the current area below sea level in Kochi City and surrounding area and Nishio City and surrounding area. In addition, we discussed the likelihood of land falling below sea level and the total area using two different approaches. In the case of the four selected regions, the total area that could fall below sea level in the next Nankai Trough event sequence could be dominated by the total area attributable to a certain single earthquake event in the sequence.
We expect that the results of this study will contribute to effective preparedness and countermeasures against long-term flooding, such as understanding the areas requiring countermeasures and prioritizing investments for these measures, by comprehensively addressing our results and hazard information on possible inundation areas due to other hazards. In the future, analyzing not only coseismic subsidence but also subsidence due to liquefaction will contribute to more practical discussions on effective preparedness and countermeasures against long-term flooding. In addition, from a long-term perspective such as city planning or land use, it may be necessary to consider not only coseismic subsidence but also post-seismic deformation.
Acknowledgments
We thank two anonymous reviewers for their valuable comments. This study was conducted as part of the Research Project for Disaster Prevention on the Great Earthquakes along the Nankai Trough of the Ministry of Education, Culture, Sports, Science and Technology. Geospatial Information Authority of Japan Tiles were used, as shown in Figs. 4 and 5.
- [1] Earthquake Research Committee, Headquarters for Earthquake Research Promotion, “Long-term evaluation of seismic activities along the Nankai Trough (second edition, partial revision),” 2025 (in Japanese). https://www.jishin.go.jp/main/chousa/kaikou_pdf/nankai_3.pdf [Accessed December 30, 2025]
- [2] Earthquake Research Committee, Headquarters for Earthquake Research Promotion, “Probabilistic hazard assessment of tsunami due to large earthquakes along the Nankai Trough,” 2020 (in Japanese; English version of the outline released in 2023). https://www.jishin.go.jp/evaluation/tsunami_evaluation/ [Accessed February 28, 2025]
- [3] Earthquake Research Committee, Headquarters for Earthquake Research Promotion, “Update for earthquake occurrence probability based on long-term evaluation,” 2026 (in Japanese). https://www.static.jishin.go.jp/resource/evaluation/long_term_evaluation/updates/prob2026.pdf [Accessed January 16, 2026]
- [4] Earthquake Research Committee, Headquarters for Earthquake Research Promotion, “National seismic hazard maps for Japan (2020),” 2021 (in Japanese; English version of the main report and explanatory documents released in 2026). https://www.jishin.go.jp/evaluation/seismic_hazard_map/shm_report/shm_report_2020/ [Accessed February 26, 2026]
- [5] Cabinet Office, Government of Japan, “Committee for modeling a Nankai Trough megaquake and damage estimation method,” 2025 (in Japanese). https://www.bousai.go.jp/jishin/nankai/kento_wg/index.html [Accessed December 30, 2025]
- [6] Cabinet Office, Government of Japan, “Working group on the Nankai Trough megaquake (2023–),” 2025 (in Japanese). https://www.bousai.go.jp/jishin/nankai/taisaku_wg_02/index.html [Accessed December 30, 2025]
- [7] Hydrographic Bureau, “Report on the Nankai Earthquake in 1946 (change of the land surface and damage),” Hydrogr. Bull., Special No.201, 1948 (in Japanese).
- [8] Kochi Prefecture, “Records of the great Nankai earthquake,” 1949 (in Japanese).
- [9] Kochi Prefecture, “Results of the consideration of countermeasures for long-term flooding due to the Nankai Earthquake,” 2013 (in Japanese). https://www.pref.kochi.lg.jp/doc/kochicity24chokishinsui/file_contents/00_all.pdf [Accessed December 30, 2025]
- [10] Ministry of Land, Infrastructure, Transport and Tourism, “Coseismic subsidence in coastal areas of Miyagi Prefecture,” 2011 (in Japanese). https://www.mlit.go.jp/report/press/river03_hh_000335.html [Accessed December 30, 2025]
- [11] Tohoku Regional Development Bureau, “Activity record for the Great East Japan Earthquake (report),” 2011 (in Japanese). https://www.thr.mlit.go.jp/bumon/b00037/k00290/river-hp/kasen/shinsaikanren/data/03kuukouponpu/H231202houkoku.pdf [Accessed December 30, 2025]
- [12] F. Villalobos, “Crustal deformation associated with the 1960 earthquake events in the south of Chile,” Proc. 5th Int. Conf. Earthq. Geotech. Eng., Paper No.CDDFV, 2011.
- [13] J. N. Malik and C. V. R. Murty, “Landscape changes in Andaman and Nicobar Islands (India) due to 9.3 tsunamigenic Sumatra earthquake of 26 December 2004,” Curr. Sci., Vol.88, No.9, pp. 1384-1386, 2005.
- [14] N. Maki et al., “Disaster response and recovery from long term flooding damage: Case study of Kochi City flooding for Nankai Earthquake disaster,” J. Soc. Saf. Sci., Vol.13, pp. 195-202, 2010 (in Japanese). https://doi.org/10.11314/jisss.13.195
- [15] F. Sato, M. Ueno, and H. Yamauchi, “Fundamental study for assessing the risk of long-term flooding within the tsunami inundation zone of a Nankai Trough Earthquake,” Proc. Annu. Conf. Inst. Soc. Saf. Sci., No.54, pp. 203-206, 2024 (in Japanese).
- [16] Kochi Prefecture, “Estimation of the duration of water stoppage and drainage in long-term flooding area of Kochi City,” 2024 (in Japanese). https://www.pref.kochi.lg.jp/doc/2024062400019/ [Accessed February 19, 2026]
- [17] Hyogo Prefecture, “Earthquake and tsunami damage estimation for Hyogo Prefecture (Nankai Trough),” 2025 (in Japanese). https://web.pref.hyogo.lg.jp/kk37/jishintsunamihigaisoutei.html [Accessed February 19, 2026]
- [18] Y. Dohi, H. Nakamura, H. Fujiwara, and S. Akagi, “Characteristics of coseismic uplift on ports for great earthquakes along the Nankai Trough: Preparing for advance countermeasures,” J. Disaster Res., Vol.20, No.5, pp. 585-597, 2025. https://doi.org/10.20965/jdr.2025.p0585
- [19] H. Nakamura et al., “Development of an earthquake disaster prevention simulator for the great earthquakes along the Nankai Trough, Japan,” Tech. Note Natl. Res. Inst. Earth Sci. Disaster Resil., No.515, 2025 (in Japanese). https://doi.org/10.24732/NIED.00007246
- [20] Y. Okada, “Internal deformation due to shear and tensile faults in a half-space,” Bull. Seismol. Soc. Am., Vol.82, No.2, pp. 1018-1040, 1992. https://doi.org/10.1785/BSSA0820021018
- [21] K. Iida, “History of tsunami damage in Aichi Prefecture,” Subcommittee for Earthquake, Aichi Prefectural Disaster Management Council, 1981 (in Japanese).
- [22] K. Ishibashi, “Nankai Trough great earthquake—History, science and society,” Iwanami Shoten, 2014 (in Japanese).
- [23] T. Sawamura, “Crustal movements by the Nankai earthquake in 1946,” Rep. Kochi Univ., Nat. Sci., Vol.1, pp. 20-33, 1951 (in Japanese).
- [24] H. Kawasumi, “Actual conditions of coseismic and postseismic crustal deformation of the Great Nankai Earthquake I on 21 December 1946 in the Shikoku Region,” Report on the Survey of Crustal Deformation in the Shikoku Region, pp. 3-16, 1956 (in Japanese).
- [25] T. Usami, H. Ishii, T. Imamura, M. Takemura, and R. S. Matsu’ura, “Materials for comprehensive list of destructive earthquakes in Japan, 599–2012,” University of Tokyo Press, 2013 (in Japanese).
- [26] A. Shibata, “The historical documents suggesting coseismic crustal movements of the 1707 Hoei earthquake,” Hist. Earthq., No.32, pp. 1-17, 2017 (in Japanese).
- [27] M. Uehara, D. Shinkai, T. Ichinose, J. Yamazaki, and R. Yamashita, “Comparing a single-hazard map and a multi-risk overlay map based on Design with Nature process,” J. Disaster Res., Vol.21, No.1, pp. 164-180, 2026. https://doi.org/10.20965/jdr.2026.p0164
- [28] E. Kuribayashi and F. Tatsuoka, “Brief review of liquefaction during earthquakes in Japan,” Soils Found., Vol.15, No.4, pp. 81-92, 1975. https://doi.org/10.3208/sandf1972.15.4_81
- [29] R. Miyamoto et al., “Probabilistic liquefaction risk assessment based on liquefaction risk ratio and ground settlement,” Proc. 16th Japan Earthq. Eng. Symp., Paper No.Day1-G418-12, 2023 (in Japanese).
- [30] Geospatial Information Authority of Japan, “Ten years after the 2011 off the Pacific coast of Tohoku earthquake,” 2021 (in Japanese). https://www.gsi.go.jp/kanshi/h23touhoku_10years.html [Accessed January 26, 2026]
- [31] S. Watanabe, T. Ishikawa, Y. Nakamura, and Y. Yokota, “Co- and postseismic slip behaviors extracted from decadal seafloor geodesy after the 2011 Tohoku-oki earthquake,” Earth Planets Space, Vol.73, Article No.162, 2021. https://doi.org/10.1186/s40623-021-01487-0
- [32] S. Murakami et al., “Highly detailed viscoelastic crustal deformation analysis of the Nankai Trough region using a 3D finite-element method accelerated with a data-driven approach,” Program and Abstracts of the Japan Geoscience Union Meeting 2024, STT39-05, 2024.
- [33] H. Suito, “Study on viscus flow and rheological heterogeneity caused by large earthquake along the Nankai Trough,” Program and Abstracts of the 2022 Fall Meeting of the Seismological Society of Japan, S03-15, 2022 (in Japanese).
This article is published under a Creative Commons Attribution-NoDerivatives 4.0 Internationa License.