
Paper:
A Spatially Constrained k-means++ Approach for Multi-Disaster Regionalization in China
Yi Tang*,**,***
 , Yuanda Zhang*, and Longsheng Huang*,**,†
*School of Emergency Technology and Management, University of Emergency Management
No.465 Xueyuan Street, Sanhe, Hebei 065201, China
**Hebei Key Laboratory of Resource and Environmental Disaster Mechanism and Risk Monitoring
Sanhe, China
***Department of Statistics and Data Science, Tsinghua University
Beijing, China
†Corresponding author

The spatial zoning of disaster-prone areas in mainland China presents a compelling yet complex challenge. Despite significant strides in disaster management and risk reduction, a comprehensive and region-specific disaster zoning that considers spatial contiguity remains largely unexplored. This study seeks to address this gap by applying and comparing four clustering methods: k-means, spatially constrained k-means, k-means++, and spatially constrained k-means++. These methods were evaluated based on their ability to categorize regions by the extent of areas affected by five major disaster types: floods, droughts, low temperatures, typhoons, and hailstorms. The spatially constrained k-means++ algorithm emerged as the most effective, as it addressed spatial discontinuity inherent in disaster zoning and mitigated the initial value problem linked to traditional k-means methods. Using this approach, mainland China was divided into four distinct disaster-prone clusters. Cluster 1, encompassing 25 provinces, exhibited a complex and overlapping hazard profile, while Clusters 2 and 3 (Hebei–Jilin–Xinjiang and Jiangxi–Hubei, respectively) reflected more specific regional disaster patterns. Hainan formed an independent cluster because of its unique typhoon dominance. These spatially coherent zoning results provide a robust foundation for developing differentiated disaster management strategies, from integrated approaches in multi-disaster regions to specialized interventions in areas facing dominant threats.
1. Introduction
Disaster zoning and regionalization play a fundamental role in disaster risk governance, as they provide a spatial framework for prioritizing mitigation investments, coordinating emergency response, and communicating risk in an interpretable and actionable manner 1,2. By grouping areas with similar hazard profiles into internally homogeneous but mutually distinct regions, zoning enables disaster management strategies to move beyond uniform national prescriptions toward differentiated, place-based interventions 3. It is particularly important under increasing climate variability, where regions are often exposed to multiple interacting disasters rather than a single dominant risk 4,5. Against this backdrop, the question of how to delineate disaster zones in a manner that is both analytically sound and operationally meaningful has become increasingly central to disaster science, risk management, and climate adaptation research.
Existing disaster zoning approaches commonly rely on clustering or classification techniques applied to the feature space of hazard indicators, grouping spatial units according to similarity in flood frequency, drought severity, storm exposure, and related variables 6,7. Although such methods effectively maximize statistical homogeneity and separation, they typically ignore spatial structure 8. Consequently, they often produce highly fragmented regionalizations consisting of many disconnected patches scattered across the map.
Such fragmentation poses practical challenges for governance and planning. Spatially adjacent areas may be assigned to different zones despite similar risk contexts, while distant regions are grouped together, complicating coordination, interpretation, and policy implementation. These issues reveal a fundamental tension between feature-space compactness and spatial contiguity, which has not been systematically addressed in multi-disaster regionalization research.
Therefore, this study examines whether and how conventional clustering approaches tend to generate spatially fragmented regionalizations, whether incorporating spatial constraints can improve spatial coherence without severely compromising hazard similarity, and how the trade-off between feature-space compactness and spatial contiguity varies across different clustering strategies and validation settings. In this context, spatial coherence refers to the degree to which areas assigned to the same cluster form geographically contiguous and internally connected regions rather than fragmented and scattered patches. This property matters because disaster zoning is intended not only to group similar disaster profiles, but also to support interpretable regional delineation, administrative coordination, and practical disaster governance. Through this analysis, we aim to provide an evidence-based foundation for selecting disaster zoning methods that are statistically sound and practically implementable for disaster prevention and planning.
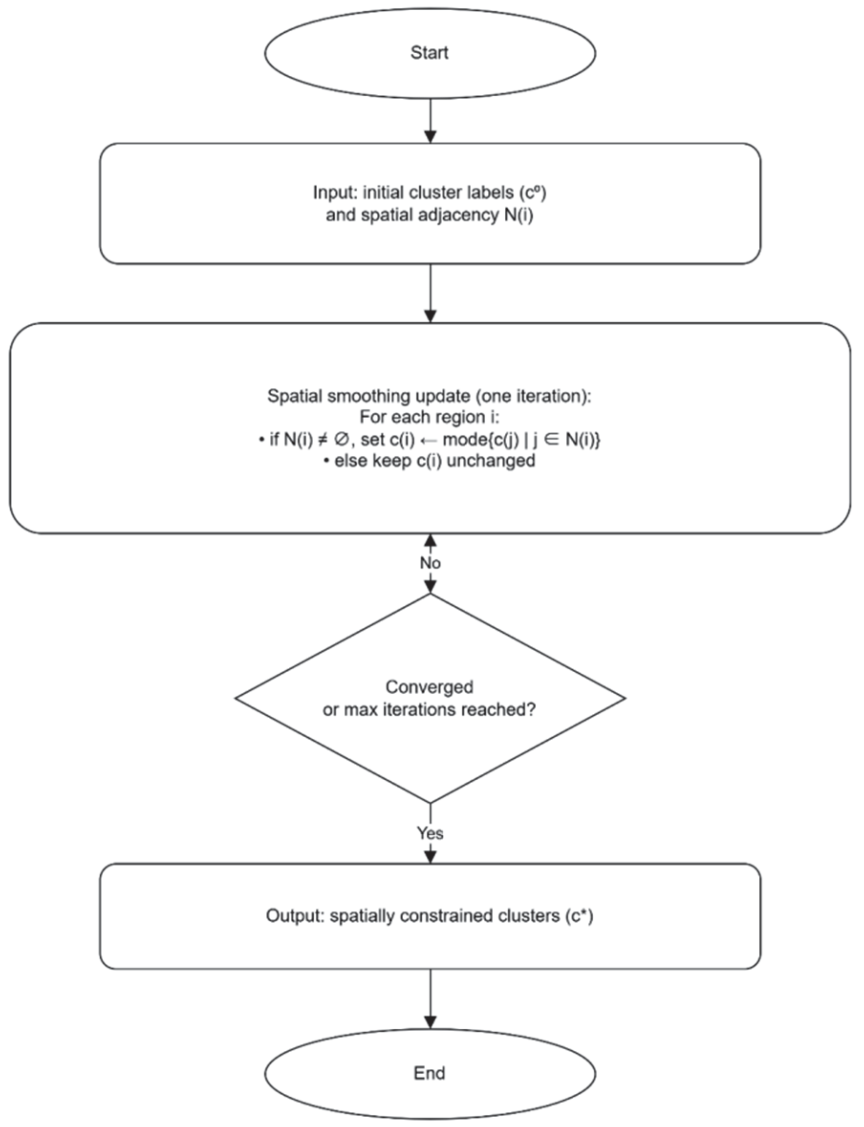
Fig. 1. Workflow of the spatially constrained clustering procedure.
We illustrate this framework using multi-disaster data from China, one of the most disaster-prone countries worldwide, characterized by strong climatic and topographic heterogeneity and exposure to floods, droughts, typhoons, hailstorms, and extreme temperatures 9,10,11. Therefore, China provides a representative and challenging testbed for examining how different regionalization strategies perform under complex and spatially heterogeneous disaster conditions 12. The results are intended to support the design of more coherent and interpretable disaster zoning schemes for practical applications in disaster prevention, emergency planning, and regional disaster management systems.
2. Materials and Methods
2.1. Data Source
We utilized a comprehensive dataset encompassing the provincial distribution of the annual average disaster-affected area in China from 2001 to 2018, covering five major disaster types: flooding, drought, low temperatures, typhoons, and hailstorms. These data are derived from official and scientifically validated sources 13 and reflect the realized spatial impact of major natural hazards across provinces.
In this study, we do not conceptualize disasters purely as physical hazard processes or environmental predispositions but rather as realized impact regimes reflected by historical disaster outcomes on human and natural systems. Geological and climatic factors influence the generation and propagation of disasters; however, they do not indicate where and to what extent disasters affect landscapes and societies. Therefore, we used disaster-affected area as an operational indicator of disaster impact, as it captures the realized spatial footprint of disaster processes over time rather than their physical generation mechanisms alone.
To ensure comparability across provinces with different land areas, we normalized disaster impact by computing the ratio of the annual average disaster-affected area to the total provincial land area. This normalization allowed us to compare relative disaster burdens across regions rather than absolute impacts while avoiding systematic bias toward larger provinces. In this way, our indicators represented experienced disaster impact regimes rather than physical susceptibility alone, enabling regionalization that is directly grounded in observed disaster outcomes and relevant for disaster risk governance and planning.
2.2. \(k\)-means\(\texttt{++}\)
To mitigate the influence of the initial centroid selection, which is a critical factor in determining the final clustering outcome, we adopted the \(k\)-means\(\texttt{++}\) algorithm. The \(k\)-means\(\texttt{++}\) algorithm is an advanced version of the classic \(k\)-means algorithm and is designed to overcome the sensitivity of \(k\)-means to initial seeding 14. The \(k\)-means\(\texttt{++}\) algorithm initializes the initial centroid selection in a “smart” way to pursue better cluster quality. Instead of randomly selecting the initial centroids, the \(k\)-means\(\texttt{++}\) algorithm determines the initial centroids and spreads them across the data space as much as possible. This feature helps to minimize the probability of becoming trapped in suboptimal solutions owing to poor initialization. Consequently, by employing \(k\)-means\(\texttt{++}\), our study ensures a more robust and stable clustering result for disaster zone identification, impervious to the vagaries of initial seeding.
2.3. Spatial Constraints
Recognizing the importance of spatial constraints in disaster zoning, we incorporated spatial adjacency into the clustering process as a post-clustering constraint. In addition to hazard similarity in the feature space, the geographical neighborhood structure of regions was used to iteratively refine cluster assignments.
Starting from the initial clustering result, the algorithm updates the cluster labels based on the labels of neighboring regions. If neighboring regions exist for a region, the region is reassigned to the cluster that is the most common among its neighbors. If a region has no neighbors, its original cluster label is retained. This update is applied iteratively until the assignments stabilize or the maximum number of iterations is reached (Fig. 1).
This procedure promotes spatial contiguity by encouraging neighboring regions to belong to the same cluster while preserving the overall structure of feature-based clustering. Therefore, the resulting clusters represent a balance between hazard similarity and spatial coherence, yielding regionalization that is both statistically meaningful and operationally interpretable.
2.4. Comparison
In this study, we compared four clustering methods: \(k\)-means, spatially constrained \(k\)-means, \(k\)-means\(\texttt{++}\), and spatially constrained \(k\)-means\(\texttt{++}\). Note that in our application of the \(k\)-means method, we repeatedly ran the \(k\)-means algorithm to obtain optimal results. Computations in this research were conducted in the R language, with relevant packages including flexclust, sparcl, igraph, and cluster 15,16,17,18.
2.5. Validation
In this study, improvement is not defined solely in terms of feature-space compactness but also in terms of the spatial coherence and operational interpretability of the resulting zones. Therefore, we evaluated clustering performance along two complementary dimensions: (i) internal statistical validity in the feature space and (ii) spatial coherence of the resulting regionalization, a property that is directly relevant for regional disaster management and planning. The second dimension was quantified using neighbor agreement and within-cluster connected components.
To operationalize this evaluation, we designed a two-level validation framework that assesses both the structural outcomes of different clustering strategies and their spatial coherence under controlled and comparable conditions. First, we conducted a free-\(K\) validation in which each method was allowed to select the optimal number of clusters within a predefined range (\({K} =4\)–\(15\)). This setting captures the intrinsic preference of each algorithm and enables the examination of the emergent regional structures produced by unconstrained and spatially constrained models. Second, to ensure that any observed improvement in spatial coherence was not simply a consequence of using fewer clusters, we performed a fixed-\(K\) validation by comparing all methods under the same number of clusters (\({K} =4\) and \(11\)), corresponding to the typical solution produced by the spatially constrained models and the optimal solution selected by the unconstrained models.
The clustering results were evaluated using a combination of conventional internal validity indices and spatial coherence metrics. Internal clustering quality was assessed using the silhouette coefficient, which measures within-cluster compactness relative to between-cluster separation 19. We also used the Calinski–Harabasz (CH) index, which captures the ratio of between-cluster to within-cluster variance; and the Davies–Bouldin index (DBI), which quantifies the average similarity between clusters 20. Higher silhouette and CH values indicate better separation and compactness, whereas lower DBI values indicate higher clustering quality.
To explicitly evaluate spatial structure, we further computed neighbor agreement, defined as the proportion of spatially adjacent regions assigned to the same cluster and the number of connected components within each cluster, which reflects the degree of spatial fragmentation of the resulting regions. Higher neighbor agreement and fewer connected components indicate greater spatial coherence and contiguity of the resulting regionalization.
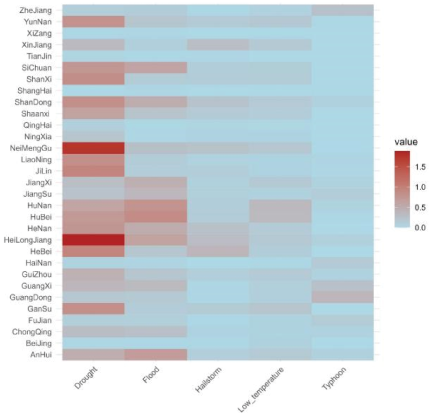
Fig. 2. Heatmap of disasters at the provincial scale in China.
3. Results
3.1. Disaster Features
Across China, regions exhibit substantial heterogeneity in disaster impacts (Fig. 2). Heilongjiang stands out as particularly vulnerable, with the highest recorded incidences of drought and floods. This province, along with Neimenggu and Jilin, is indicative of an area facing chronic water-related challenges. In stark contrast, Shanghai exhibits minimal susceptibility to droughts, floods, and hailstorms, indicating stable climatic conditions and effective disaster management. With regard to hailstorm activity, Hebei emerges as the most affected, in contrast to several provinces such as Shanghai and Guangdong, which report almost no occurrences. In terms of temperature extremes, Hunan and Hubei frequently experience lower temperatures, while coastal regions such as Guangdong, Zhejiang, and Fujian are notably affected by typhoons. Meanwhile, inland provinces such as Xizang and Shanxi show inherent resilience to such tropical disturbances.
3.2. \(k\)-means
The resultant segmentation into 11 clusters represents a delineation of regions exhibiting homogeneous attributes with respect to disaster features. The cluster indices (e.g., Clusters 1–11) serve only as identifiers and do not carry any intrinsic meaning in terms of risk magnitude or importance. Beijing, Tianjin, Shanghai, Xizang, Qinghai, and Ningxia share a common cluster (Cluster 3). This clustering suggests that they may exhibit similar disaster patterns, which are perhaps influenced by their shared geographical, climatic, or socioeconomic conditions. Meanwhile, Hebei and Xinjiang are uniquely grouped into Cluster 11, indicating a set of disaster features that are distinctly different from those of the other regions. This difference warrants further investigation to understand the unique disaster-related challenges they might face. Notably, several regions, including Shanxi, Guizhou, Yunnan, Shaanxi, and Gansu, are assembled under Cluster 4, indicating potential convergence in their disaster characteristics. Cluster 10, consisting of Zhejiang, Guangdong, and Guangxi, presents another distinct group, possibly suggesting similar coastal and socioeconomic influences on their disaster profiles (Fig. 3(a)).
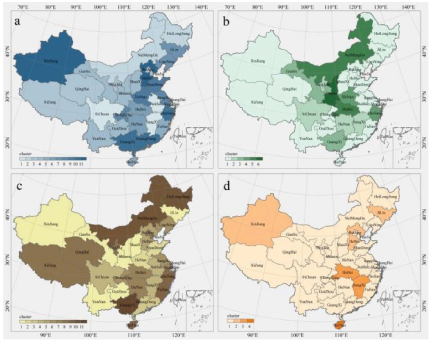
Fig. 3. Clustering results of the four algorithms. (a) \(k\)-means; (b) spatially constrained \(k\)-means; (c) \(k\)-means\(\texttt{++}\); (d) spatially constrained \(k\)-means\(\texttt{++}\). Cluster numbers are nominal identifiers and do not represent any ranking or severity of disaster risk.
Table 1. Free-\(K\) validation validation.

3.3. Spatially Constrained \(k\)-means
The results of the spatially constrained \(k\)-means clustering reveal the formation of six distinct clusters, each representing a unique disaster pattern prevalent in the analyzed regions. Most of the regions, which include Beijing, Tianjin, Hebei, Shanxi, Liaoning, Jilin, Heilongjiang, Shanghai, Jiangsu, Anhui, Fujian, Shandong, Guangdong, Hainan, Chongqing, Guizhou, Yunnan, Xizang, Qinghai, and Xinjiang, are classified under Cluster 1. The dominance of this cluster suggests that these regions bear similarities in their disaster profiles, which are likely attributable to common geographical, climatic, or socioeconomic factors. Conversely, Cluster 5, comprising Neimenggu and Hubei, diverges from the dominant disaster patterns, thus implying unique challenges related to disaster management that are inherent to these regions. Although smaller, Clusters 2, 3, and 4 reveal distinctive and potentially region-specific disaster patterns. Cluster 2, which includes Jiangxi and Hunan; Cluster 3, consisting of Guangxi and Gansu; and Cluster 4, comprising Zhejiang and Henan, highlight geographical variance in disaster characteristics. Cluster 6, represented solely by Shaanxi, indicates a disaster profile distinct from those of the other regions (Fig. 3(b)).
3.4. \(k\)-means\(\texttt{++}\)
The results from the \(k\)-means\(\texttt{++}\) clustering algorithm yield 11 distinct clusters, which underline the diverse disaster patterns across the regions. The most populous cluster is Cluster 1, which comprises Shanxi, Jilin, Guizhou, Yunnan, Shaanxi, Gansu, and Xinjiang. These regions display similar disaster characteristics and may be exposed to comparable risk factors or disaster management challenges. At the other end of the spectrum, Guangxi is the sole region in Cluster 11. This distinctive category suggests a unique disaster pattern, indicating region-specific vulnerabilities or unique disaster management requirements. Clusters 2 and 7 each comprise two regions: Shandong and Henan for Cluster 2 and Hubei, and Hunan for Cluster 7. These pairs of regions have similar disaster characteristics, indicating potential commonalities in their disaster response or recovery measures. A significant number of regions, including Beijing, Tianjin, Shanghai, Xizang, and Ningxia, fall into Cluster 8, implying a certain degree of similarity in their disaster traits. The remaining clusters, each encompassing a small set of regions, represent specific disaster patterns that require further investigation to understand the unique characteristics that set them apart (Fig. 3(c)).
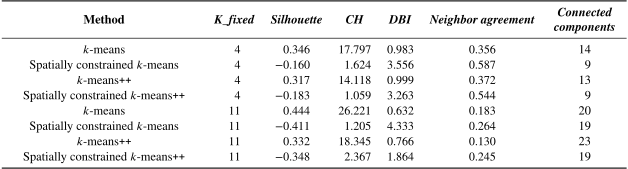
Table 2. Fixed-\(K\) validation results.
3.5. Spatially Constrained \(k\)-means\(\texttt{++}\)
Most regions, including Beijing, Tianjin, Shanxi, Neimenggu, Liaoning, Heilongjiang, Shanghai, Jiangsu, Zhejiang, Anhui, Fujian, Shandong, Henan, Hunan, Guangdong, Guangxi, Chongqing, Sichuan, Guizhou, Yunnan, Xizang, Shaanxi, Gansu, Qinghai, and Ningxia, are categorized into Cluster 1. These regions share similar disaster traits, which could suggest analogous risks or disaster management challenges. The extensive nature of this cluster implies a potential regional interconnectedness in disaster dynamics, which could be due to shared environmental, climatic, or socioeconomic factors. By contrast, Cluster 3, consisting of Jiangxi and Hubei, and Cluster 2, composed of Hebei, Jilin, and Xinjiang, are much smaller and represent regions with unique disaster profiles distinct from the majority. These clusters represent region-specific disaster patterns, suggesting unique risk factors or disaster response requirements. Hainan stands alone in Cluster 4, indicating a unique disaster pattern, which suggests that the region’s disaster characteristics are markedly different from those of the other regions (Fig. 3(d)).
3.6. Validation
Table 1 summarizes the results of the free-\(K\) validation, in which each method is allowed to select its preferred number of clusters. The unconstrained methods favor substantially larger numbers of clusters (\(K =10\)–11), achieving higher internal validity scores in the feature space, as reflected by the higher silhouette and CH values and lower DBI values. However, these solutions produce highly fragmented spatial patterns, with low neighbor agreement (\(\approx 0.18\)) and a large number of connected components (20–21), indicating weak spatial coherence.
By contrast, the spatially constrained variants naturally converge to a smaller number of clusters (\(K =4\)), producing spatially more coherent regionalizations. Although their internal clustering indices are lower—reflecting reduced separation in the feature space—their neighbor agreement increases substantially (0.54–0.59), and the number of connected components decreases markedly (from over 20 to 9). This result demonstrates a clear trade-off between feature-space compactness and spatial coherence, with the spatially constrained models prioritizing geographically contiguous and policy-relevant regions over purely statistical separation.
Table 2 reports the fixed-\(K\) validation results for \(K =4\) and \(11\), which allow a fair comparison across methods under identical model complexity. Under both values of \(K\), the spatially constrained methods consistently exhibit higher neighbor agreement and fewer connected components than their unconstrained counterparts. For example, at \(K =4\), neighbor agreement increases from 0.356–0.372 for unconstrained methods to 0.544–0.587 for spatially constrained ones, while the number of connected components decreases from 13–14 to 9. A similar pattern is observed at \(K =11\), where spatial constraints reduce spatial fragmentation despite lower internal validity scores.
These results confirm that the improved spatial coherence of the proposed approach is not merely an artifact of selecting fewer clusters but is a direct consequence of incorporating spatial constraints into the clustering process. Therefore, spatially constrained methods yield regionalizations that are less fragmented, more geographically contiguous, and better aligned with the requirements of regional disaster governance and coordinated risk management, even at the cost of reduced feature-space separation.
4. Discussion
4.1. Interpretation of Clustering Results and Policy Relevance
Although the clustering is mathematically defined in this study, the objects being clustered, namely, multi-hazard indicators, are not abstract constructs but are empirical manifestations of geographic, climatic, and socioeconomic processes. Flood occurrence reflects precipitation regimes, river systems, and land use; drought reflects climatic aridity and water availability; typhoon exposure reflects coastal location and atmospheric circulation; and temperature extremes reflect latitude, elevation, and continentality.
As a result, the similarity in the hazard feature space implicitly captures the similarity in the underlying processes. Therefore, clustering groups regions with similar hazard regimes, which correspond to recognizable geographic and climatic structures, even though these structures are not explicitly modeled.
The spatially constrained variant further strengthens this connection by incorporating spatial adjacency. As neighboring regions tend to share climate regimes, terrains, and development patterns, the spatial constraint promotes the formation of zones that are not only statistically coherent but also geographically meaningful and administratively interpretable 21.
The analysis of the results derived from the four clustering methodologies reveals patterns in regional disaster characteristics. The standard \(k\)-means clustering method broadly distributes the regions into 11 clusters, suggesting substantial diversity in disaster attributes owing to the geographical, climatic, and socioeconomic variations across these regions 22. The application of spatial constraints in the spatially constrained \(k\)-means algorithm results in a greater concentration of regions in the first cluster. This outcome indicates that proximal regions often exhibit similar disaster patterns, likely because of shared environmental conditions and socioeconomic statuses. Notably, Neimenggu and Hubei, each forming a unique cluster, have specific disaster management requirements, which are potentially attributable to distinct local conditions or disaster types. The \(k\)-means\(\texttt{++}\) method, which addresses the random initialization issues in standard \(k\)-means, yields more evenly distributed clustering. This outcome implies that certain regions, such as Guangdong, Guangxi, and Xinjiang, may exhibit distinct disaster traits that necessitate more targeted exploration. Finally, the spatially constrained \(k\)-means\(\texttt{++}\) method predominantly groups regions into Cluster 1, demonstrating its effectiveness in maintaining spatial continuity. This enhanced spatial coherence in the clustering results, achieved using the spatially constrained \(k\)-means\(\texttt{++}\) algorithm, presents a more geographically logical and actionable representation of disaster zones, thereby offering an improved tool for region-specific disaster management planning.
The spatial characteristics of disasters necessitate a nuanced approach to clustering methodologies 23. The examination of four methods, namely, \(k\)-means, spatially constrained \(k\)-means, \(k\)-means\(\texttt{++}\), and spatially constrained \(k\)-means\(\texttt{++}\), provides valuable insights. Traditional \(k\)-means, a widely adopted clustering method, offers the advantages of simplicity, speed, and scalability, making it suitable for large datasets. However, its principal shortcoming is its reliance on arbitrary centroid initialization, which potentially leads to inconsistent results and local optima. Moreover, it presupposes spherical clusters and uniform cluster sizes, which may not reflect the realities of geospatial data. Spatially constrained \(k\)-means mitigates some limitations of \(k\)-means by incorporating spatial information into the clustering algorithm 24. This methodology aligns more closely with geographical data given the spatial proximity of points. Nonetheless, it still grapples with the uncertainty associated with random initialization and retains the assumption of equal cluster sizes. \(k\)-means\(\texttt{++}\), an enhancement over the conventional \(k\)-means, introduces an intelligent initialization scheme that decreases the probability of local optima and augments the consistency of outcomes. Despite this improvement, \(k\)-means\(\texttt{++}\) does not account for spatial information, which is critical for dealing with disaster data distributed across diverse geographical regions. Lastly, the spatially constrained \(k\)-means\(\texttt{++}\) method amalgamates the advantages of spatial constraints and intelligent initialization, thus addressing the key limitations of previous methods. By factoring in geographical proximity, this approach yields more accurate clusters that reflect the spatial distribution of disasters, and improved initialization minimizes the uncertainty associated with random seed placement. Consequently, it offers a more reliable and realistic representation of regional disaster patterns.
The results of our clustering analysis provide pivotal insights for both broad-based and localized disaster risk management, showcasing a dual perspective on disaster susceptibility and resilience. Our study reveals a notable clustering of regions within Cluster 1, indicative of a shared disaster environment. The implications of these shared risks underscore the potential for regional collaboration in disaster management. Implementing joint strategies such as resource sharing, collective risk assessments, establishment of shared early warning systems, and coordination of disaster response efforts can address this shared vulnerability 25. Such approaches can potentially augment disaster management efficiency and mitigate the overall impacts of disasters. The unique clustering configurations exhibited by Hebei, Jilin, Jiangxi, Hubei, Xinjiang (Clusters 2 and 3), and Hainan (Cluster 4) underline the presence of unique, localized disaster patterns. These specific disaster patterns highlight the urgent need for bespoke disaster management strategies that cater to these unique regional nuances. Such strategies may include risk reduction measures tailored to the region, customized early warning systems, and response and recovery strategies that are pertinent to the local context. Our analysis can also guide the strategic allocation of resources for disaster management. Regions characterized by unique disaster patterns, as evidenced in Clusters 2, 3, and 4, may require prioritized resource allocation to effectively counter these distinct disaster risks. In parallel, the establishment of shared resources and capacities across regions in Cluster 1, in light of their common disaster characteristics, could facilitate more efficient and targeted utilization of disaster management resources. This dual strategy, which combines localized resource prioritization with regional resource sharing, could significantly bolster the efficacy of disaster management interventions across these regions.
The insights drawn from our clustering analysis emphasize the necessity for additional research to explore the underlying drivers of these observed disaster patterns. Investigations could focus on environmental, climatic, socioeconomic, and infrastructural elements that could potentially influence these disaster characteristics 26,27. Such informed research could facilitate the development of more tailored and effective disaster risk reduction measures. In essence, our clustering results yield critical spatial perspectives that could guide the creation of nuanced and effective disaster management strategies. Recognizing shared and distinct disaster patterns across regions can enable the development of more targeted, regionally suitable approaches to disaster risk reduction and response 28. Hence, our findings underscore the vital role of spatial analysis in enriching our understanding of disaster dynamics and improving disaster management outcomes. They also highlight the need for continued research to further elucidate these dynamics and inform more effective disaster management interventions.
4.2. Validation and Methodological Implications
The validation results highlight an important methodological distinction between conventional and spatially constrained clustering approaches. While unconstrained methods optimize cluster compactness in the feature space and therefore achieve higher internal validity indices, they tend to produce a spatially fragmented regionalization that is difficult to interpret and operationalize in a regional governance context. By contrast, the spatially constrained models explicitly trade some degree of feature-space separation for improved spatial coherence, resulting in fewer, more contiguous regions that are more consistent with administrative coordination and policy implementation needs.
The free-\(K\) validation demonstrates that this difference is structural rather than incidental. Unconstrained algorithms naturally favor a large number of clusters that maximize statistical homogeneity but fragment the spatial domain, whereas spatially constrained methods converge to a small number of coherent regions even without externally imposed constraints on \(K\). The fixed-\(K\) validation further confirms that the improved spatial coherence is not merely an artifact of reduced model complexity but is a direct effect of the spatial constraint itself, as constrained methods consistently exhibit higher neighbor agreement and lower spatial fragmentation under the same \(K\).
These findings indicate that the clustering quality in spatial applications cannot be evaluated solely based on conventional internal validity measures. For applications such as disaster risk governance, early warning coordination, and regional planning, spatial interpretability and contiguity are not secondary properties but are essential requirements. From a methodological perspective, the proposed spatially constrained clustering approach provides a more appropriate balance between statistical structure and practical usability, even when it entails accepting lower scores on purely feature-based clustering metrics.
Simultaneously, the observed trade-off also indicates a limitation of the approach: by enforcing spatial coherence, the model may mask finer-grained heterogeneity that could be relevant for certain analytical purposes, such as localized disaster differentiation or micro-scale risk assessment. Therefore, future work could explore multi-scale or hierarchical extensions that combine spatial coherence at higher levels with finer partitions at lower levels, allowing both governance-oriented regionalization and detailed local analysis within a unified framework.
The improvement in spatial coherence is not merely a cartographic refinement but has practical implications for disaster management. Spatially fragmented zoning schemes complicate coordination across administrative units, hamper regional planning efforts, and hinder the design of coherent preparedness and mitigation strategies. By producing more contiguous and internally consistent regions, the proposed approach supports clearer regional delineation for planning purposes, facilitates inter-regional coordination, and reduces ambiguity in the interpretation of risk zones. The enhancements demonstrated in this study have direct implications for the operational usability of disaster zoning outputs.
4.3. Limitations and Future Work
Although the spatially constrained \(k\)-means\(\texttt{++}\) algorithm provides valuable insights into regional disaster patterns, its limitations in achieving perfect spatial continuity must be acknowledged. Particularly in Cluster 2, which includes three provinces scattered across different parts of the country, a disruption in spatial continuity is evident. This spatial discontinuity might stem from various factors, including the uneven distribution of disaster data across provinces, the inherent geographical and climatic diversity within China, socioeconomic factors, and the intrinsic limitations of the algorithm itself, which might not always perfectly align with the actual spatial relationships among provinces 29,30.
In addressing the concerns raised regarding spatial continuity in disaster zoning and the application of the \(k\)-means\(\texttt{++}\) method, we must clarify that our choice is driven not only by the method’s ability to overcome spatial discontinuity but also by its enhanced initialization process. This process, combined with spatial constraints, yields a more robust and meaningful clustering outcome. Our approach acknowledges the multidimensional nature of disaster patterns, where geographical contiguity is important but is not the sole factor.
The ability of the spatially constrained \(k\)-means\(\texttt{++}\) algorithm to incorporate spatial contiguity into the clustering process is a significant advancement over traditional methods. This addition enhances its applicability to geographical data analysis, especially in disaster management, where spatial context is vital. The potential of the algorithm to cluster regions based on similar disaster patterns, despite spatial discontinuity, reveals the complex interplay between environmental, socioeconomic, and infrastructural factors in shaping disaster patterns 31.
Furthermore, the observed spatial discontinuity, particularly in Cluster 2, offers an opportunity to refine our understanding of the spatial dimensions of disaster patterns. This observation also invites exploration into the causes of such discontinuity, potentially leading to the development of more sophisticated clustering methods. The focus of our study on spatial continuity extends beyond algorithmic capabilities. It reflects our effort to align the clustering process with real-world geographical and administrative boundaries, thereby enhancing the practical utility of our findings for disaster management planning.
This discussion highlights the need for a multifaceted approach to disaster zoning that considers both spatial and non-spatial factors. The insights from our analysis using the spatially constrained \(k\)-means\(\texttt{++}\) method will pave the way for future research to refine clustering methodologies by considering the complex interplay of various factors that define disaster patterns.
5. Conclusion
In this study, disaster zoning was conducted based on the extent of areas affected by five major types of disasters: floods, droughts, low temperatures, typhoons, and hailstorms. We evaluated the performance of four clustering methods: \(k\)-means, spatially constrained \(k\)-means, \(k\)-means\(\texttt{++}\), and spatially constrained \(k\)-means\(\texttt{++}\). Specifically, the spatially constrained \(k\)-means\(\texttt{++}\) algorithm emerged as a valuable tool for addressing the issue of spatial discontinuity often encountered in disaster zoning. In addition, the spatially constrained \(k\)-means\(\texttt{++}\) algorithm mitigates the initial value problem associated with the conventional \(k\)-means method. Thus, the final delineation of disaster zones respects spatial contiguity, resulting in a geographically coherent, interpretable, and actionable representation. This study underscores the potential of spatially constrained \(k\)-means\(\texttt{++}\) in providing an improved framework for disaster management.
Our application of the spatially constrained \(k\)-means\(\texttt{++}\) algorithm delineated mainland China into four unique disaster-prone zones, enhancing our understanding of regional disaster vulnerability. The most expansive cluster, covering most provinces, presents a diverse disaster profile, necessitating a holistic disaster management strategy. The second cluster, comprising Hebei, Xinjiang, and Jilin, faces distinct challenges of droughts and hailstorms, requiring targeted strategies emphasizing drought resistance and hailstorm preparedness. The third cluster, comprising Jiangxi and Hubei, is characterized by high incidences of flooding, drought, and low-temperature disasters, calling for a shift in focus toward enhanced water management and temperature-related disaster mitigation. The fourth and final cluster, represented by Hainan, deals with the significant threat of typhoons, underscoring the need for management strategies that focus primarily on typhoon preparedness and response.
The novel approach of spatially constrained clustering provided a nuanced understanding of regional disaster profiles across China. Such an understanding, in turn, paves the way for more targeted and efficient disaster response strategies, underscoring the importance of a region-specific approach to enhancing disaster resilience. Our findings bring us a step closer to the ultimate goal of improved disaster management, marking an important milestone in our journey toward a more resilient future.
Acknowledgments
This work was supported by the Hebei Key Laboratory of Resource and Environmental Disaster Mechanism and Risk Monitoring (FZ248106).
- [1] A. K. Gupta and S. S. Nair, “Environmental impact assessment: Elucidating policy-planning for natural disaster management,” A. K. Gupta and S. S. Nair (Eds.), “Ecosystem Approach to Disaster Risk Reduction,” pp. 163-186, National Institute of Disaster Management, 2012.
- [2] N. Agrawal, M. Elliott, and S. P. Simonovic, “Risk and resilience: A case of perception versus reality in flood management,” Water, Vol.12, No.5, Article No.1254, 2020. https://doi.org/10.3390/w12051254
- [3] O. Rodríguez-Espíndola, P. Albores, and C. Brewster, “Disaster preparedness in humanitarian logistics: A collaborative approach for resource management in floods,” Eur. J. Oper. Res., Vol.264, pp. 978-993, 2018. https://doi.org/10.1016/j.ejor.2017.01.021
- [4] W. M. Qin, A. W. Lin, J. Fang, L. C. Wang, and M. Li, “Spatial and temporal evolution of community resilience to natural hazards in the coastal areas of China,” Nat. Hazards, Vol.89, pp. 331-349, 2017. https://doi.org/10.1007/s11069-017-2967-3
- [5] P. Cui, J. Peng, P. Shi, H. Tang, C. Ouyang, Q. Zou, L. Liu, C. Li, and Y. Lei, “Scientific challenges of research on natural hazards and disaster risk,” Geogr. Sustain., Vol.2, No.3, pp. 216-223, 2021. https://doi.org/10.1016/j.geosus.2021.09.001
- [6] P. Gao, Y. Gao, H. J. Li, and J. Y. Jiang, “Natural disaster regionalization based on emergency management in China,” J. Catastrophol., Vol.28, pp. 138-141+165, 2013 (in Chinese).
- [7] H. S. Xu, C. Ma, J. J. Lian, K. Xu, and E. Chaima, “Urban flooding risk assessment based on an integrated k-means cluster algorithm and improved entropy weight method in the region of Haikou, China,” J. Hydrol., Vol.563, pp. 975-986, 2018. https://doi.org/10.1016/j.jhydrol.2018.06.060
- [8] W. H. Fang and H. X. Zhang, “Zonation and scaling of tropical cyclone hazards based on spatial clustering for coastal China,” Nat. Hazards, Vol.109, pp. 1271-1295, 2021. https://doi.org/10.1007/s11069-021-04878-4
- [9] G. Y. Ren, Y. H. Ding, Z. C. Zhao, J. Y. Zheng, T. W. Wu, G. L. Tang, and Y. Xu, “Recent progress in studies of climate change in China,” Adv. Atmos. Sci., Vol.29, pp. 958-977, 2012. https://doi.org/10.1007/s00376-012-1200-2
- [10] S. Kim and P. G. Rowe, “Are master plans effective in limiting development in China’s disaster-prone areas?” Landsc. Urban Plan., Vol.111, pp. 79-90, 2013. https://doi.org/10.1016/j.landurbplan.2012.12.001
- [11] C. L. Franzke, “Impacts of a changing climate on economic damages and insurance,” Econ. Disaster Clim. Change, Vol.1, pp. 95-110, 2017. https://doi.org/10.1007/s41885-017-0004-3
- [12] S. Li, Y. Tang, Y. Zhao, X. Ning, Y. Zhang, S. Lv, and C. Liu, “Assessing future flood risk using remote sensing and explainable machine learning: A case study in the Beijing-Tianjin-Hebei region,” Remote Sens. Appl., Vol.40, Article No.101742, 2025. https://doi.org/10.1016/j.rsase.2025.101742
- [13] H. W. Qian and J. L. Mei, “Research on layout design of China’s natural disaster regional emergency rescue center,” J. Catastrophol., Vol.35, pp. 194-199, 2020 (in Chinese). https://doi.org/10.3969/j.issn.1000-811X.2020.02.035
- [14] C. H. Hu, X. L. Zhang, C. Q. Li, C. S. Liu, J. X. Wang, and S. Q. Jian, “Real-time flood classification forecasting based on k-means++ clustering and neural network,” Water Resour. Manage., Vol.36, pp. 103-117, 2022. https://doi.org/10.1007/s11269-021-03014-y
- [15] G. Csardi and T. Nepusz, “The igraph software package for complex network research,” InterJ Complex Syst., Vol.1695, No.5, 2006.
- [16] F. Leisch, “A toolbox for K-centroids cluster analysis,” Comput. Stat. Data Anal., Vol.51, pp. 526-544, 2007. https://doi.org/10.1016/j.csda.2005.10.006
- [17] D. M. Witten and R. Tibshirani, “sparcl: Perform sparse hierarchical clustering and sparse k-means clustering. R package version 1.0.4,” 2018.
- [18] M. Maechler, P. Rousseeuw, A. Struyf, M. Hubert, and K. Hornik, “cluster: Cluster analysis basics and extensions. R package version 2.1.4,” 2022.
- [19] M. Farnaghi, Z. Ghaemi, and A. Mansourian, “Dynamic spatio-temporal tweet mining for event detection: A case study of Hurricane Florence,” Int. J. Disaster Risk Sci., Vol.11, pp. 378-393, 2020. https://doi.org/10.1007/s13753-020-00280-z
- [20] A. M. Ikotun, F. Habyarimana, and A. E. Ezugwu, “Benchmarking validity indices for evolutionary k-means clustering performance,” Sci. Rep., Vol.15, Article No.21842, 2025. https://doi.org/10.1038/s41598-025-08473-6
- [21] Y. Tang, “A spatially interpretable machine learning framework for urban waterlogging risk mapping in Beijing,” PeerJ, Vol.14, Article No.e20977, 2026. https://doi.org/10.7717/peerj.20977
- [22] P. Shi, T. Ye, Y. Wang, T. Zhou, W. Xu, J. Du, J. Wang, N. Li, C. Huang, L. Liu, B. Chen, Y. Su, W. Fang, M. Wang, X. Hu, J. Wu, C. He, Q. Zhang, Q. Ye, C. Jaeger, and N. Okada, “Disaster risk science: A geographical perspective and a research framework,” Int. J. Disaster Risk Sci., Vol.11, pp. 426-440, 2020. https://doi.org/10.1007/s13753-020-00296-5
- [23] A. Curtis, D. Duval-Diop, and J. Novak, “Identifying spatial patterns of recovery and abandonment in the post-Katrina Holy Cross neighborhood of New Orleans,” Cartogr. Geogr. Inf. Sci., Vol.37, pp. 45-56, 2010. https://doi.org/10.1559/152304010790588043
- [24] J. A. Kupfer, P. Gao, and D. S. Guo, “Regionalization of forest pattern metrics for the continental United States using contiguity constrained clustering and partitioning,” Ecol. Inform., Vol.9, pp. 11-18, 2012. https://doi.org/10.1016/j.ecoinf.2012.02.001
- [25] R. Djalante and F. Thomalla, “Disaster risk reduction and climate change adaptation in Indonesia: Institutional challenges and opportunities for integration,” Int. J. Disaster Resil. Built Environ., Vol.3, pp. 166-180, 2012. https://doi.org/10.1108/17595901211245260
- [26] S. Hanson, R. Nicholls, N. Ranger, S. Hallegatte, J. Corfee-Morlot, C. Herweijer, and J. Chateau, “A global ranking of port cities with high exposure to climate extremes,” Clim. Change, Vol.104, pp. 89-111, 2011. https://doi.org/10.1007/s10584-010-9977-4
- [27] V. Gallina, S. Torresan, A. Critto, A. Sperotto, T. Glade, and A. Marcomini, “A review of multi-risk methodologies for natural hazards: Consequences and challenges for a climate change impact assessment,” J. Environ. Manage., Vol.168, pp. 123-132, 2016. https://doi.org/10.1016/j.jenvman.2015.11.011
- [28] M. Petal, K. Ronan, G. Ovington, and M. Tofa, “Child-centred risk reduction and school safety: An evidence-based practice framework and roadmap,” Int. J. Disaster Risk Reduct., Vol.49, Article No.101633, 2020. https://doi.org/10.1016/j.ijdrr.2020.101633
- [29] I. Omer and R. Goldblatt, “Urban spatial configuration and socio-economic residential differentiation: The case of Tel Aviv,” Comput. Environ. Urban Syst., Vol.36, pp. 177-185, 2012. https://doi.org/10.1016/j.compenvurbsys.2011.09.003
- [30] T. Filatova, P. H. Verburg, D. C. Parker, and C. A. Stannard, “Spatial agent-based models for socio-ecological systems: Challenges and prospects,” Environ. Model. Softw., Vol.45, pp. 1-7, 2013. https://doi.org/10.1016/j.envsoft.2013.03.017
- [31] X. Zhai, Y. Zhang, Y. Zhang, R. Liu, C. Liu, X. Zhang, Y. Chen, X. Wang, N. Wright, and “Classifying flash flood disasters from disaster-prone environments to support mitigation measures,” Water Resour. Res., Vol.61, No.4, Article No.e2024WR037389, 2025. https://doi.org/10.1029/2024wr037389
This article is published under a Creative Commons Attribution-NoDerivatives 4.0 Internationa License.