
Paper:
A City-Ready Framework for Urban Flood Resilience in Surabaya Integrating Spatial Exposure and Social Capacity
Bambang Sigit Widodo*1,†
 , Dian Ayu Larasati*2
, Riyadi*2
, Heni Masruroh*3
, Alfi Sahrina*3
, Adib Wahyudi*3
, Rath Sethik*4
, and Enoch Terlumun Iortyom*5
, Dian Ayu Larasati*2
, Riyadi*2
, Heni Masruroh*3
, Alfi Sahrina*3
, Adib Wahyudi*3
, Rath Sethik*4
, and Enoch Terlumun Iortyom*5
*1State University of Surabaya
Lidah Wetan Street, Surabaya, East Java 60213, Indonesia
†Corresponding author
*2State University of Surabaya
Surabaya, Indonesia
*3State University of Malang
Malang, Indonesia
*4Royal University of Phnom Penh
Phnom Penh, Cambodia
*5Ernest Bai Koroma University of Science and Technology
Magburaka, Sierra Leone

Urban flooding threatens service continuity, livelihoods, and social well-being in coastal megacities. We propose and test a framework that integrates high-resolution, Geographic Information System-based exposure mapping (inundation hotspots, drainage proximity, land cover, and critical facilities) with community-level capacity indicators (preparedness, adaptive capacity, and recovery) derived from a mixed-methods design. Using routinely available spatial data and rapid community assessment, we generate a composite index of flood resilience, identify chronic ponding clusters, and prioritize low-regret interventions. Results reveal spatially coherent hotspots that coincide with high built-up density and limited adaptive capacity; neighborhoods with weaker social preparedness also report longer recovery times. A short list of interventions, including micro-drain maintenance, targeted blue–green retrofits near drainage bottlenecks, and neighborhood-level early-warning and risk communication, offers achievable near-term impact within realistic municipal resource constraints. Sensitivity checks indicate index stability with respect to weighting choices. The approach is transferable to other flood-prone cities by coupling GIS layers with community metrics, providing a transparent basis for investment sequencing and policy design. Findings highlight that combining exposure and capacity yields more actionable prioritization than either dimension alone and aligns with global disaster risk reduction principles.
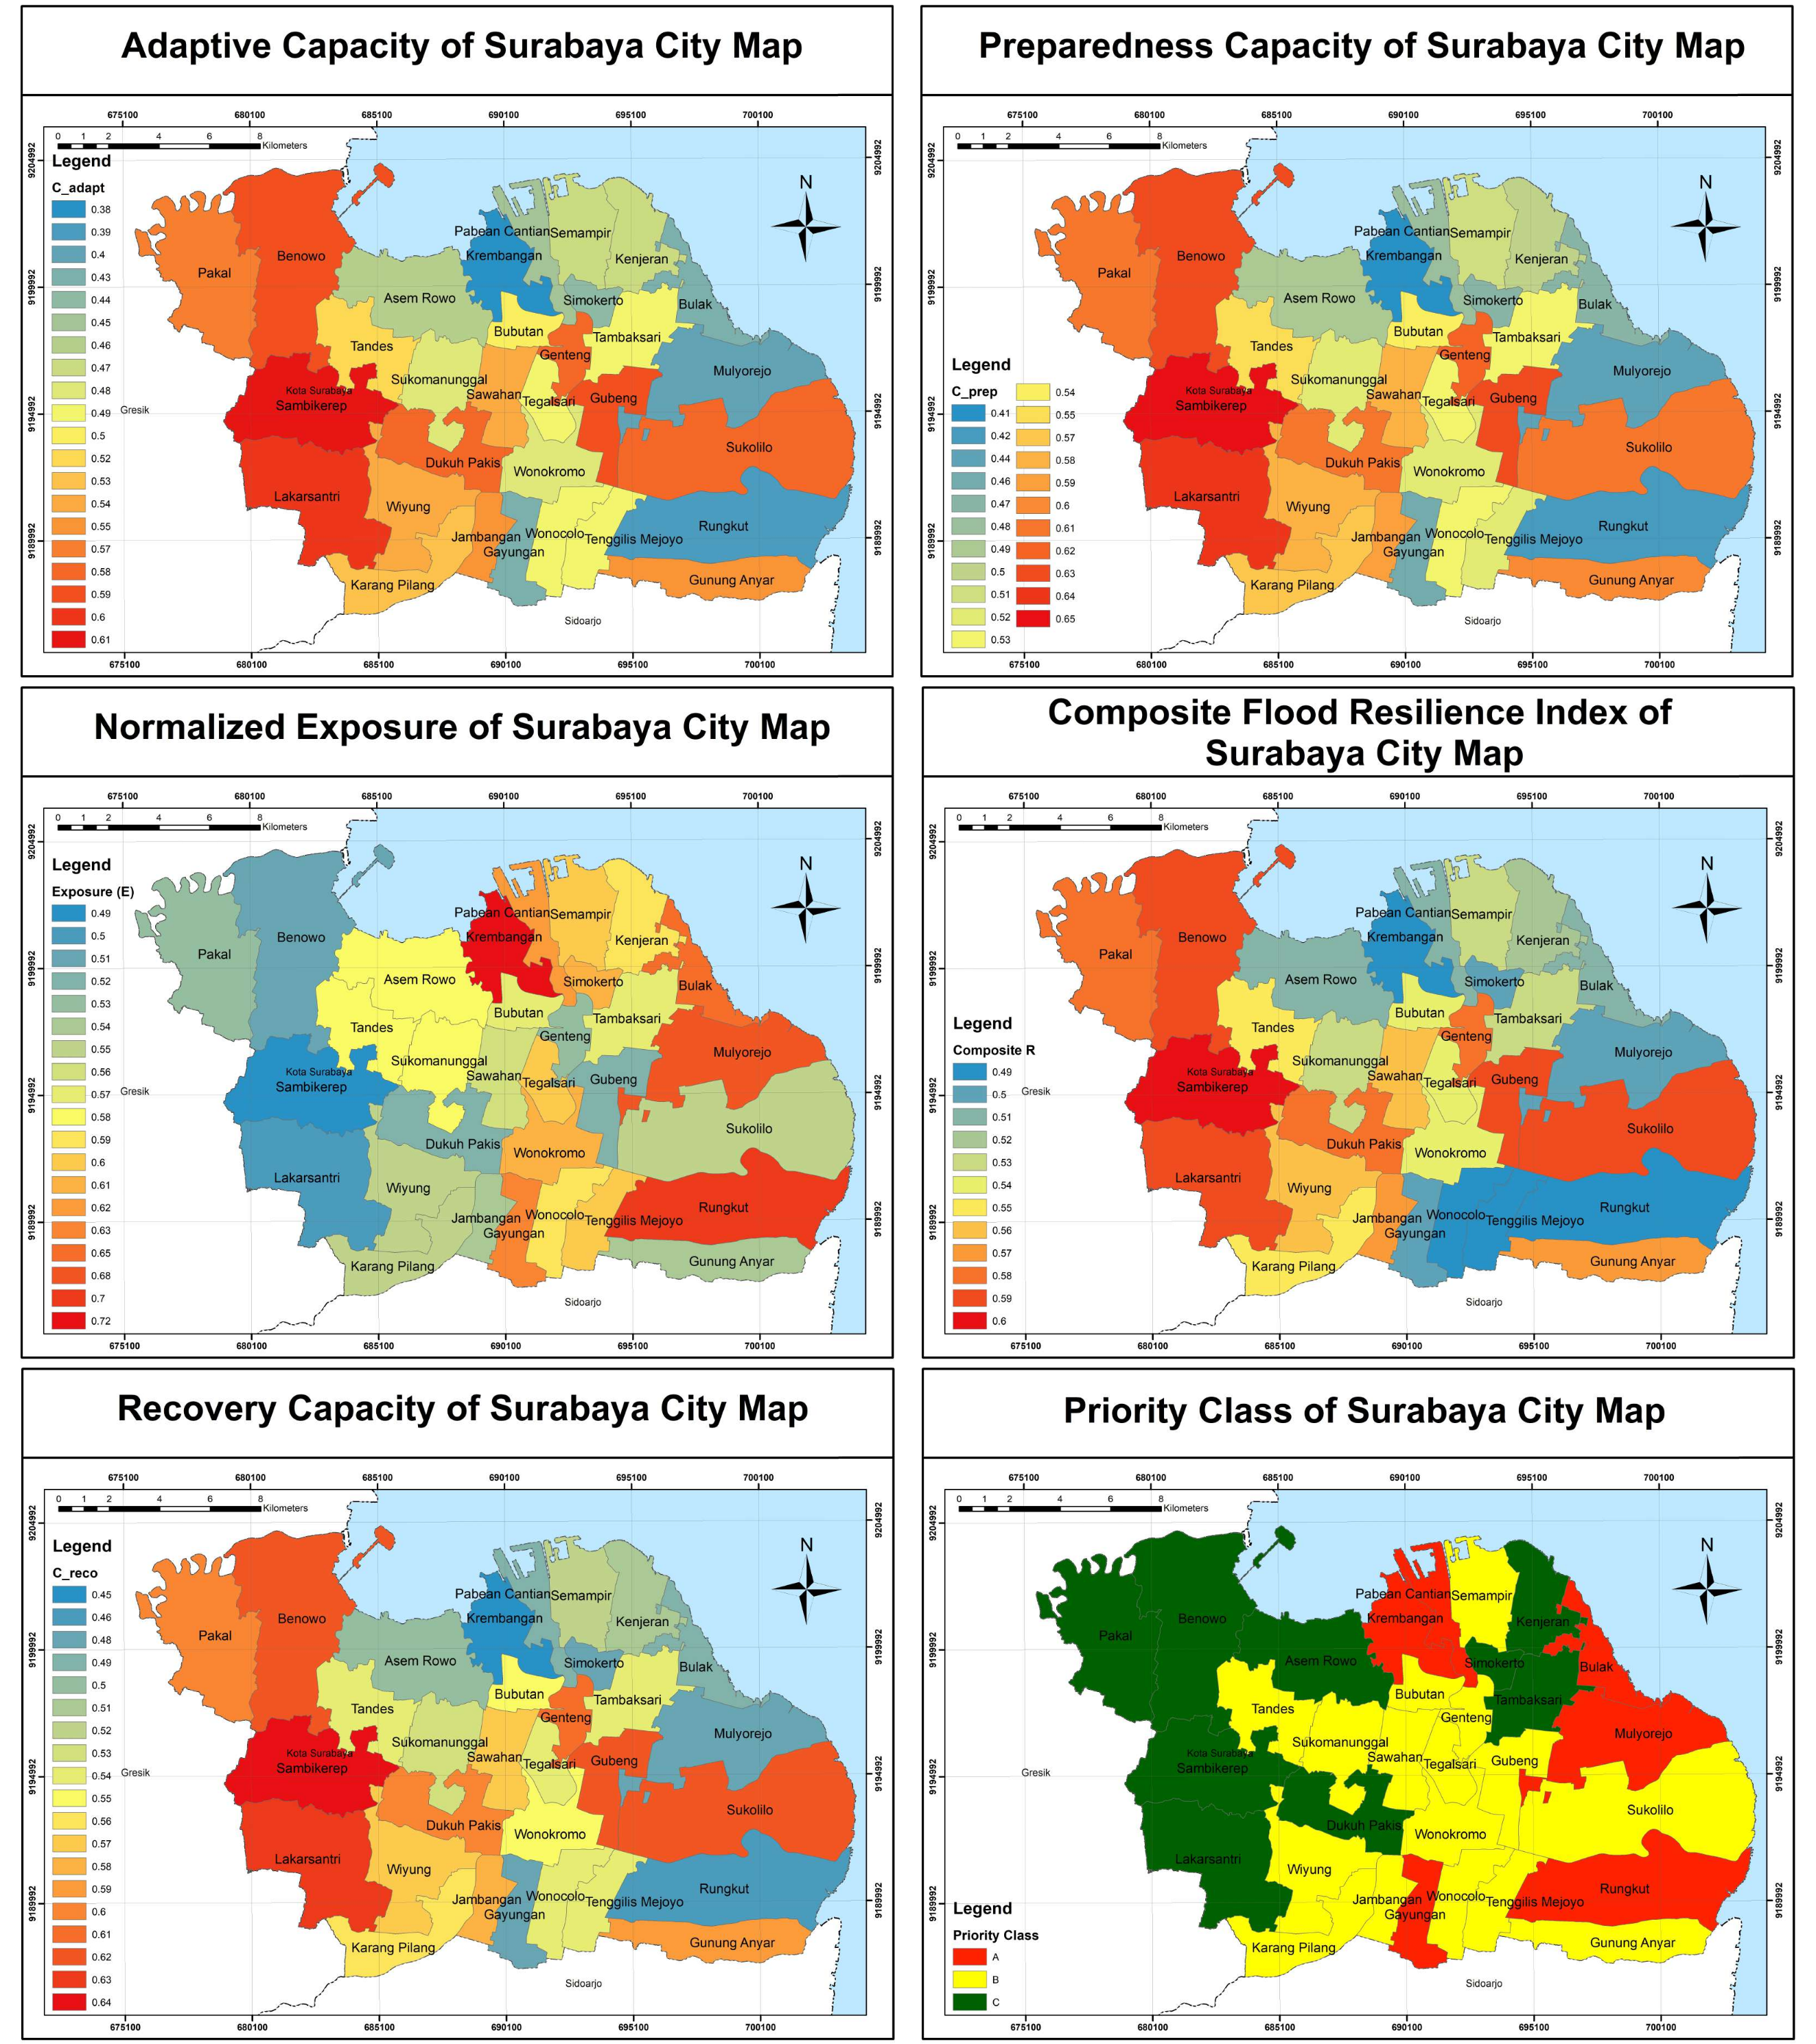
Surabaya City priority class map
1. Introduction
Urban flooding is a persistent stressor for rapidly growing tropical cities, where short, intense rainfall meets extensive impervious surfaces and aging drainage networks, and where the physical signal of pluvial inundation intersects with social and institutional capacity in complex ways. Across Southeast Asia, the trend toward compact urbanization has increased runoff volumes and shortened concentration times, while maintenance bottlenecks in tertiary inlets and neighborhood-scale channels have sharpened the depth and duration of ponding after storms. These dynamics are not only a function of the built form and hydraulics, but also of how communities anticipate, absorb, and recover from recurrent disruptions, meaning that flood risk is better understood as a coupled system of exposure and capacity rather than a strictly hydrological problem 1. Recent reviews of urban flood resilience highlight this shift, arguing that city decision-makers increasingly need operational frameworks that can blend spatial exposure with social preparedness, enable prioritization under budget constraints, and generate a transparent pipeline from map to municipal action 2.
International policy has changed in tandem with this conceptual turn. The Sendai Framework for Disaster Risk Reduction emphasizes the need to understand hazards and exposure, strengthen governance, invest in risk reduction for resilience, and enhance preparedness, explicitly linking these priorities to actionable targets that cities can monitor over time. For coastal and deltaic agglomerations, the practical question is how to translate those priorities into tools that operate at the neighborhood scale where maintenance crews, community leaders, and capital works actually interact. The most useful resilience assessments are those that integrate geospatial evidence with community indicators in a way that can be picked up by line departments and neighborhood committees without a prohibitive data burden or specialized software 3.
Surabaya, Indonesia, provides a salient case for such translational work. The city sits on low coastal terrain, has grown through layers of kampung fabric and newly paved developments, and manages drainage through a hierarchy of channels, pumps, and outfalls that have been periodically reviewed under the Surabaya Drainage Master Plan. Planning documents and related technical studies highlight areas where backwater effects, inlet clogging, and local capacity constraints combine to produce recurring ponding after heavy rains, particularly along corridors with high built-up densities and sensitive land uses. Although major works are sequenced across plan cycles, the everyday performance of the system depends heavily on neighborhood-level maintenance and preparation. This neighborhood scale is particularly relevant because integrating exposure and community capacity allows municipalities to identify practical and low-regret interventions that can improve resilience in the near term 1.
The scholarly landscape offers several ingredients for building this approach. A steady stream of studies has advanced GIS- and remote-sensing-based exposure mapping, whereas multi-criteria decision-making methods have matured to combine heterogeneous indicators into tractable indices. Simultaneously, the parallel literature on community resilience has emphasized preparedness behaviors, social capital, and recovery trajectories as explanatory variables for differential impacts under comparable hazard conditions. Despite these advances, reviews repeatedly note the gap between sophisticated assessment techniques and city-ready tools that municipal staff can own and update using routinely available data. In practice, cities require methods that are sensitive to local contexts but robust to data limitations, capable of highlighting coherent clusters where exposure is high and capacity is low, and anchored in a policy vocabulary that maps directly to maintenance schedules, micro-retrofits, and risk communication 4.
Blue–green infrastructure (BGI) has emerged as an appealing lever in this area because it can intercept runoff, increase storage, and improve water quality while offering co-benefits for public spaces and heat mitigation. Nevertheless, the siting of such measures requires a grounded understanding of neighborhood hydraulics and institutional feasibility, and the benefits from BGI tend to be maximized when paired with mundane but critical actions such as gully-pot cleaning, debris management around inlets, and coordination of micro-drain maintenance with local traffic and vending patterns 5. Evidence from reviews and recent case studies suggests that when BGI is targeted to bottleneck cells identified by exposure maps and complemented by risk communication and preparedness, cities can shave minutes to hours off standing water and reduce the frequency of nuisance floods that cumulatively burden households and services. This is the spirit in which we frame the present study, positioning BGI not as a silver bullet but as part of an integrated, budget-aware portfolio 6.
Against this backdrop, our contribution is to develop and apply an integrated decision framework for Surabaya that couples high-resolution exposure mapping with a tractable set of community capacity indicators to produce a short list of feasible near-term actions. Conceptually, we treat flood resilience at the Kelurahan scale as a composite of hazard exposure and social capacity, and operationalize this through standardized indicators that can be updated as new data arrive 7. We combined local inundation evidence, drainage proximity, land cover, and critical facility proximity within a GIS environment with survey-based measures of preparedness, adaptive capacity, and recovery. Analytically, we computed statistically coherent clusters, tested the stability of index rankings under plausible weight perturbations, and translated the resulting geography into a set of measures that a municipality could implement within a planning cycle 8. Practically, we positioned the framework so that it can sit alongside Surabaya’s drainage planning context and neighborhood preparedness programs, enabling an incremental pathway where maintenance, micro-retrofits, and communication reinforce one another as budgets and institutional bandwidth allow 9.
The remainder of this paper proceeds from this premise and is designed for municipal use. We begin by detailing the Surabaya study area and data sources, including routinely collected spatial layers and rapid community assessments that were aligned with ethical guidelines and de-identification practices. Thereafter, we describe the construction of our composite indicators, explaining how we standardize directionality and test sensitivity so that the rankings are intelligible to non-technical stakeholders 10. Next, we report the spatial patterning of exposure and capacity, identify neighborhoods in which these dimensions are the most misaligned, and connect these locations to a small set of measures whose mechanisms and operating constraints are clearly specified 10. Finally, we reflect on how the framework maps onto Sendai priorities and how it may be adapted to other Southeast Asian cities that share Surabaya’s hydrometeorological profile and institutional realities. Our goal is to help bridge the persistent gap between analysis and action by offering a transparent approach that is empirically grounded, methodologically defensible, and administratively feasible within the constraints faced by real cities 11.
2. Materials and Methods
This study was designed to support municipal planning and neighborhood preparedness and employs a multi-stage analytical framework. The methodology integrates spatial exposure and community capacity indicators through composite index construction, followed by hotspot detection and prioritization logic to form a cohesive decision-making structure. The framework couples geospatial layers that are widely available in Indonesian cities with rapid, ethically grounded community assessments so that both the physical signal of pluvial inundation and social capacity to anticipate and recover are represented in a common decision space. We used administrative districts (Kecamatan) as the core unit of analysis because they align with the local governance routines for maintenance, risk communication, and budgeting. All indicators were standardized to facilitate interpretation by non-specialists and enable a transparent pathway from maps to a short list of feasible measures. The guiding premise is that a “good enough” decision framework that can be maintained and iterated by city staff is more valuable in most planning cycles than a fragile model that cannot be updated without specialist support 12.
2.1. Study Area and Governance Context
Surabaya is a coastal metropolis with a complex drainage hierarchy that blends legacy kampung layouts, newly paved developments, and dense road networks connected to secondary and primary channels. Low relief and episodic high-intensity rainfall create frequent conditions for rapid surface runoff and nuisance ponding, particularly where tertiary inlets are clogged or where microtopography funnels water toward bottlenecked segments. Municipal responsibilities are distributed across public work units for drainage and roads, environmental agencies for blue–green spaces, and subdistrict offices for mobilizing neighborhood preparedness and cleanup days. This distributed governance architecture means that actionable analysis must speak to different users: engineers who schedule inlet cleaning and gully-pot vacuuming, planners who site pocket green infrastructure, and community leaders who convene preparedness meetings. By working at the Kelurahan scale and reporting patterns as coherent clusters rather than as isolated cells, our framework aims to bridge these constituencies and encourage synchronized actions 13.
2.2. Data Sources and Preprocessing
We assembled two families of indicators—spatial exposure and social capacity—along with administrative boundaries and ancillary layers that helped interpret the patterns. The exposure family comprises observed or reported inundation points and extents compiled from municipal situation reports, field visits, and curated community submissions during the 2019–2025 seasons; proximity to the drainage network measured along the road graph to capture how rapidly water can access channels; land cover with a focus on imperviousness proxies, such as built-up fractions and road density; local slope and micro-relief derived from a hydrologically corrected digital elevation model to identify flow accumulation tendencies; and proximity to sensitive and critical facilities, including schools, clinics, and markets, where shallow ponding triggers outsized social costs. Each layer was projected onto a common coordinate system, clipped to the city boundary, and harmonized with neighborhood polygons using area-weighted aggregation or network-based distance summaries. We reduced duplication where two indicators encoded similar mechanisms, for example, using either the built-up ratio or road imperviousness, rather than both, when collinearity was evident 14.
The social capacity family was developed using a rapid assessment protocol designed for low respondent burden and high comparability across neighborhoods. Modules included household preparedness behaviors, such as the presence of basic protective equipment, awareness of early-warning cues, and knowledge of safe routes; adaptive capacity proxies, such as access to savings, micro-insurance, or mutual-aid mechanisms; and recovery markers, including the typical time to restore mobility or reopen small businesses after heavy rain. Enumerators worked with neighborhood leaders to ensure inclusive coverage and avoid repeatedly sampling the most vocal households. To protect privacy and reduce the risk of re-identification, all records were de-identified at the source, no exact addresses were retained, and only aggregated summaries at the Kelurahan level were used in the analysis. Qualitative notes captured issues such as vendor encroachment over inlets or recurring debris sources, and served as contextual annotations during interpretation 15.
Administrative boundaries for Kelurahan and subdistricts were validated against recent municipal shape files, and road graphs were simplified to remove dangling segments unrelated to runoff conveyance. All spatial joins and aggregations were scripted so that the pipeline could be rerun when new data arrived. Before indicator construction, we performed basic quality checks, including range screening, visual inspection of outliers, and cross-layer plausibility (for example, confirming that the reported ponding points do not systematically fall in parks or open water unless they correspond to known depressions or blocked culverts).
2.3. Indicator Definitions, Directionality, and Normalization
This study was designed to support municipal planning and neighborhood preparedness and employs a multi-stage analytical framework. The methodology integrates spatial exposure and community capacity indicators through composite index construction, followed by hotspot detection and prioritization logic to form a cohesive decision-making structure. For exposure layers representing adverse conditions, such as inundation frequency, flow accumulation propensity, or distance to functioning drains, the values were inverted or rescaled such that higher standardized values consistently represented better resilience conditions. Capacity indicators were coded in their natural directions, with larger values indicating stronger preparedness, greater adaptive resources, or shorter recovery. All indicators were normalized to the unit interval using min-max scaling within a citywide distribution 16. Although z-score normalization is widely used in resilience studies, bounded min-max normalization was selected to improve interpretability and communicate results to municipal stakeholders and decision-makers. To guard against the undue influence of extreme observations, we capped distributions at the 2nd and 98th percentiles prior to the min-max transformation, noting any neighborhoods with truncated values so that analysts could revisit data provenance rather than allowing tails to dominate 17.
Conceptually, we grouped capacity into three dimensions corresponding to concrete program levers. Preparedness captures anticipatory actions such as understanding risk maps, knowing whom to contact for assistance, or keeping gutters clear before storms. Adaptive capacity aggregates resources that allow households to cope with disruptions, including financial buffers and strong social ties that mobilize labor and information. Recovery reflects the speed and reliability with which normal activity resumes after ponding and is measured through self-reported times to reopen stalls or reestablish safe mobility for children and the elderly. By distinguishing these dimensions, we enabled departments to act on the specific levers they control while observing an integrated composite at the neighborhood scale.
2.4. Composite Resilience Index and Weighting
Neighborhood flood resilience was defined as a composite function of reduced spatial exposure and increased social and adaptive capacity. The composite index \(R\) was constructed as the average of the four dimension scores of one exposure component and three capacity components—after bringing each to a \([0,1]\) scale. The composite flood resilience index was calculated using the following equation:
2.5. Hotspot Detection and Spatial Coherence
Although composite indices are useful for summarization, decisions in cities are often triggered by clusters of concern rather than by isolated outliers. For coherent surface geographies where exposure remains high and capacity is weak, we computed local indicators of spatial association on both the inverted exposure dimension and the composite resilience index. Neighborhoods that appear low on RRR and are surrounded by similarly low neighbors form “cold spots” of resilience that merit concerted attention because interventions in one area may reinforce benefits nearby. In parallel, we examined the proximity of known bottleneck inlets, road geometry that channels sheet flow into depressions, and micro-relief features revealed by the digital elevation model (DEM) to understand why clusters form where they do. This interpretation step supports measures that address mechanisms rather than simply responding to symptoms.
2.6. Translating Maps to Measures Through Suitability and Feasibility
To move from diagnosis to action, we overlay two pragmatic lenses: suitability of blue–green interventions and feasibility under municipal routines. Suitability is derived from a land-surface screen that favors cells near bottlenecked inlets or along corridors with repeated reports of shallow ponding, on slopes sufficiently gentle for bioretention to function, and on or adjacent to public right-of-way, where implementation hurdles are lowest. We did not attempt a full hydraulic sizing exercise; instead, we identified candidate cells where small rain gardens, curb extensions, or porous patches could plausibly intercept runoff before it accumulates in depressions. Feasibility considers whether the proposed measures align with scheduled maintenance, whether traffic and vendor patterns allow temporary work, and whether Kelurahan offices have active neighborhood groups that can support risk communication. The overlay yields a short list of measures that can be initiated within a planning cycle, recognizing that larger capital projects may proceed over longer horizons 3.
2.7. Prioritization Logic at the Neighborhood Scale
As resources are limited, we allocated attention using a simple but communicable matrix that crosses exposure and capacity. Neighborhoods that sit in the high-exposure, low-capacity quadrant are placed in Priority A; those with high exposure but medium capacity are placed in Priority B; and those with medium exposure and low capacity are placed in Priority C. This scheme avoids perverse incentives, where areas with entrenched exposure but strong capacity monopolize investments, and it highlights locations where a small improvement in preparedness or a targeted micro-retrofit could unlock disproportionate benefits. This classification scheme helps prevent disproportionate allocation of resources to areas with high exposure but already strong capacity, thereby ensuring that limited interventions are directed toward locations with the greatest combined vulnerability. Moreover, the matrix provides community leaders with a language to advocate for specific support, for example, arguing for an early-warning refresh and gully-pot cleaning ahead of the monsoon, when preparedness is flagging and inlets are known to clog.
2.8. Sensitivity Analysis and Robustness Checks
We report three forms of robustness evidence. First, we examined how neighborhood ranks changed under the \(\pm 25\)% weight perturbations described earlier; high Spearman rank correlations with the baseline imply that prioritization is insensitive to reasonable weight choices. Second, we implemented leave-one-indicator-out tests for each dimension to identify where a particular proxy may drive the classification; neighborhoods that flip categories under such tests are flagged for closer scrutiny during stakeholder review. Third, we conducted a sanity check against independent observations by comparing low-resilience neighborhoods with independent notes on inundation persistence and service disruptions, not to claim causal validation but to ensure that the composite signal is not at odds with lived experience captured in field notes.
2.9. Ethics, Data Protection, and Reproducibility
All human-facing instruments and procedures followed institutional ethical guidelines. Respondents provided informed consent, their participation was voluntary, and no personal identifying information was retained in the analytical files. We stored de-identified data in a restricted workspace and released only neighborhood aggregates in maps and tables. Spatial scripts and indicator construction notebooks are organized such that the entire pipeline can be rerun when new seasons of data become available, which is central to the “city-ready” ethos of the framework. We included a reproducibility note with software versions and a brief changelog documenting updates to layers or indicator definitions so that municipal users could track differences across annual cycles.
2.10. GenAI Use Disclosure
An AI assistant was used to help structure the manuscript in English and ensure clarity and coherence across sections. The study design, data curation, spatial analysis, indicator construction, and interpretation of the findings remain the sole responsibility of the authors. All sources were cited and no proprietary or confidential information was provided to the assistant.
3. Results
3.1. Respondent Profile and Spatial Coverage of Evidence
The survey achieved citywide coverage with responses drawn from 29 districts across Surabaya and a total sample of approximately 800 participants, which provided both breadth and sufficient density for neighborhood-scale interpretation. Three districts, Krembangan, Mulyorejo, and Rungkut, contributed a particularly large share of observations and thus featured prominently in the spatial signal reported below. The gender composition skews toward female respondents at around 62% of respondents, which is consistent with community participation patterns in neighborhood meetings and preparedness activities, while the age structure is anchored by the 17–25 age group at approximately 38%–39%, followed by a balanced representation of adults in their late twenties to forties and a smaller share of older residents. Education is tilted toward senior secondary and tertiary qualifications, which tends to raise baseline awareness of flood issues but does not guarantee consistent protective behaviors on its own, a point we revisit when linking attitudes to practices. The religious and occupational mix reflects the city’s diversity, with a notable number of small business owners and service workers whose livelihoods are sensitive to shallow, short-duration ponding. Together, these features suggest that the dataset is well placed to capture how everyday disruptions intersect with social capacity and that the results are not dominated by a single enclave or demographic.
3.2. Exposure Patterns and Neighborhood-Scale Clustering
The mapped exposure surface demonstrates a familiar geography in which recurrent shallow ponding aligns with dense built-up corridors, tertiary inlet bottlenecks, and micro-depressions visible in digital elevation data, particularly along sections of the Krembangan waterfront approaches and pockets of Mulyorejo and Rungkut, where rapid development has outpaced inlet maintenance. When we invert the exposure and overlay the composite resilience index at the Kelurahan level, statistically coherent clusters emerge rather than isolated outliers. Neighborhoods with repeated reports of water standing beyond one hour after peak rainfall form low-resilience cold spots when their capacity scores are also weak, whereas areas adjacent to well-maintained secondary drains can present medium exposure while maintaining higher composite scores because preparedness behaviors and local information flows allow more rapid recovery. Importantly, the cluster structure helps move the discussion away from single intersections or anecdotal hotspots and toward contiguous neighborhoods, where coordinated maintenance, micro-retrofits, and communication can reinforce one another 19.
The normalized exposure map (Fig. 1) visually quantifies the physical burden of flooding across the city’s 31 districts. Higher exposure values (indicated in red) are concentrated in the northern and eastern sectors, specifically within the industrial and dense residential corridors of Krembangan, Mulyorejo, and Rungkut. These hotspots correlate with areas of low elevation and high surface impermeability, where the drainage network frequently reaches its capacity during peak rainfall events.
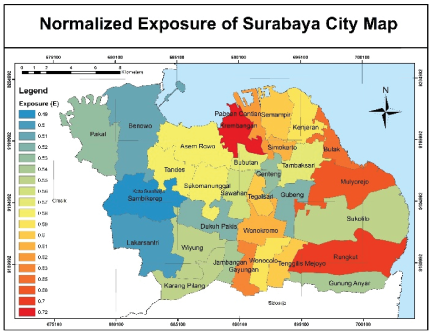
Fig. 1. Normalized exposure map (author, 2026).
Equation \(\eqref{eq:1}\) summarizes the flood resilience profile across the 29 districts of Surabaya, combining the exposure scores with three dimensions of community capacity: preparedness, adaptive capacity, and recovery into a composite index. This classification highlights distinct geographies of concern. Districts such as Krembangan, Mulyorejo, and Rungkut consistently emerged with high exposure values coupled with weak capacity indicators, yielding composite resilience scores below 0.50 and placing them in Priority Class A. These areas reported recurrent ponding, longer recovery times, and limited preparedness routines, underscoring the need for immediate low-regret interventions 20.
Other districts, including Wonokromo and Tegalsari, exhibited high exposure but moderate preparedness and adaptive capacity, producing composite scores ranging from 0.53 to 0.55. These are categorized as Priority Class B, where modest investments in preparedness, communication, and targeted inlet maintenance can unlock faster recovery before capital-intensive work is scheduled.
Several peripheral districts, such as Sukolilo, Genteng, and Tandes, demonstrate medium-to-high exposure but stronger social and adaptive indicators, with composite scores around 0.57–0.59. These areas are therefore placed in Priority Class B, reflecting a relatively better balance between hazard and capacity, although preparedness must be continuously reinforced to sustain resilience.
Districts such as Kenjeran, Tambaksari, Asemrowo, and Bulak demonstrate combinations of medium exposure with weaker preparedness and adaptive resources, resulting in Priority Class C. Although not the most exposed, these areas remain vulnerable because limited community resources and slower recovery trajectories mean that even moderate events can lead to prolonged disruptions.
Therefore, the full citywide map does not present a uniform pattern but a patchwork of priorities. High-density waterfronts and industrial corridors in the north and east concentrate Priority A clusters, while more central mixed-use districts fall into Priority B, and a group of peripheral neighborhoods displays Priority C patterns. This distribution suggests that different policy levers must be sequenced geographically: intensive maintenance and micro-retrofits in Priority A, preparedness reinforcement in Priority B, and social capacity-building in Priority C. The classification offers municipal planners a transparent and reproducible basis for targeting low-regret measures where they are most needed and for aligning neighborhood-level preparedness with citywide drainage planning.
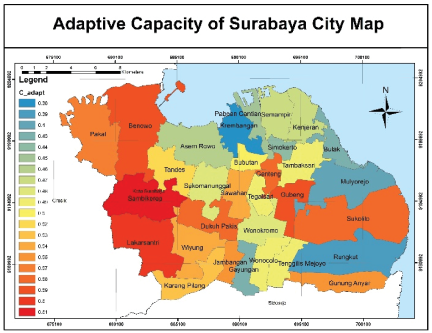
Fig. 2. Adaptive capacity map (author, 2026).
3.3. Capacity Dimensions, Knowledge, Attitudes, and Behaviors
Across the city, the knowledge base about flood causes and local risk is relatively strong, which is an unsurprising result considering the frequency of seasonal disruptions and the presence of tertiary education among the respondents. Attitudes were broadly pro-prevention, with most residents endorsing inlet cleanliness and routine pre-storm checks as community responsibilities; however, the translation of attitudes into routine behaviors was uneven. In several Kelurahans inside the Krembangan-Rungkut arc, households report understanding early-warning cues and knowing whom to contact; however, the self-reported frequency of gutter clearing, waste separation to reduce inlet debris, and pre-event checks remain inconsistent. This divergence between knowing and doing matters because neighborhoods with similar exposure but more regular maintenance report noticeably shorter recovery times. The pattern highlights the role of micro-practices that are easy to overlook in planning documents but decisive in the hours after intense rainfall 21.
The adaptive capacity map (Fig. 2) illustrates a community’s ability to adjust to and moderate the impact of flooding. Although central districts, such as Genteng and Tandes, exhibit higher adaptive scores (darker orange to red) owing to stronger social capital and resources, the map identifies a critical “capacity gap” in several northern districts. Despite high awareness, these areas demonstrate lower scores (blue to green), reflecting a lag in transforming knowledge into consistent protective physical adaptations at the household level.
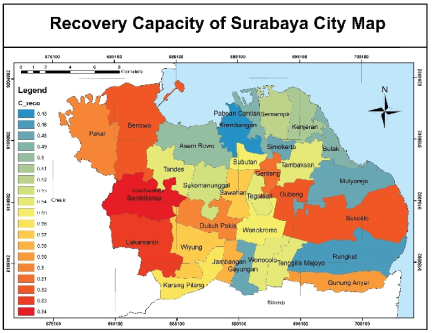
Fig. 3. Recovery capacity map (author, 2026).
3.4. Psychosocial Resilience and Recovery Experiences
Psychosocial indicators provide a nuanced picture. Social ties, mutual aid, and informal information channels are widely present and are often mobilized during disruptions, contributing positively to adaptive capacity and helping smooth access to temporary shelters or shared equipment 4. Simultaneously, respondents pointed to stressors that accumulate over repeated events, particularly among small traders and caregiving households who juggle income loss with additional safety duties for children and elders. Several neighborhoods would benefit from simple but targeted counseling and risk communication refreshers that normalize protective routines and reduce anxiety during heavy rain episodes. Measured through self-reported time to resume mobility and reopen small businesses, the recovery dimension varies across clusters in ways that align with preparedness practices and inlet maintenance rather than headline exposure alone, reinforcing the composite view of resilience rather than a hazard-only lens.
Spatial variations in the duration of post-event disruptions are captured in the recovery capacity map (Fig. 3). The map highlights that recovery is not solely a function of water depth. Districts with well-established mutual aid networks and informal information channels, such as those in the southern and western peripheries, demonstrate higher recovery scores. Conversely, lower scores in the northeast reflect areas where livelihoods are more sensitive to prolonged ponding, leading to slower returns to normalcy for small businesses and residents.
3.5. Infrastructure and Service Disruption Impacts
The infrastructure story is less about catastrophic failures and more about the cumulative burden of nuisance floods that interfere with transportation, schooling, and small-scale commerce. The reported impacts concentrate along transport routes where shallow but persistent ponding reduces throughput, causes detours, and spreads knock-on delays into adjacent neighborhoods. Sensitive facilities such as schools and clinics experience intermittent access issues that amplify social costs beyond what water depth alone would suggest. Where tertiary inlets are obstructed by debris or vendor encroachment, even well-sized secondary channels cannot drain surface water rapidly, leading to a perception that flooding is “everywhere” when the operative mechanism is a short chain of small bottlenecks. These observations support the intervention logic focused on inlet-level maintenance, micro-regrading at driveway mouths that block gutter flow, and pocket blue–green installations positioned to intercept runoff upstream of known depressions 9.
The preparedness capacity map (Fig. 4) benchmarks the proactive measures adopted by residents, including routine gutter cleaning and waste management. A significant cluster of low preparedness (blue shades) is visible in the eastern waterfront, where the survey data suggest that despite high flood frequency, the translation of risk awareness into routine “mundane maintenance” remains inconsistent, creating a bottleneck for overall resilience.
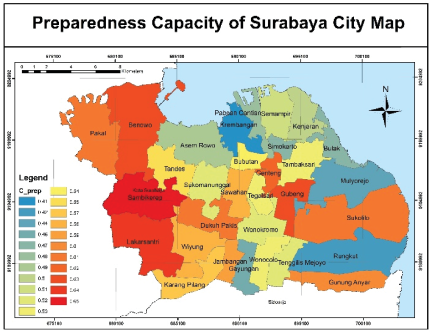
Fig. 4. Preparedness capacity map.
3.6. Composite Index Results and Priority Classes
When the capacity dimensions are combined with the inverted exposure score, the composite resilience index ranks neighborhoods in a way that is both intuitive and operational 22. Priority A neighborhoods occupy quadrants of high exposure and low capacity, often where preparedness behaviors are inconsistent and informal waste practices interfere with inlets. These neighborhoods are found in parts of Krembangan near tidal influences and in select Rungkut corridors where rapid paving has created hard-edged flow paths. Priority B covers high-exposure areas with moderate capacity, where a modest investment in preparedness and communication can unlock faster recovery, even before physical work is deployed. Priority C identifies places with medium exposure but low capacity, often dormitory neighborhoods with limited volunteer bandwidth, where risk communication, community drills, and simple household-level measures can yield immediate dividends while the city schedules inlet work. The citywide map does not present a single sweeping front but a patchwork of clusters where targeted and synchronized measures are likely to compound 23.
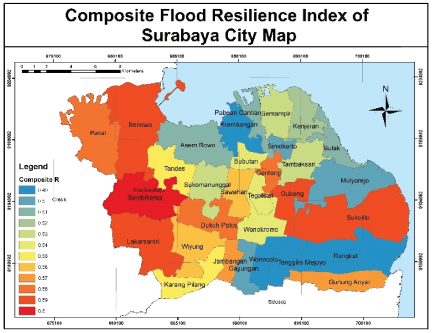
Fig. 5. Composite flood resilience index map.
The composite flood resilience index map (Fig. 5) integrates the previous four dimensions into a single metric using an equal-weighting formula. This map reveals the “true” resilience landscape of Surabaya, where low-resilience zones (red) emerge not only where the water is deepest but also where high exposure meets low social capacity. This integrated view allows planners to see beyond the hazard and identify neighborhoods where technical drainage solutions must be paired with social intervention.
3.7. Sensitivity and Robustness of Rankings
The equal-weighted baseline is intentionally transparent; however, the rankings prove resilient to plausible changes. When we perturb the weights by plus or minus a quarter for each dimension while preserving a unit sum, the Spearman correlation between the perturbed and baseline ranks remains high, indicating that the ordering of neighborhoods is not an artifact of a particular weighting choice. A leave-one-indicator-out analysis reveals a handful of Kelurahans whose classification is sensitive to the presence or absence of a single proxy, typically in cases in which two dimensions sit near a class boundary. These neighborhoods are flagged for discussion during stakeholder sessions so that local knowledge can arbitrate whether classification should be nudged by observed maintenance patterns or recent works not yet reflected in the data. Finally, a sanity check against independent field notes on standing water duration and access disruptions reveals broad agreement with the low-resilience clusters, lending further confidence that the composite signal captures lived experiences rather than merely reproducing statistical artifacts 6.
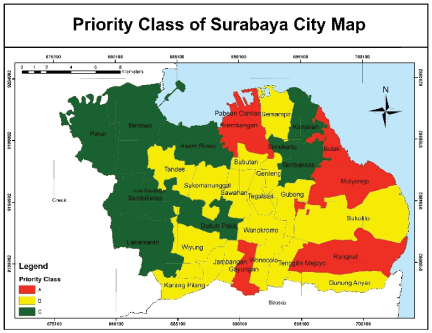
Fig. 6. Priority class map.
3.8. From Maps to Measures Within Municipal Routines
Translating a spatial signal into action leads to a short list of feasible measures within routine budgets and operating practices. In Priority A clusters, the first order of business is to restore conveyance through coordinated inlet cleaning, debris management near vendor stands, and rapid micro-drain maintenance timed ahead of the monsoon. In parallel, pocket blue–green installations, such as curb-extension bioretention and small rain gardens, are located along corridors that feed the depressed cells identified on the exposure surface so that runoff is intercepted before it accumulates 24. In Priority B areas, a paired strategy of risk-communication refresh and targeted porous patches near schools and clinics helps secure near-term benefits, while the city sequences larger works. Priority C focuses on rebuilding preparedness muscle memory through neighborhood drills, early-warning refreshers, and simple household measures, such as portable barriers and gutter hygiene, ensuring that medium exposure does not cascade into prolonged recovery times. This coordinated approach is not novel. Instead, it reflects a deliberate focus on reliable actions that city crews and neighborhood groups can repeat and scale without specialized equipment.
Finally, the priority class map (Fig. 6) translates the composite index into an actionable decision-support tool. By classifying districts into Priority A (red), Priority B (yellow), and Priority C (green), the map provides a clear hierarchy for municipal resource allocation. Priority A districts, concentrated in the north and east, are flagged for immediate structural and non-structural interventions, whereas Priority B and C areas are categorized for preparedness reinforcement and long-term capacity building, respectively.
4. Discussion
The results indicate a pattern that has become increasingly characteristic of fast-growing tropical cities: flood risk is not merely the cartographic imprint of rainfall over land cover but the joint outcome of exposure and everyday practices that either keep small problems small or silently amplify them into citywide disruptions. In Surabaya, the cold spots of resilience are less a surprise than a confirmation that recurrent ponding, inlet bottlenecks, and uneven preparedness co-produce longer recovery times, particularly where dense built-up corridors concentrate runoff into short-reach segments with constrained conveyance 15. This is why the neighborhoods identified as Priority A—high exposure coupled with low capacity—are not only more frequently inundated, but also slower to return to normal, and why the same areas can improve meaningfully when mundane, replicable actions are synchronized rather than treated as ad hoc responses 25.
An important policy implication is that fine-grained analysis must be translated into a language that decision-makers can deploy under routine constraints. The composite index does not replace absolute engineering evaluation methods such as hydraulic simulation, drainage capacity analysis, or design return period calculations. Instead, it complements these absolute assessments by providing a relative prioritization framework that identifies where limited resources can produce the greatest immediate improvements in resilience under real-world municipal constraints. The method encourages municipal units to think in terms of “packages” rather than isolated fixes; inlet cleaning and debris management are timed alongside curb-extension bioretention or porous patches; neighborhood drills and early-warning refreshers are staged in the same weeks that maintenance teams address known bottlenecks; and qualitative observations about vendor encroachment or driveway geometry are logged into a shared register so that recurring micro-obstacles are not rediscovered after every storm. When such packages are targeted to clusters instead of scattered points, the city benefits from economies of scope—crews move shorter distances between related tasks, residents see visible coordination, and the sense of reliability improves even before capital-intensive works materialize 18.
The second implication pertains to governance and learning. The framework is deliberately “city-ready” in three important senses: it runs on routinely available municipal data, it can be refreshed seasonally as new observations emerge, and it provides a structured workflow that supports institutional delegation across engineering, planning, and community preparedness units, thereby facilitating coordinated implementation and resource allocation. This allows Surabaya to treat flood resilience not as a one-off diagnostic but as a living process that accumulates evidence and refines priorities over time. The simplest version of this learning loop involves rerunning the indicator pipeline after the monsoon and convening short debriefs with subdistrict offices to compare rankings with lived experiences. A more mature version would couple the framework to a public dashboard where Kelurahan leaders can view their scores and share micro-initiatives that worked, seeding peer learning across neighborhoods. Either way, the value lies not in the single number attached to a neighborhood, but in the habit of examining exposure and capacity together, determining where each lever can move most, and rewarding teams that reduce persistence of ponding in places that have historically underperformed 4.
A third implication is that blue–green interventions should be framed as complements to maintenance, rather than as substitutes. In practice, the curb extensions, small rain gardens, and porous patches that the suitability overlay highlights are effective primarily because they intercept runoff before it reaches the inlets that are prone to clogging, thereby reducing the burden on a known bottleneck while improving streetscape quality. Their performance is strongest when maintenance reliability is increasing, not decreasing; otherwise, installations risk becoming decorative islands in poorly managed systems 11. This perspective encourages staggered investment, beginning with maintenance reliability, then layering micro-retrofits in the corridors where the exposure surface indicates the greatest return, and only then contemplating larger interventions that require design, permission, and longer lead times. The approach helps cushion the political cycle because visible, modest wins in the short term sustain support, while more capital-intensive plans move through standard approvals 13.
However, this study has some limitations. The exposure surface is built from a combination of municipal reports, field notes, and curated community submissions and will miss events that go unreported and may overrepresent locations where reporting is more active. Similarly, rapid survey capacity indicators, while pragmatic and ethically grounded, do not provide a full inventory of household resources or institutional networks. Nevertheless, sensitivity checks suggest that the rankings are robust to plausible weight shifts, implying that the signals are not artifacts of a particular indicator choice 26. More importantly, the framework is not a terminal verdict about neighborhoods; it is a structured starting point for conversations. If local officials and residents see anomalies—places where the map looks worse than the lived experience or where recent works should have shifted classifications—those outliers are invitations to inspect data provenance or annotate the next cycle with on-the-ground changes 27.
Finally, the Surabaya case offers a template for adaptation in Indonesia and across wider regions. Many cities share the same composite challenge of short-duration intense rainfall over increasingly impermeable surfaces, tertiary inlet maintenance that struggles to maintain pace with debris and encroachment, and community practices that are strong in intent but uneven in routine. The portability of this framework hinges on two design choices that travel well: an indicator set that privileges readily available layers, and survey modules that illuminate preparedness, adaptive capacity, and recovery without intruding on privacy or demanding extensive respondent time 17. The promise is not that a composite index will solve pluvial flooding, but that it will make the next municipal cycle smarter by centering on the question that matters most in practice: where low-cost, low-regret actions produce the largest and most reliable reductions in everyday disruption.
Building on the distinction between relative resilience prioritization and absolute engineering evaluation, it is useful to reflect more explicitly on the operational role of the priority-based classification adopted in this study. This classification translates the composite resilience index into Priority Classes A, B, and C, providing a simplified decision structure intended to support municipal implementation rather than a purely analytical comparison. Its primary usefulness lies in supporting evidence-based prioritization under real-world resource constraints, whereas its primary limitation is that it represents relative resilience conditions rather than absolute engineering performance or hydraulic safety.
The primary benefit of priority-based classification is its communicability across institutional actors. Urban resilience assessments frequently produce technically dense outputs that are difficult to interpret outside of specialist circles. The classification converts multidimensional indicators into categories that can be readily understood by planners, maintenance teams, and community leaders by organizing neighborhoods according to the combined exposure and capacity conditions. This simplification aligns with the study’s broader objective of developing a “city-ready” framework capable of guiding actions using routinely available data.
Further, this classification supports practical resource sequencing under constrained municipal budget conditions. Priority A neighborhoods, characterized by high exposure and low social capacity, signal locations where relatively modest interventions, such as coordinated inlet maintenance, localized blue–green retrofits, and strengthened risk communication, can generate disproportionate improvements in recovery performance. Rather than dispersing investments evenly across the city, the framework encourages targeted action in which exposure and limited preparedness jointly amplify disruptions. In this sense, prioritization functions as a strategic allocation mechanism, consistent with incremental and low-regret planning approaches discussed in this study.
Another advantage is institutional coordination. As the classification integrates both physical and social dimensions, it implicitly assigns complementary roles to different municipal units. Engineering departments may focus on restoring drainage performance in highly exposed zones, whereas community-facing agencies should reinforce preparedness and communication in areas with weaker adaptive capacity. Thus, the shared language of priority classes helps to synchronize actions that are often implemented separately, reinforcing the integrated governance logic emphasized in the framework design.
In addition, the classification establishes a practical baseline for iterative monitoring. As indicators can be updated using recurring spatial data and periodic community assessments, priority categories can be revisited across planning cycles. Movement between classes over time provides a simple yet meaningful signal of whether combined maintenance, preparedness, and micro-retrofit measures improve neighborhood resilience. This reinforces the concept of flood resilience as a learning process, rather than a one-time diagnostic outcome.
It is important to acknowledge that this classification simplifies complex and continuous resilience conditions into discrete categories. It should therefore be interpreted as a strategic prioritization tool rather than an absolute indicator of flood safety or infrastructure adequacy.
Despite these advantages, this study has several limitations. First, categorical classification inevitably reduces continuous variations into discrete groups. Neighborhoods located near classification thresholds may shift categories because of small indicator changes, despite underlying conditions remaining broadly similar. Although sensitivity testing indicates overall ranking stability, such boundary effects are inherent in decision-oriented classification systems and should be interpreted cautiously during policy application.
Second, the priority scheme reflects relative rather than absolute risk conditions. A lower-priority classification does not imply the absence of flood risk but indicates comparatively stronger resilience within the city context. Without careful communication, stakeholders may misinterpret these categories as definitive safety assessments rather than comparative planning signals. Thus, priority classes are best presented alongside underlying exposure and capacity indicators to preserve analytical transparency.
Third, the classification depends on the available data sources, including municipal reports and community-based observations. Spatial differences in reporting intensity or participation may influence exposure representation, while rapid survey indicators capture key aspects of preparedness and recovery but cannot fully represent evolving institutional or socioeconomic dynamics. These limitations are consistent with the pragmatic design choice to prioritize usability and repeatability over exhaustive data requirements, and priority-based classification does not replace detailed engineering analysis. Hydraulic simulations, drainage capacity assessments, and design-standard evaluations are essential for infrastructure planning. The framework should therefore be understood as a screening and sequencing tool that helps determine where deeper technical analysis and investment should be concentrated, complementing rather than substituting conventional engineering evaluations.
Considered together, these findings demonstrate that urban flood resilience is most actionable when exposure patterns and social capacity are interpreted as a coupled system, rather than as separate analytical domains. The priority-based framework presented here does not aim to predict flooding with engineering precision, but to guide where coordinated, feasible actions can most effectively reduce everyday disruption. This approach reframes resilience assessment as a practical decision-support process embedded within ongoing municipal operations by aligning spatial evidence with institutional routines and community practices. This perspective provides the foundation for concluding reflections on how cities can operationalize incremental yet cumulative resilience gains within realistic planning cycles.
5. Conclusions
This study develops a city-ready framework for Surabaya that treats urban flood resilience as the joint product of spatial exposure and social capacity, and turns that insight into a short, practical list of actions that fit municipal routines. By working at the Kelurahan scale and emphasizing clusters rather than points, the approach helps synchronize mundane but decisive tasks—cleaning inlets, managing debris around vendor stands, and staging preparedness refreshers—with small blue–green retrofits that intercept runoff where doing so is most effective. The composite index is intentionally simple, the data pipeline is reproducible, and the results are stable for reasonable changes in weights, making the framework usable within standard planning and budgeting cycles.
For Surabaya, the immediate path forward is to operationalize the three-way alignment among maintenance, micro-retrofits, and risk communication in the Priority A clusters identified in Section 3, then to extend this package to Priority B and C neighborhoods, where capacity improvements can unlock faster recovery. Over the medium term, the city can institutionalize a seasonal refresh of the indicators and create a light debrief process in which subdistricts compare results with their own observations, thereby embedding learning and ownership. For other Southeast Asian cities working under similar hydrometeorological and institutional conditions, the Surabaya implementation demonstrates how a composite lens can balance rigor with feasibility, supporting a transition from descriptive spatial assessment to repeatable resilience implementation, while larger capital-intensive infrastructure improvements are planned and executed. Importantly, the priority classification framework is not intended to replace absolute engineering-based flood hazard assessments such as hydraulic modeling or infrastructure capacity analysis. Instead, it serves as a decision-support tool that helps identify where detailed engineering evaluations and interventions should be prioritized. This distinction ensures that the framework complements conventional engineering analyses rather than substitutes for them. In this role, it enhances municipal decision-making by identifying priority areas where immediate, low-cost, and operationally feasible interventions can improve resilience.
Appendix A. Detailed Parameters for District Priority Classification
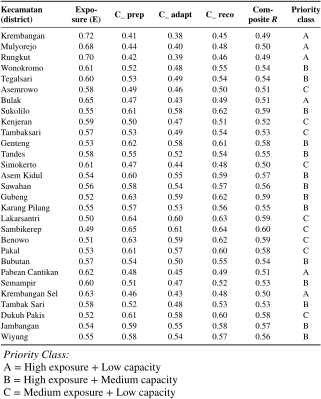
The Appendix provides the detailed data used to calculate the priority classes for each district. Table 1 presents a neighborhood summary of the parameters defined in Eq. \(\eqref{eq:1}\), including exposure, capacity components, and the resulting priority classification.
Table 1. Equation \(\eqref{eq:1}\): Neighborhood summary.
- [1] J. Boguniewicz-Zabłocka and E. Łukasiewicz, “Blue–green infrastructure effectiveness for urban stormwater management: A multi-scale residential case study,” Land, Vol.14, Issue 7, Article No.1340, 2025. https://doi.org/10.3390/land14071340
- [2] J. DeSapio, “Transformational learning: A literature review of recent criticism,” J. of Transformative Learning, Vol.4, No.2, pp. 56-63, 2018.
- [3] A. D. P. Mas, “Study on flood management plan in SUrabaya City,” J. Civ. Eng. Forum., Vol.1, No.2, 2017. https://doi.org/10.22146/jcef.23891
- [4] C. N. Yuanita and S. Sagala, “Blue-green infrastructure in Jakarta’s fringe: An analysis of accessibility to blue-green spaces as a flood solution in Bekasi City,” Int. J. Disaster Risk Reduct., Vol.121, Article No.105425, 2025. https://doi.org/10.1016/j.ijdrr.2025.105425
- [5] R. D’Ambrosio, V. Foresta, A. Longobardi, and S. Ferlisi, “Exploring the role of pedological and climatic aspects in the medium-term decline of green roofs hydrological performance: An experimental study in a Mediterranean environment,” Blue-Green Syst., Vol.6, No.2, pp. 293-309, 2024. https://doi.org/10.2166/bgs.2024.021
- [6] D. Bhandari, “Challenges and opportunities in Nepal’s early warning communication,” Int. J. Disaster Risk Reduct., Vol.119, Article No.105318, 2025. https://doi.org/10.1016/j.ijdrr.2025.105318
- [7] S. Soleh and M. Sofyan, “Social impact management assessment of urban flood is important-especially in Surabaya-Wonokromo and Surabaya-Brangkal,” Ilomata Int. J. Soc. Sci., Vol.1, No.2, pp. 69-76, 2020. https://doi.org/10.52728/ijss.v1i2.80
- [8] S. Ali and A. George, “Modelling a community resilience index for urban flood-prone areas of Kerala, India (CRIF),” Nat. Hazards, Vol.113, No.1, pp. 261-286, 2022. https://doi.org/10.1007/s11069-022-05299-7
- [9] K. Phommavong, J. Yan, S. A. Shah, and C. Chisenga, “Assessment of flood risk in Northern and Southern Laos using geospatial data,” Geomat., Nat. Hazards Risk, Vol.16, Issue 1, Article No.2537859, 2025. https://doi.org/10.1080/19475705.2025.2537859
- [10] S. Pramono, S. Roekminiati, and A. V. Vitianingsih, “Effectiveness of flood management through pump houses based on geographic information systems in the city of Surabaya,” Proc. of the Int. Conf. of Public Administration and Governance (ICOPAG 2022), pp. 349-368, 2023. https://doi.org/10.2991/978-2-38476-082-4_32
- [11] P. Dang, J. Zhu, C. Dang, and H. Zhang, “A method for assessing urban flood impacts by combining hydrodynamic models with entity semantic evolution,” Int. J. Digital Earth, Vol.18, Issue 1, Article No.2515268, 2025. https://doi.org/10.1080/17538947.2025.2515268
- [12] S. Arikunto, “Prosedur Penelitian Suatu Pendekatan Praktik,” Rineka Cipta, 2010 (in Indonesian).
- [13] N. Liu and F. Zhang, “Urban green spaces and flood disaster management: Toward sustainable urban design,” Frontiers Public Health, Vol.13, Article No.1583978, 2025. https://doi.org/10.3389/fpubh.2025.1583978
- [14] J. Cachay, J. Wennemer, E. Abele, and R. Tenberg, “Study on action-oriented learning with a learning factory approach,” Procedia - Soc. Behav. Sci., Vol.55, pp. 1144-1153, 2012. https://doi.org/10.1016/j.sbspro.2012.09.608
- [15] Y. Liao and G. Huang, “A hybrid predictive sequencing control for multi-chiller plant with considerations of indoor environment control, energy conservation and economical operation cost,” Sustain. Cities Soc., Vol.49, Article No.101616, 2019. https://doi.org/10.1016/j.scs.2019.101616
- [16] W. Zhang, C. Yan, Y. Xu, J. Fang, and Y. Pan, “A critical review of the performance evaluation and optimization of grid interactions between zero-energy buildings and power grids,” Sustain. Cities Soc., Vol.86, Article No.104123, 2022. https://doi.org/10.1016/j.scs.2022.104123
- [17] A. Rizaldi, S. Kure, B. A. Priyambodho, N. F. Januriyadi, and M. Farid, “Toward sustainable flood resilience: Assessing efficacy of paddy field Dams to reduce floods in Jakarta,” J. Flood Risk Manag., Vol.18, Issue 1, Article No.e70020, 2025. https://doi.org/10.1111/jfr3.70020
- [18] N. Nurwatik, J.-H. Hong, L. M. Jaelani, H. H. Handayani, A. B. Cahyono, and M. R. Darminto, “Using GIS to understand healthcare access variations in flood situation in Surabaya,” ISPRS Int. J. Geo-Information, Vol.11, Issue 4, Article No.235, 2022. https://doi.org/10.3390/ijgi11040235
- [19] S. C. Gibson, “‘Let’s go to the park.’ An investigation of older adults in Australia and their motivations for park visitation,” Landsc. Urban Plan., Vol.180, pp. 234-246, 2018. https://doi.org/10.1016/j.landurbplan.2018.08.019
- [20] J. Borenstein and A. Howard, “Emerging challenges in AI and the need for AI ethics education,” AI Ethics, Vol.1, No.1, pp. 61-65, 2021. https://doi.org/10.1007/s43681-020-00002-7
- [21] M. Zhong, K. Lin, G. Tang, Q. Zhang, Y. Hong, and X. Chen, “A framework to evaluate community resilience to urban floods: A case study in three communities,” Sustainability, Vol.12, Issue 4, Article No.1521, 2020. https://doi.org/10.3390/su12041521
- [22] M. Tayyab et al., “GIS-based urban flood resilience assessment using urban flood resilience model: A case study of Peshawar City, Khyber Pakhtunkhwa, Pakistan,” Remote Sens., Vol.13, Issue 10, Article No.1864, 2021. https://doi.org/10.3390/rs13101864
- [23] Z. Zhang, J. Zhang, Y. Zhang, Y. Chen, and J. Yan, “Urban flood resilience evaluation based on GIS and multi-source data: A case study of Changchun City,” Remote Sens., Vol.15, Issue 7, Article No.1872, 2023. https://doi.org/10.3390/rs15071872
- [24] F. Fakhriati et al., “Making peace with disaster: A study of earthquake disaster communication through manuscripts and oral traditions,” Prog. Disaster Sci., Vol.18, Article No.100287, 2023. https://doi.org/10.1016/j.pdisas.2023.100287
- [25] G. Olcese et al., “Developing a fluvial and pluvial stochastic flood model of Southeast Asia,” Water Resour. Res., Vol.60, Issue 6, Article No.e2023WR036580, 2024. https://doi.org/10.1029/2023WR036580
- [26] C. N. Yuanita and S. Sagala, “Blue-green infrastructure in Jakarta’s fringe: An analysis of accessibility to blue-green spaces as a flood solution in Bekasi City,” Int. J. Disaster Risk Reduct., Vol.121, Article No.105425, 2025. https://doi.org/10.1016/j.ijdrr.2025.105425
- [27] Y. R. Savitri, R. Kakimoto, R. A. Begum, N. Anwar, W. Wardoyo, and E. Suryani, “The application of AHP to determine the priority drainage system on flood mitigation in Surabaya – Indonesia,” J. Disaster Res., Vol.17, No.3, pp. 431-443, 2022. https://doi.org/10.20965/jdr.2022.p0431
This article is published under a Creative Commons Attribution-NoDerivatives 4.0 Internationa License.