Paper:
Social Impacts of Floods in the Pampanga River Basin: An Analysis from the Perspective of the SDGs
Zhaoxia Pang*1,†, Miho Ohara*1, Naoko Nagumo*2, Tomohiro Tanaka*3
 , and Patricia Ann Jaranilla-Sanchez*4
*1Interfaculty Initiative in Information Studies, The University of Tokyo
Be505, 4-6-1 Komaba, Meguro-ku, Tokyo 153-8505, Japan
†Corresponding author
*2International Centre for Water Hazard and Risk Management, Public Works Research Institute
Tokyo, Japan
*3Disaster Prevention Research Institute, Kyoto University
Kyoto, Japan
*4Interdisciplinary Studies Center for Water University of the Philippines Los Baños
Los Baños, Philippines

The Philippines is highly vulnerable to natural disasters, with recurrent flooding posing persistent threats to livelihoods and sustainable development. This study examines the socio-economic impacts of flooding in the Pampanga River Basin using an analytical framework based on the Sustainable Development Goals (SDGs). A household survey of 400 respondents was conducted in eight barangays of Candaba Municipality between June and July 2024. The analysis explores residents’ perceptions of flood risk, housing and farmland damage, and the socio-economic impacts of Typhoon Karding (September 2022). Results indicate substantial household burdens, including increased expenses and debt, as well as significant effects on quality of life and the water–food–energy nexus. These impacts operate as cascading effects across interconnected SDG-related domains rather than as isolated outcomes. Statistical analyses (correlation and one-way ANOVA) show that prolonged inundation (more than five days) significantly increases food shortages, livestock deterioration, debt accumulation, and difficulties in accessing education and healthcare. Inundation exceeding this duration thus emerges as a critical threshold amplifying multidimensional vulnerability. The findings demonstrate that disaster impacts extend beyond physical damage, undermining livelihoods and social functions. By applying the SDGs as an analytical lens, this study provides empirical evidence of how flood impacts propagate across sustainability-related domains at the household level. Policy implications highlight the need to integrate disaster risk reduction with livelihood recovery and to promote inclusive, community-based approaches to resilience.
1. Introduction
In 2015, two landmark international frameworks were adopted by the United Nations. The first was the Sendai Framework for Disaster Risk Reduction 2015–2030, endorsed at the Third United Nations World Conference on Disaster Risk Reduction in Sendai, Japan. Building on the 2005 Hyogo Framework for Action, the Sendai Framework provides global guidelines for disaster risk reduction (DRR) policies. It emphasizes principles such as Build Back Better, the leadership roles of women and youth, the participation of diverse stakeholders, evidence-based policymaking, education and public awareness, and the strengthening of international cooperation.
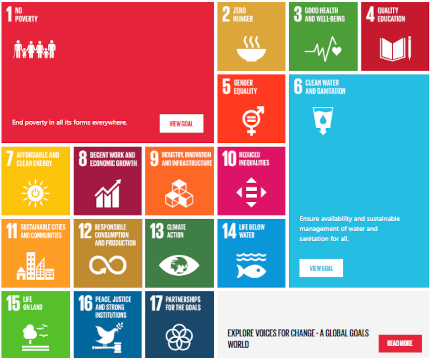
Fig. 1. The 17 SDGs.
The second was the 2030 Agenda for Sustainable Development (hereafter, the “2030 Agenda”), adopted at the United Nations General Assembly in September 2015. At its core are the Sustainable Development Goals (SDGs), which comprise 17 goals (Fig. 1) and 169 targets to be achieved by 2030 1. The SDGs represent a universal set of objectives aimed at realizing a sustainable society in which ‘no one is left behind.’ Among them, Goal 11 (Sustainable Cities and Communities) and Goal 13 (Climate Action) are closely aligned with disaster risk reduction initiatives promoted under the Sendai Framework. Moreover, the 2030 Agenda explicitly incorporates the outcomes of the Sendai Framework, thereby positioning DRR as a concrete means of achieving the SDGs 2. While the SDGs were originally formulated as a policy framework, this study operationalizes them as an analytical lens, acknowledging their normative origins while emphasizing their utility in structuring multi-dimensional impact analysis.
Koike 3 further classified the relationship between disasters and the SDGs into five domains: Built Environment, Environmental Impacts, Quality of Life, Water–Food–Energy (WFE) nexus, and Social Systems, and proposed a conceptual model to illustrate these interconnections (Fig. 2). According to this model, disasters initially affect the built environment and environmental conditions, which subsequently generate cascading impacts on quality of life and the WFE nexus and may ultimately extend to broader social systems.
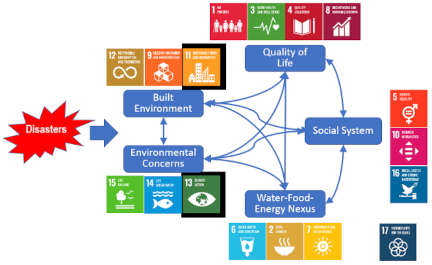
Fig. 2. Relationship between the SDGs and Disasters 3.
A growing body of research has examined the socio-economic impacts of flooding in disaster-prone regions of the Global South 4,5,6. Previous studies have shown that recurrent floods exacerbate poverty, disrupt agricultural livelihoods, increase household debt, and constrain access to essential services such as education and healthcare 7,8. While these studies highlight the multidimensional nature of flood impacts, many focus on specific sectors and do not systematically integrate these effects within a unified analytical framework.
Since the adoption of the Sendai Framework and the 2030 Agenda, scholars have increasingly emphasized the need to link DRR with sustainable development. However, in much of the existing literature, the SDGs are treated primarily as normative policy goals rather than as operational analytical tools 9,10. Although recent studies have begun to operationalize SDG interlinkages and interactions 11,12, empirical applications at the household level remain relatively limited, particularly in rural flood-prone contexts based on primary household survey data.
In addition, although the WFE nexus framework has been widely discussed as a means of understanding interdependencies among critical resource systems under climate stress 13,14, fewer studies have examined how flood-induced disruptions of water, food, and livelihood systems interact at the household level in rural agricultural settings 15. Furthermore, recent research has highlighted the importance of cascading disaster impacts across interconnected socio-economic systems 16,17, yet empirical evidence linking these cascading mechanisms to SDG-related domains remains insufficiently explored.
Against this backdrop, there remains a need for empirical research that examines how flood impacts propagate across interconnected sustainability domains at the household level in highly vulnerable rural contexts.
Building on these strands of research, this study positions itself within the broader literature on disaster impacts, sustainable development, and nexus-based resource analysis. While previous studies have addressed related aspects of WFE nexus vulnerability, SDG interlinkages, and cascading disaster impacts, they have often examined these dimensions separately or at aggregated scales. This study extends these approaches by integrating them within a unified analytical framework and by applying them to household-level survey data in a flood-prone rural context.
In this sense, rather than claiming a wholly novel approach, this study provides an additional empirical perspective by operationalizing the SDGs as a structured analytical lens and examining how flood-induced disruptions interact across SDG-related domains at the household level.
In doing so, it contributes to ongoing discussions on the integration of disaster risk reduction and sustainable development by offering evidence from a flood-prone agricultural community in the Philippines.
The Republic of the Philippines is widely recognized as one of the countries most exposed to disaster risk. According to the World Risk Report 2024, the Philippines ranked first globally in the World Risk Index 18. This reflects the country’s geographical exposure to frequent typhoons, compounded by limited disaster response capacity and high levels of social vulnerability.
This study focuses on Candaba Municipality, located in the Pampanga River Basin in Central Luzon, an area well known for recurrent flooding (Fig. 3). Table 1 summarizes major damages caused by typhoons affecting Pampanga Province over the past five years (2019–2024). Significant flood events include Quinta and Rolly (2020), Ulysses (2021), Karding and Paeng (2022), and Egay (2023), each of which caused inundation exceeding usual seasonal levels.
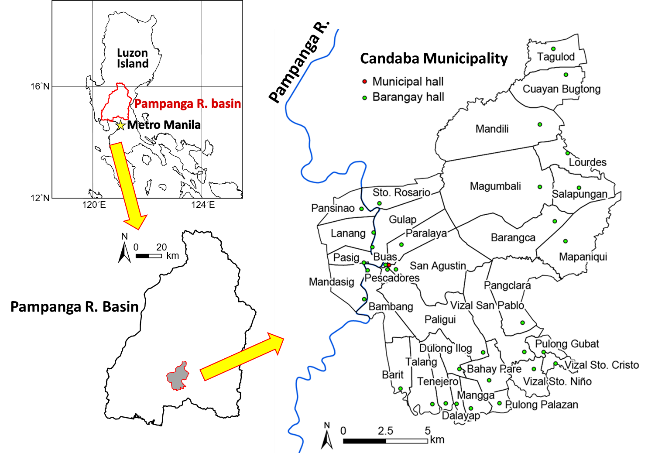
Fig. 3. Location of the Pampanga River basin and Candaba Municipal.
Table 1. Damage caused by typhoons in Pampanga Province over the past five years (2019–2024).

Typhoon Karding (September 2022) was selected as the focal event because its occurrence approximately two years prior to the field survey conducted in June–July 2024 provided an appropriate temporal interval for examining medium-term socio-economic impacts beyond the immediate emergency phase. Earlier events such as Typhoon Ulysses occurred several years before the survey, increasing the risk of recall bias and conflation of multiple flood experiences. Moreover, in the Candaba floodplain, Typhoon Karding caused prolonged inundation and substantial disruptions to agriculture, household economies, and daily life, generating impacts closely aligned with the SDG-related dimensions analyzed in this study. These characteristics make Typhoon Karding an appropriate case for examining the community-level socio-economic consequences of flooding.
Therefore, based on these considerations, this study draws on face-to-face interview survey data collected in Candaba between June and July 2024 and addresses the following research questions:
-
RQ1:
How did Typhoon Karding affect built and natural environments across different flood-exposure zones?
-
RQ2:
How did these impacts propagate across SDG-related domains at the household level?
-
RQ3:
Does prolonged inundation function as a threshold that amplifies cascading socio-economic impacts?
By operationalizing the SDGs as an analytical framework and empirically evaluating the cascading structure proposed by Koike 3, this study contributes to the literature on disaster risk reduction and sustainable development. Through evidence from a flood-prone agricultural municipality in the Philippines, it clarifies how disaster impacts intersect with multiple SDG-related dimensions at the household level and provides insights for integrating DRR with sustainability planning in highly vulnerable contexts.
2. Research Objectives and Methods
Figure 3 shows the location of the Pampanga River Basin and Candaba Municipality, which served as the survey site for this study. Candaba, situated in the lower basin of the Pampanga River in Central Luzon, is widely recognized as a flood-prone municipality. The Pampanga River, with a catchment area of approximately 10,500 km\(^2\), flows southward along Candaba’s western boundary. To the east lies the Candaba Wetlands, a vast floodplain functioning as a natural flood retention basin that receives floodwater from surrounding areas 21.
During periods of high-water levels in the Pampanga River, the Cabiao Floodway diverts excess water into Candaba. While this system attenuates flooding, the municipality faces increasing flood risks due to population growth and climate change. As a result, Candaba experiences inundation damage almost every rainy season, and projections indicate that climate change will further increase both the frequency and severity of floods. Given these characteristics, Candaba represents a suitable case for examining how recurrent flooding affects household-level socio-economic conditions in a rural floodplain setting.
This study aims to empirically examine the cascading socio-economic impacts of flooding at the household level, consistent with the analytical framework presented in the Introduction.
For the selection of survey areas, the classification of barangays (the smallest administrative unit) proposed by Nagumo et al. 22 was adopted. Barangays were grouped into four categories based on micro-topography, records of past inundation, and interviews with residents (Figs. 4–6).
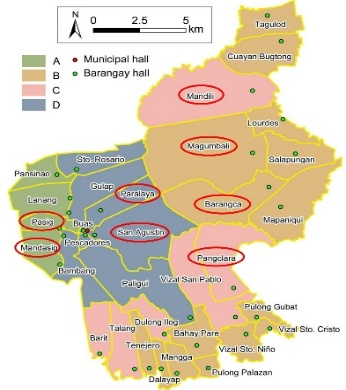
Fig. 4. Selected barangays (highlighted in red).
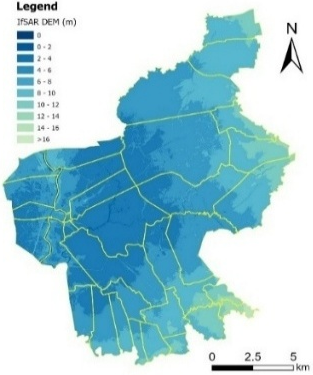
Fig. 5. Elevation of the survey area.
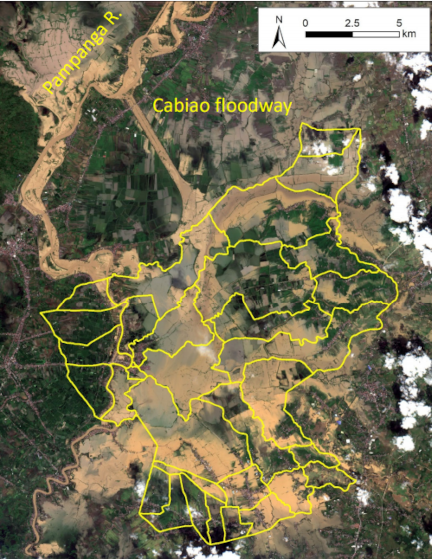
Fig. 6. Satellite image of the survey area (Sentinel-2, captured on November 13, 2020).
-
Group A:
Areas with little to no inundation, even during the rainy season.
-
Group B:
Areas inundated during severe typhoons or other extreme flood events.
-
Group C:
Areas experiencing intermittent inundation during flood events.
-
Group D:
Areas chronically inundated, even during the normal rainy season.
Two barangays were selected from each group, resulting in a total of eight survey sites. This exposure-gradient sampling design was adopted to enable comparative analysis across different flood-risk conditions rather than to achieve strict proportional representativeness of the municipality.
Table 2. Valid responses by barangay.

From these barangays, 400 households were randomly sampled for face-to-face interviews with household heads or equivalent representatives. Within each selected barangay, households were randomly chosen based on available household listings and systematic field verification. The structured questionnaire (approximately 40 items) covered basic household characteristics, disaster risk perception, past flood experiences, damage to housing and farmland, countermeasures for future floods, and long-term outlooks.
It should be noted that sampling fractions differed among barangays due to variations in population size and field accessibility. No weighting adjustment was applied, as the primary objective was to compare patterns of socio-economic impacts across exposure categories rather than to estimate municipality-wide population parameters.
Given that the Kapampangan language is more widely spoken than Tagalog in the study area, the questionnaire was prepared in Tagalog and simultaneously translated into Kapampangan by trained enumerators. In addition, photographs of each house were taken to document housing type and floor elevation, and GPS coordinates (latitude and longitude) were recorded. The survey was conducted over a 10-day period, from June 24 to July 2, 2024. Table 2 summarizes the valid responses obtained from each barangay.
3. Results: Inundation Conditions (2019–2024)
This section presents descriptive results on recent inundation patterns in the study area to establish the spatial variation in flood exposure that underpins the subsequent analysis of cascading socio-economic impacts. Drawing on the interview survey, the analysis focuses on flooding events that occurred during the past five years (2019–2024), with particular emphasis on damages to housing and farmland caused by Typhoon Karding in September 2022.
3.1. Perceptions of Flooding
Residents were asked about their perceptions of flood risk (Fig. 7(a)) and flood risk under climate change (Fig. 7(b)). For analytical clarity, responses of “very worried” and “worried” were consolidated into the category concerned, while “not worried at all” and “not worried” were combined into unconcerned. The remaining responses were categorized as neutral.
The results indicate that in most barangays, except Mandasig and Pasig, more than 90% of respondents expressed concern about flood risks. With respect to anticipated risk increases under climate change, Mandasig exhibited a relatively high proportion of neutral responses (approximately 20%), suggesting localized variation in risk perception. These differences may reflect variations in historical flood exposure and experience, as documented in the following sections.
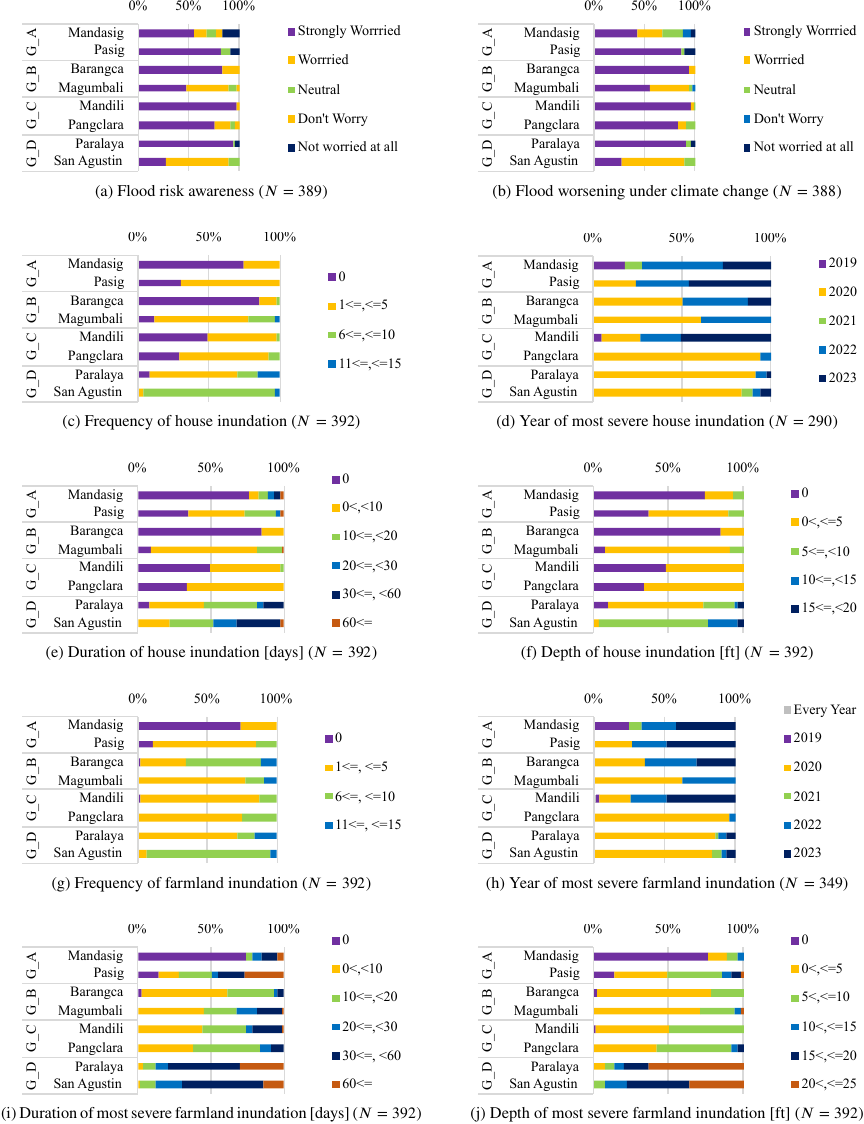
Fig. 7. Summary of flood risk perception and inundation characteristics across study locations.
3.2. Inundation Conditions of Houses over the Past Five Years
This section examines household experiences of inundation during the past five years, focusing on frequency, the most severe year, duration, and depth.
With respect to inundation frequency (Fig. 7(c)), all respondents in San Agustin reported having experienced flooding, with nearly 90% indicating 6–10 times. By contrast, about 80% of respondents in Barangca reported 0 occurrences, suggesting relatively low flood risk in this area. In Pasig, Magumbali, Pangclara, and Paralaya, most households reported 1–5 occurrences of inundation.
Regarding the most severe year of inundation (Fig. 7(d)), more than 80% of respondents in Pangclara, Paralaya, and San Agustin identified 2020 as the worst year. In contrast, 2022 was most frequently cited in Mandasig, while 2023 was reported by most respondents in Pasig and Mandili.
In terms of duration (Fig. 7(e)), San Agustin was particularly affected, with approximately 80% of households reporting inundation lasting 10 days or more. By comparison, over 70% of respondents in Mandasig and Barangca reported no inundation. In Magumbali and Pangclara, most households experienced inundation lasting 0–10 days.
Marked regional differences in inundation depth were observed (Fig. 7(f)). In San Agustin, all respondents reported experiencing flooding, and more than 90% indicated depths exceeding 5 ft (\(1~\mathrm{ft} \approx 0.3~\mathrm{m}\)). By contrast, over 70% of respondents in Mandasig and Barangca reported no inundation experience. In Magumbali and Paralaya, about 70% of households reported inundation depths of 0–5 ft.
Taken together, these findings reveal pronounced spatial heterogeneity in flood exposure across barangays, with San Agustin emerging as the most severely affected area in terms of frequency, duration, and depth. These differences form the basis for examining whether higher physical exposure corresponds to stronger socio-economic impacts in later sections.
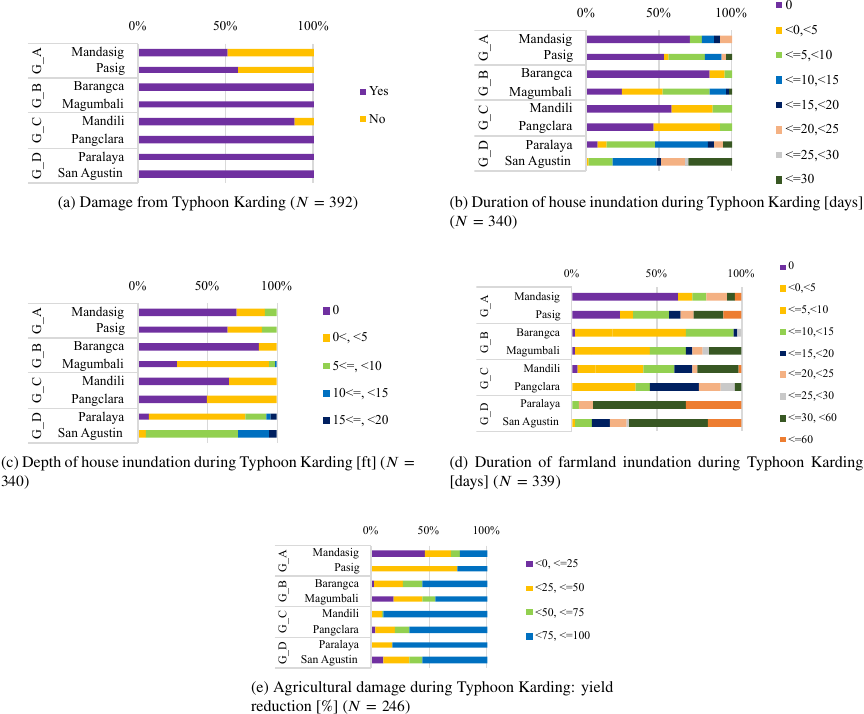
Fig. 8. Household- and farmland-level impacts of Typhoon Karding across sampled barangays.
3.3. Inundation Conditions of Farmland over the Past Five Years
When the same framework was applied to farmland inundation, clear disparities were also observed.
In terms of frequency (Fig. 7(g)), more than 90% of respondents in San Agustin reported 6–10 inundation events. In contrast, about 70% of respondents in Mandasig reported no farmland inundation.
Regarding the most severe year of inundation (Fig. 7(h)), over 80% of respondents in Pangclara, Paralaya, and San Agustin identified 2020 as the most damaging year. In contrast, 2023 was most frequently cited in Mandasig, Pasig, and Mandili, suggesting that recent flood events have disproportionately affected these areas.
In terms of duration (Fig. 7(i)), Paralaya and San Agustin were the most severely affected cases. Almost all respondents in both areas reported inundation lasting 10 days or more, with nearly 90% indicating 20 days or longer. These results highlight the severe and prolonged impacts of flooding on agricultural production in these barangays. By contrast, about 70% of respondents in Mandasig reported no inundation, reflecting minimal agricultural disruption.
Marked differences were also observed in inundation depth (Fig. 7(j)). In Paralaya and San Agustin, approximately 90% of respondents reported depths exceeding 10 ft, and more than 60% of respondents in Paralaya indicated 20–25 ft. Such extreme flooding conditions suggest catastrophic impacts on farmland. By comparison, about 80% of respondents in Mandasig reported 0 ft, underscoring the relative safety of agriculture in this area.
These results indicate that agricultural vulnerability is strongly spatially differentiated, with chronic and prolonged flooding concentrated in specific barangays. Such exposure patterns are expected to significantly influence livelihood stability and household economic resilience.
3.4. Inundation Conditions of Houses During Typhoon Karding
Typhoon Karding (September 2022) caused significant impacts on housing in the study area.
Respondents were first asked whether their households were affected (Fig. 8(a)). Of 392 valid responses, 340 (approximately 87%) reported being affected. In Barangca, Magumbali, Pangclara, Paralaya, and San Agustin, all respondents indicated that they were affected, while in Mandili the proportion was around 90%. In contrast, only about half of the respondents in Mandasig and Pasig reported being affected.
For the 340 affected households, further questions were asked regarding inundation inside their houses (Figs. 8(b) and 8(c)). In San Agustin, all respondents reported inundation, with over 80% experiencing flooding for 10 days or more, and about 30% indicating durations of 30 days. With respect to depth, approximately 90% reported inundation exceeding 5 ft, underscoring the severity of housing damage in this barangay.
By contrast, in Mandasig and Barangca, more than 70% of respondents reported no inundation. In Magumbali and Paralaya, about 70% experienced inundation depths of 0–5 ft, suggesting moderate yet significant damage.
These patterns confirm that Typhoon Karding reinforced pre-existing spatial disparities in housing exposure.
3.5. Inundation Conditions of Farmland During Typhoon Karding
The impacts of Typhoon Karding on farmland were analyzed in terms of inundation duration and agricultural damage, measured as yield reduction.
With respect to duration (Fig. 8(d)), more than 60% of respondents in Paralaya and San Agustin reported farmland inundation lasting 30 days or more. Such prolonged flooding led to near-total crop losses, underscoring the vulnerability of agricultural production in these areas.
In terms of agricultural damage (Fig. 8(e)), households that had not planted crops during the rainy season were excluded. In Mandili and Paralaya, over 60% of respondents reported yield reductions of 75% or more. Similarly, in Barangca, Mandili, Pangclara, and Paralaya, about 80% reported reductions of 50% or more. By contrast, in Mandasig, more than 40% of households reported losses of 25% or less, indicating relatively minor damage.
Overall, Typhoon Karding inflicted severe agricultural damage in Paralaya and San Agustin, while Mandasig experienced comparatively limited impacts. These findings underscore the unequal distribution of agricultural vulnerability across flood-exposure zones and provide a foundation for examining cascading socio-economic consequences in the subsequent sections.
Mandasig experienced comparatively limited impacts. These findings underscore the unequal distribution of agricultural vulnerability across flood-exposure zones and provide a foundation for examining cascading socio-economic consequences in the subsequent sections.
4. Socio-Economic Impacts of Typhoon Karding
This section analyzes the socio-economic impacts of Typhoon Karding based on interview survey data from 340 affected respondents. In line with Koike’s framework 3, the analysis focuses on whether physical flood exposure translated into cascading effects across SDG-related domains. The analysis is structured around two SDG-related dimensions: Quality of Life and the WFE nexus.
4.1. Impacts on “Quality of Life”
To assess the impacts on Quality of Life, multiple aspects were examined, including education, health, income, and household expenditures. These indicators were selected to capture disruptions in everyday social and economic functioning beyond direct physical damage.
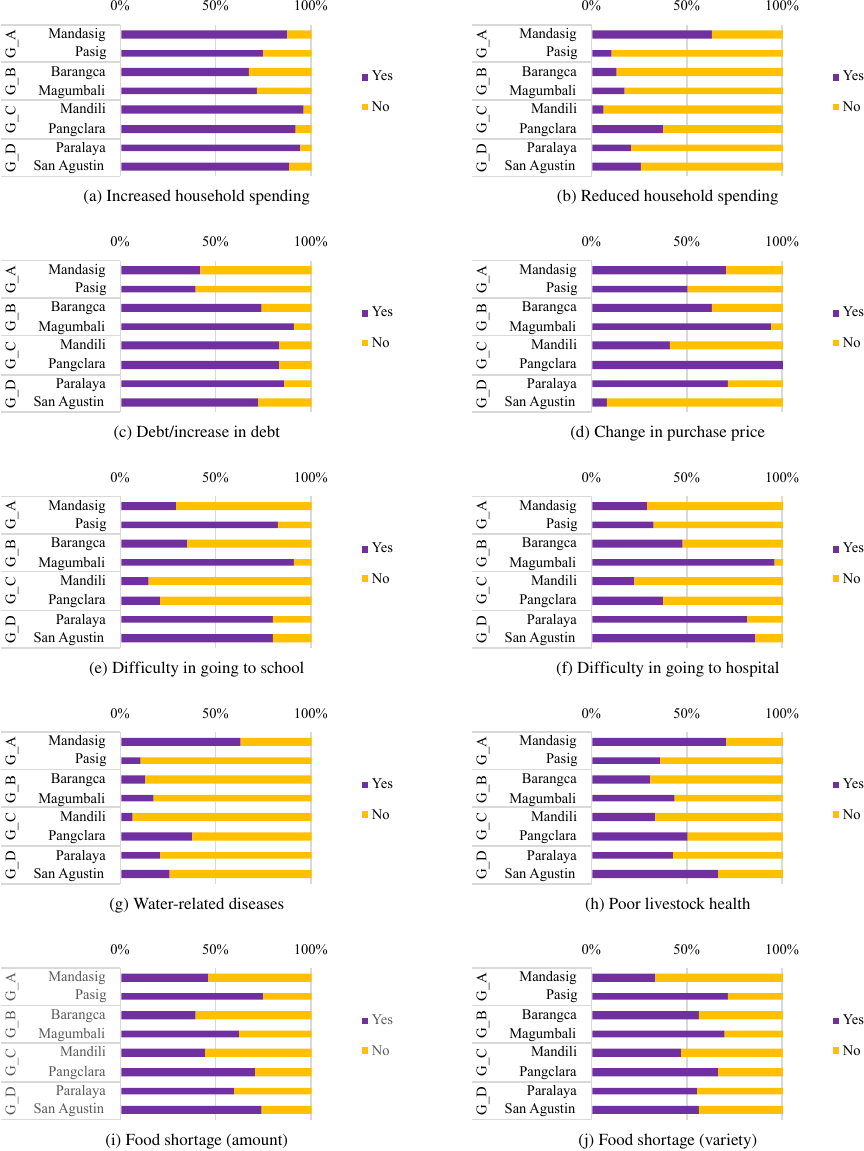
Fig. 9. Socio-economic and health impacts of Typhoon Karding at the household level across barangays.
With respect to household expenditures (Fig. 9(a)), more than 60% of respondents across all barangays reported increases, with proportions reaching approximately 90% in Mandasig, Mandili, Pangclara, Paralaya, and San Agustin. By contrast, declines in household income (Fig. 9(b)) were most pronounced in Magumbali and Paralaya, where the loss of income sources and stagnation of local economic activity had severe economic effects. In Barangca and San Agustin, fewer respondents reported decreased income, suggesting that some economic activity continued despite the disaster.
Regarding debt levels (Fig. 9(c)), about 70% of respondents in barangays classified as Groups B, C, and D (areas with higher inundation risk) reported an increase in borrowing, indicating that debt was widely used as a coping mechanism to offset disaster-related financial burdens. In contrast, in Group A barangays, around 60% reported no increase in debt.
For fluctuations in crop purchase prices (Fig. 9(d)), all respondents in Pangclara and over 90% in Magumbali reported being affected. In San Agustin, however, only about 10% reported price fluctuations, implying relatively low dependence on external markets in this barangay.
With respect to education and healthcare access, high proportions of respondents in Magumbali, Paralaya, and San Agustin reported difficulties in attending school (Fig. 9(e)) and accessing medical services (Fig. 9(f)), suggesting that interruptions in basic infrastructure severely hindered social functioning. In Pasig, about 80% of respondents reported difficulty accessing medical services, raising concerns over increased health risks due to disrupted healthcare delivery.
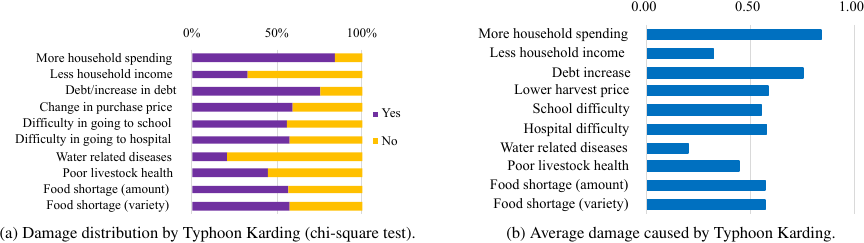
Fig. 10. Statistical summary of damage patterns associated with Typhoon Karding.
In terms of health-related impacts, approximately 60% of respondents in Mandasig reported heightened perceived risks of water-related diseases (Fig. 9(g)). In addition, livestock health was adversely affected: more than 60% of respondents in both Mandasig and San Agustin reported poor livestock health, underscoring the broader impacts of the disaster on agricultural livelihoods (Fig. 9(h)).
Overall, the results demonstrate that flood exposure extended beyond immediate housing damage to influence household finances, service accessibility, and livelihood stability, consistent with the cascading structure proposed in the conceptual framework.
4.2. Impacts on the Water-Food-Energy Nexus
The WFE nexus represents a critical aspect influencing livelihood sustainability during disasters. This section focuses on food security, analyzing food shortages in quantity (Fig. 9(i)) and food shortages in variety (Fig. 9(j)).
The results reveal significant spatial disparities. In Pasig, approximately 70% of respondents reported experiencing food shortages, indicating that food procurement was a serious challenge in this barangay. By contrast, in Mandasig and Mandili, fewer than half of the respondents reported food shortages, suggesting relatively stable food availability. In Barangca and San Agustin, food procurement was generally possible. However, imbalances in both the amount and variety of available food were reported.
These findings suggest that flood impacts propagate from physical and agricultural damage to resource security conditions, though the degree of impact varied by local exposure and coping capacity.
Taken together, Sections 4.1 and 4.2 provide descriptive evidence that socio-economic disruptions were differentiated and potentially linked to variations in flood duration and depth. The following section applies statistical analysis to evaluate whether these patterns are systematically associated with inundation intensity.
5. Correlations and Group Differences
To explore the interrelationships among the identified socio-economic impacts, this section combines descriptive statistics, chi-square tests, correlation analysis, and one-way ANOVAs. Statistical analyses were conducted to test whether the observed socio-economic disruptions were systematically associated with flood exposure intensity and whether they exhibited interdependent patterns consistent with the cascading structure proposed in Section 1.
5.1. Distribution of Binary Items
The binary (Yes/No) variables were analyzed (Fig. 10(a)). Chi-square tests were conducted to examine whether the proportion of households experiencing each impact differed significantly across inundation duration categories. The null hypothesis was that socio-economic impacts were independent of flood duration.
Chi-square tests revealed significant differences in eight items, excluding difficulty in attending school and poor livestock health. Items showing significantly higher “Yes” responses included increased household expenditures (\(\chi^{2} = 158.306\), \(p < .01\)), increased debt (\(\chi^{2} = 87.012\), \(p < .01\)), fluctuations in crop purchase prices (\(\chi^{2} = 10.588\), \(p < .01\)), difficulty in accessing medical services (\(\chi^{2} = 7.953\), \(p < .01\)), food shortages (amount) (\(\chi^{2} = 7.353\), \(p < .01\)), and food shortages (variety) (\(\chi^{2} = 6.224\), \(p < .05\)). Conversely, items with significantly higher “No” responses were decreased household income (\(\chi^{2} = 40.953\), \(p < .01\)) and water-related diseases (\(\chi^{2} = 120.012\), \(p <.01\)).
Subsequently, the responses were transformed into binary dummy variables, coding “Yes” as 1 and “No” as 0, and the mean value for each item was calculated (Fig. 10(b)). The results showed that increased household expenditures and increased debt had the highest mean values (approximately 0.8), indicating that financial burdens were concentrated among most households after the disaster. Water-related diseases showed the lowest mean (approximately 0.2). Other items, including fluctuations in crop purchase prices, difficulty in attending school, difficulty in accessing medical services, and food shortages (amount and variety), had intermediate mean values of around 0.6.
These results suggest that financial stress and resource-related disruptions were among the most prevalent impacts following Typhoon Karding, forming the core of household-level vulnerability.
5.2. Bivariate Correlations
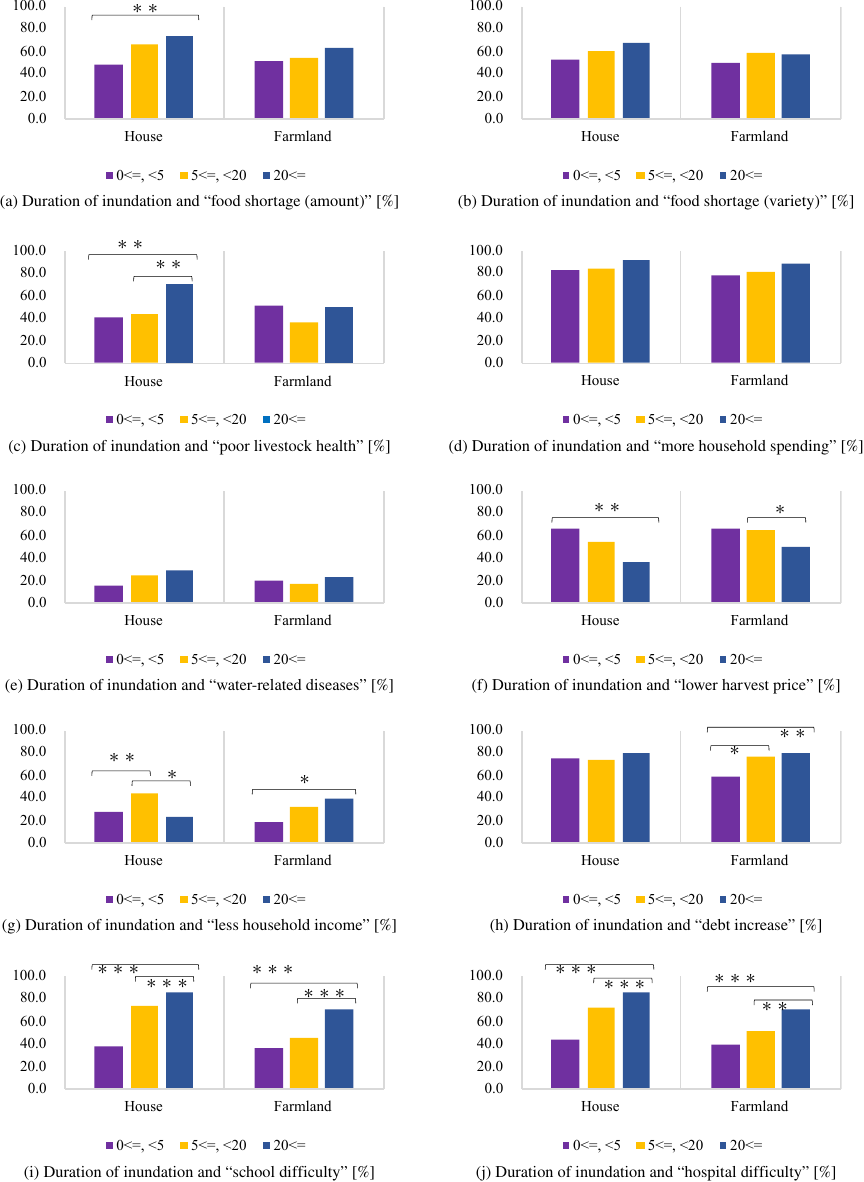
Fig. 11. Association between inundation duration and socio-economic and health impacts across households and farmland.
Correlation analysis was conducted to examine interrelationships among socio-economic impacts. This analysis aimed to test whether disruptions occurred independently or were mutually reinforcing.
Strong positive associations were found between difficulty in attending school and difficulty in accessing medical services (\(r = .720\), \(p < .01\)), and between food shortages (amount) and food shortages (variety) (\(r = .709\), \(p < .01\)). A moderate positive correlation was also observed between decreased household income and fluctuations in crop purchase prices (\(r = .587\), \(p < .1)\).
These relationships indicate that flood-induced infrastructure disruptions simultaneously constrained access to multiple social services, while market instability directly influenced household income. In other words, impacts did not occur in isolation but interacted across SDG-related domains.
The presence of such interdependencies provides empirical support for the cascading mechanism proposed in the conceptual framework.
5.3. One-Way ANOVA Results
To clarify how inundation duration influenced daily life, residential and agricultural inundation durations were categorized into three groups: “less than 5 days,” “5–20 days,” and “20 days or longer.” Each socio-economic indicator was treated as a dependent variable, with inundation duration as the independent variable.
Although inundation depth is an important indicator of flood severity, duration was selected as the primary explanatory variable because prolonged flooding directly affects livelihood continuity, agricultural cycles, and recovery capacity.
A one-way analysis of variance (ANOVA) was conducted, followed by multiple comparison tests to identify specific differences among groups. Statistically significant differences are indicated as \(^{*}p<.05\), \(^{**}p<.01\), and \(^{***}p<.001\). The results revealed several significant relationships.
First, regarding food shortage (amount) (\(F (2, 337) = 5.025\), \(p > .01\)) (Fig. 11(a)), households with inundation lasting for 5 days or longer (“5–20 days” and “20 days or longer”) experienced significantly stronger food shortages than those with less than 5 days.
In terms of poor livestock health (\(F (2, 337) = 5.892\), \(p < .01\)) (Fig. 11(c)), households with inundations lasting 20 days or longer showed significantly greater livestock deterioration.
For lower harvest price (\(F (2, 337) = 5.892\), \(p < .01\)) (Fig. 11(f)), households whose homes were inundated for 20 days or longer reported greater declines in crop prices than those with shorter durations.
Regarding decreased household income (\(F (2, 337) = 5.927\), \(p < .01\)) (Fig. 11(g)), for residential inundation, the 5–20 days group showed the most pronounced decline. For farmland, the “20 days or longer” group experienced significantly greater losses.
Concerning increased debt (\(F (2, 337) = 5.455\), \(p < .01\)) (Fig. 11(h)), prolonged farmland inundation (20 days or longer) resulted in significantly higher borrowing levels.
Finally, regarding the difficulty in attending school (\(F (2, 337) = 30.062\), \(p > .001\)) (Fig. 11(i)) and difficulty in accessing hospitals (\(F (2, 337) = 19.016\), \(p > .001\)) (Fig. 11(j)), both residential and farmland inundations lasting 20 days or longer caused severe disruptions to education and healthcare access.
These findings indicate a threshold effect: inundation exceeding five days significantly affects food security and livestock management, while inundation lasting 20 days or longer generates severe socio-economic consequences, including income loss, market instability, increased debt, and disruption of education and healthcare access.
Thus, prolonged inundation functions as a critical amplifier of cascading impacts across SDG-related domains.
Therefore, ensuring alternative educational and medical service provision in flood-prone areas should be a policy priority for future DRR planning.
Overall, the statistically significant associations demonstrate that flood impacts propagated across interconnected socio-economic domains rather than occurring independently, thereby providing empirical support for the cascading structure proposed by Koike 3.
6. Conclusion
This study aimed to clarify the socio-economic impacts and living conditions associated with flood disasters in flood-prone areas using the SDGs as an analytical framework. The analysis was based on an interview survey conducted in Candaba Municipality, Pampanga Province, the Philippines.
The findings revealed substantial inter-barangay differences in inundation frequency, duration, and severity. San Agustin and Paralaya emerged as highly vulnerable areas, where recurrent and prolonged flooding affected both housing and farmland. These spatial disparities in physical exposure formed the foundation for differentiated socio-economic consequences across communities.
The analysis of Typhoon Karding demonstrated that flood impacts extended far beyond immediate physical damage. Households experienced increased expenditures, debt accumulation, income instability, and disruptions in education and healthcare access. Impacts were also observed within the WFE nexus, including food shortages and livestock deterioration. The statistical results confirmed that these effects were not isolated but operated through mutually reinforcing pathways, consistent with the cascading structure proposed in Koike’s framework 3.
Correlation analysis revealed strong interdependencies between education and healthcare disruptions and between quantitative and qualitative food shortages. Furthermore, one-way ANOVA results identified a threshold effect: inundation exceeding five days significantly intensified food insecurity and livelihood stress, while inundation lasting 20 days or longer generated severe multi-dimensional vulnerability, including income loss, increased debt, and social service disruption. These findings highlight the critical role of inundation duration in amplifying cascading socio-economic impacts.
Overall, this study demonstrates that prolonged flooding functions as a structural amplifier of vulnerability across SDG-related domains. By operationalizing the SDGs as an analytical framework rather than a normative policy reference, this research provides empirical evidence linking disaster exposure to interconnected sustainability dimensions at the household level in a rural agricultural setting. In doing so, it contributes to bridging disaster risk reduction research, SDG analysis, and nexus-based sustainability perspectives.
Looking ahead, mitigating these impacts and enhancing regional sustainability will require integrated efforts among government agencies, residents, and international partners. Policy priorities should include strengthening alternative service delivery systems during prolonged flooding, enhancing livelihood diversification, improving local market resilience, and expanding social protection mechanisms to prevent debt-driven recovery traps. Tailored, community-based strategies combining risk communication, livelihood support, and social safety nets are essential for addressing long-term recovery challenges.
Finally, several limitations should be acknowledged. The survey was limited to Candaba Municipality and therefore does not fully represent the entire Pampanga River Basin. Barangay selection was based on micro-topography and historical inundation patterns; however, individual responses did not always align with these classifications. Future research should integrate geospatial analysis using precise location data and incorporate socio-demographic cross-tabulation to better capture differentiated vulnerability patterns. Longitudinal studies examining recovery trajectories over multiple disaster cycles would further strengthen understanding of how cascading impacts evolve over time.
Acknowledgments
The authors gratefully acknowledge the valuable support of Mr. Jomar Y. Guevarra of the Agricultural Office of Candaba Municipality. The field survey was made possible through the collaboration of project members from the University of the Philippines Los Baños, particularly Ms. Catherine Gigantone, and the kind coordination of Ms. Atsuko Himeno. The authors also extend their sincere appreciation to the residents of Candaba Municipality for their generous cooperation and valuable participation in the interviews.
- [1] United Nations, “The Sustainable Development Goals.” https://globalgoals.org/goals/ [Accessed August 15, 2025]
- [2] United Nations Office for Disaster Risk Reduction (UNDRR), “Disaster risk reduction and resilience in the 2030 Agenda for sustainable development,” 2015. https://www.preventionweb.net/publication/disaster-risk-reduction-and-resilience-2030-agenda-sustainable-development [Accessed July 15, 2025]
- [3] T. Koike, “Discussion on Inputs into the Statement of 14th AOGEO Symposium,” Presentation at the Asian Water Cycle Initiative (AWCI) Session, Asia-Oceania Group on Earth Observations (AOGEO), 2021. https://www.pwri.go.jp/icharm/special_topic/20211029_aogeo_awci/6-1_Koike.pdf [Accessed July 15, 2025]
- [4] H. C. Winsemius, B. Jongman, T. I. E. Veldkamp, S. Hallegatte, M. Bangalore, and P. J. Ward, “Disaster risk, climate change, and poverty: Assessing the global exposure of poor people to floods and droughts,” Environment and Development Economics, Vol.23, No.3, pp. 328-348, 2018. https://doi.org/10.1017/S1355770X17000444
- [5] S. Hallegatte, A. Vogt-Schilb, M. Bangalore, and J. Rozenberg, “Unbreakable: Building the resilience of the poor in the face of natural disasters,” World Bank, 2016. https://doi.org/10.1596/978-1-4648-1003-9
- [6] B. Tellman, J. A. Sullivan, C. Kuhn, A. J. Kettner, C. S. Doyle, G. R. Brakenridge, T. A. Erickson, and D. A. Slayback, “Satellite imaging reveals increased proportion of population exposed to floods,” Nature, Vol.596, pp. 80-86, 2021. https://doi.org/10.1038/s41586-021-03695-w
- [7] M. R. Carter, P. D. Little, T. Mogues, and W. Negatu, “Poverty traps and natural disasters,” World Development, Vol.35, No.5, pp. 835-856, 2007. https://doi.org/10.1016/j.worlddev.2006.09.010
- [8] G. Di Baldassarre, M. Sivapalan, M. Rusca, C. Cudennec, M. Garcia, H. Kreibich, M. Konar, E. Mondino, J. Mård, S. Pande, M. R. Sanderson, F. Tian, A. Viglione, J. Wei, Y. Wei, D. J. Yu, V. Srinivasan, and G. Blöschl, “Sociohydrology: Scientific challenges in addressing the Sustainable Development Goals,” Water Resources Research, Vol.55, No.8, pp. 6327-6355, 2019. https://doi.org/10.1029/2018WR023901
- [9] M. Nilsson, D. Griggs, and M. Visbeck, “Policy: Map the interactions between Sustainable Development Goals,” Nature, Vol.534, pp. 320-322, 2016. https://doi.org/10.1038/534320a
- [10] N. Weitz, H. Carlsen, M. Nilsson, and K. Skånberg, “Towards systemic and contextual priority setting for implementing the 2030 Agenda,” Sustainability Science, Vol.13, pp. 531-548, 2018. https://doi.org/10.1007/s11625-017-0470-0
- [11] G. G. Singh, A. M. Cisneros-Montemayor, W. Swartz, W. Cheung, J. A. Guy, T.-A. Kenny, C. J. McOwen, R. Asch, J. L. Geffert, C. C. C. Wabnitz, U. R. Sumaila, Q. Hanich, and Y. Ota, “A rapid assessment of co-benefits and trade-offs among Sustainable Development Goals,” Marine Policy, Vol.93, pp. 223-231, 2018. https://doi.org/10.1016/j.marpol.2017.05.030
- [12] T. Bennich, N. Weitz, and H. Carlsen, “Deciphering the scientific literature on SDG interactions: A review and reading guide,” Science of The Total Environment, Vol.728, Article No. 138405, 2020. https://doi.org/10.1016/j.scitotenv.2020.138405
- [13] H. Hoff, “Understanding the Nexus: Background Paper for the Bonn2011 Conference,” Stockholm Environment Institute, 2011.
- [14] G. Rasul and B. Sharma, “The nexus approach to water–energy–food security: An option for adaptation to climate change,” Climate Policy, Vol.16, No.6, pp. 682-702, 2016. https://doi.org/10.1080/14693062.2015.1029865
- [15] G. Rasul, “Managing the food, water, and energy nexus for achieving the Sustainable Development Goals in South Asia,” Environmental Development, Vol.18, pp. 14-25, 2016. https://doi.org/10.1016/j.envdev.2015.12.001
- [16] G. Pescaroli and D. Alexander, “A definition of cascading disasters and cascading effects: Going beyond the ‘toppling dominos metaphor’,” Planet@Risk, Vol.3, No.1, pp. 58-67, 2015.
- [17] E. E. Koks, R. Pant, S. Thacker, and J. W. Hall, “Understanding business disruption and economic losses due to electricity failures and flooding,” Int. J. of Disaster Risk Science, Vol.10, pp. 421-438, 2019. https://doi.org/10.1007/s13753-019-00236-y
- [18] Newton Consulting, “World Risk Report 2024,” 2024 (in Japanese). https://www.newton-consulting.co.jp/bcmnavi/backnumber/20241127/ [Accessed July 15, 2025]
- [19] National Disaster Risk Reduction and Management Council (NDRRMC), “Disaster Reports.” https://ndrrmc.gov.ph/disaster-reports.html [Accessed July 15, 2025]
- [20] ReliefWeb, “Disaster Situation Reports.” https://reliefweb.int/search/results?search=NDRRMC+Update+sitrep [Accessed July 15, 2025]
- [21] N. Nagumo and H. Sawano, “Land classification and flood characteristics of the Pampanga River Basin, Central Luzon, Philippines,” J. of Geography (Chigaku Zasshi), Vol.125, pp. 699-716, 2016. https://doi.org/10.5026/jgeography.125.699
- [22] N. Nagumo, M. Ohara, and V. Ballaran, Jr., “Settlement location patterns in flood-prone areas of Central Luzon, Philippines,” Abstracts of the Autumn Meeting of the Association of Japanese Geographers, 2024 (in Japanese).
This article is published under a Creative Commons Attribution-NoDerivatives 4.0 Internationa License.