Paper:
A Stylized Agent-Based Framework for Exploring Flood–Poverty Dynamics Among Rice Farmers: A Case Study of Candaba, Philippines
Tomohiro Tanaka*1,†
 , Shi Feng*1, Maria Angeles Ocampo Catelo*2, Akiyuki Kawasaki*3
, Muneta Yokomatsu*4
, and Miho Ohara*5
, Shi Feng*1, Maria Angeles Ocampo Catelo*2, Akiyuki Kawasaki*3
, Muneta Yokomatsu*4
, and Miho Ohara*5
*1Disaster Prevention Research Institute, Kyoto University
Gokasho, Uji, Kyoto 611-0011, Japan
†Corresponding author
*2Department of Economics, College of Economics and Management, University of the Philippines Los Baños
Los Baños, Philippines
*3Institute for Future Initiatives, The University of Tokyo
Tokyo, Japan
*4International Institute for Applied Systems Analysis
Laxenburg, Austria
*5Center for Integrated Disaster Information Research (CIDIR), Interfaculty Initiative in Information Studies, The University of Tokyo
Tokyo, Japan

Flood disasters increasingly shape rural livelihoods in Southeast Asia, not only through crop losses but also through long-term socioeconomic effects. This study develops a stylized agent-based framework (ABMAAF) to analyze flood–poverty dynamics in Candaba, Philippines. The model integrates spatially heterogeneous flood risk, endogenous rice market responses, and household wealth trajectories. Flood sequences were generated stochastically to highlight structural mechanisms rather than reproduce historical events. Results reveal that medium floods often generate larger inequality effects than rare large floods, as localized impacts create sharp disparities. Price elasticity of demand is critical: with low elasticity, price surges partly offset losses from large floods but amplify inequality during medium floods; with high elasticity, large floods dominate. Regression analysis further reveals that sequential shocks matter: medium floods following a large flood significantly increase inequality, as demonstrated by counterfactual comparisons and the interaction term in the regression model. These findings highlight that flood impacts depend not only on magnitude, but also on market functioning and event sequence. Methodologically, the ABMAAF links hydrological shocks with inequality trajectories, offering a framework for exploring disaster–poverty traps. Policy implications include strengthening safety nets during recovery and designing food market interventions that mitigate distributional risks under recurrent floods.
1. Introduction
In recent decades, flood disasters have drawn increasing global attention because of their rising frequency and severity. Climate change has been identified as the major driver of this trend, altering precipitation regimes and amplifying hydrological extremes across diverse regions. According to the Sixth Assessment Report of the Intergovernmental Panel on Climate Change (IPCC), global mean temperatures are projected to continue rising until at least the mid-21st century, accompanied by a significant increase in the frequency of heavy rainfall events in many parts of the world, including Southeast Asia 1. This escalation of hydro-meteorological hazards poses a particular challenge for developing countries, where large populations depend on climate-sensitive livelihoods and institutional and infrastructural capacities to cope with disasters are limited.
Flood impacts are highly uneven across populations. Numerous studies have highlighted that socially and economically vulnerable communities tend to suffer disproportionately from flood disasters 2,3. Poor households are more likely to reside in flood-prone areas, occupy fragile housing structures, and lack the financial resources to recover from damage 4. Consequently, floods not only generate immediate physical losses, but also perpetuate cycles of poverty and inequality. Moulds et al. noted that flood risk management interventions can exacerbate social inequalities when they neglect distributional consequences, emphasizing the need to analyze floods through both physical and socioeconomic lenses 5. In rural contexts, particularly in developing countries, farming households face compounding risks due to climate variability, market fluctuations, and limited safety nets.
Agriculture is a climate-sensitive sector and flood disasters pose an acute threat to sustainability. Although drought has received considerable research attention in the agricultural sector, particularly in arid and semiarid areas, flooding represents an equally serious hazard in tropical farming regions. In Southeast Asia, where rice cultivation dominates subsistence and commercial agriculture, recurrent floods disrupt cropping cycles, reduce yields, and compromise food security. Beyond direct yield impacts, floods influence household economies, local market dynamics, and long-term livelihood trajectories. Aryal et al. emphasized that smallholder farmers in South Asia face constrained adaptation options because of land scarcity, limited access to credit, and institutional weaknesses 6. Thus, examining flood impacts not only on crop production, but also on household-level economic sustainability and inter-household inequality is essential.
Traditional approaches to climate change impact assessments in agriculture often rely on macroeconomic or sectoral models that aggregate outcomes across regions. Although these models identify broad trends, they obscure the heterogeneity of household decisions and adaptation strategies. However, adaptation is fundamentally heterogeneous; households respond differently depending on their landholdings, income levels, access to markets, and risk perceptions. To capture these dynamics, scholars have increasingly employed agent-based models (ABMs) that simulate heterogeneous agents interacting in a defined environment. ABMs are particularly suited to farming systems because they can incorporate household-level variations in land use, assets, and risk preferences. Moreover, they make it possible to analyze emergent outcomes such as inequality, cooperation, or migration.
Several studies have applied ABMs to agricultural adaptation under climate stress. For example, Choquette-Levy et al. investigated how risk-transfer policies shape mobility and immobility under climate-induced hazards and indicated that institutional arrangements strongly affect household adaptation choices 7. Juarez-Lucas et al. studied coping strategies in Philippine floodplains, illustrating how temporary income opportunities during floods may paradoxically entrench long-term vulnerability 8. These contributions demonstrate the potential of ABMs to illuminate the complex interplay among environmental shocks, market mechanisms, and household adaptations.
Despite these advances, significant gaps remain in understanding the long-term socioeconomic impact of repeated floods on rural households in Southeast Asia. Many existing studies have focused on one-time damage or drought-related risks, with limited attention paid to how recurrent flooding interacts with market responses and household wealth trajectories. Moreover, few studies have explicitly linked flood events to inequality dynamics, leaving an incomplete picture of how disasters reshape social structures. Addressing these gaps requires models that integrate hydrological shocks, market-mediated responses, and household-level asset dynamics.
The Pampanga River Basin in the Philippines is a highly relevant case study. As one of the country’s primary rice-producing regions, it simultaneously faces chronic flood risk from typhoons and seasonal rainfall. Candaba City, situated within Pampanga Province, is frequently inundated and has suffered heavy losses during Typhoons Haiyan (2013) and Ulysses (2020). Socioeconomically, Candaba’s households rely on small-scale rice farming with limited diversification and scant access to formal credit or insurance. These conditions render households highly vulnerable to recurrent shocks and prone to indebtedness. Simultaneously, local rice markets are sensitive to production shocks; large floods may paradoxically raise rice prices, buffering some household incomes, while enhancing disparities among others.
To address these complexities, this study developed an Agent-Based Model for Agricultural Activities under Flood Risk (ABMAAF). The methodological novelty lies in the following three aspects.
-
Integrating a local rice market scheme: Unlike many agricultural ABMs that stop at yield and income estimation, ABMAAF endogenizes rice prices based on local demand-supply dynamics. This allows the model to capture counterintuitive outcomes, such as income stabilization during large floods owing to price surges.
-
Linking flood exposure with long-term poverty and inequality dynamics: By modeling household wealth trajectories and computing Gini coefficients, the model goes beyond short-term damage assessment to explore the structural and cumulative impacts of repeated floods.
-
Embedding heterogeneous flood frequencies across spatial zones: By assigning distinct flood probabilities to different community zones, the model reflects how spatial risk heterogeneity drives divergent household outcomes, demonstrating why medium-scale floods generate the greatest inequality.
Notably, although the flood scenarios employed here are stylized and hypothetical, this design serves to isolate and highlight the structural mechanisms linking floods, markets, and household well-being. This approach provides a transparent foundation for methodological development, paving the way for future integration of hydrodynamic simulations and climate projections.
Therefore, the objectives of this study are threefold: (i) to examine how recurrent small- and medium-scale floods compare with rare large floods in shaping household wealth accumulation; (ii) to assess how market-mediated rice price changes alter household vulnerability; and (iii) to evaluate how inequality evolves under different flood scenarios. This study advances both the methodological toolkit of socio-hydrology and evidence-based design of equitable flood risk management strategies.
2. Study Area and Data
2.1. Geographic and Climatic Context
The Pampanga River Basin, located in Central Luzon, is the third largest river basin in the Philippines, with an area of approximately 10,540 km\(^2\). The basin plays a critical role in national food security, with vast tracts of irrigated rice fields earning it a reputation as one of the country’s “rice granaries.” The annual rainfall in the basin averages approximately 2,100–2,200 mm, with a marked wet season (May–November) and dry season (December–April). Although this bimodal climate supports the double cropping of rice, it also exposes farming communities to recurrent floods during the wet season.
The hydrological regime of the Pampanga River is strongly influenced by monsoon rains and typhoons. Typhoons such as Haiyan in 2013 and Ulysses in 2020 delivered over 300 mm of rainfall in 24 hours, causing large-scale inundation 9. Riverine flooding is compounded by local drainage limitations, which lead to frequent backwater and pluvial flooding in low-lying areas. Among the municipalities within the Pampanga Province, Candaba City is particularly flood-prone because of its location adjacent to the Candaba Swamp and the left bank of the Pampanga River.
2.2. Socioeconomic Conditions
Candaba has a population of approximately 110,000, and agriculture is the dominant livelihood. The city comprises 33 administrative districts called barangays. Approximately 70% of households depend primarily on rice cultivation, with secondary production of vegetables and fruits. Landholdings are typically small, averaging 1–2 hectares, and are managed under family-based farming systems. The poverty incidence in Pampanga Province remains above the national average, and limited access to credit and crop insurance leaves households financially vulnerable to shocks.
Many households practice double cropping and planting during both the wet and dry seasons. However, wet season crops are highly vulnerable to flooding. Farmers adopt coping strategies, such as temporary fishing during inundation or small-scale transport services using boats, which provide short-term income but do not offset long-term agricultural losses. Previous field surveys have documented how these strategies paradoxically entrench vulnerability, as they tie households to flood-prone livelihoods and increase reliance on informal lending networks with high interest rates 8,10.
2.3. Flood Hazard Classification
Past flood records compiled by ICHARM and local governments reveal distinct spatial heterogeneity in flood frequency. Building on Nagumo et al. 10, Candaba’s barangays were classified into four zones (A–D) based on historical inundation exposure (Fig. 1). Zone A represents relatively safe areas with rare flooding, whereas Zone D encompasses the most flood-prone communities along the riverbanks and swamp margins. This zonal classification provides a basis for modeling heterogeneous flood probabilities across households.
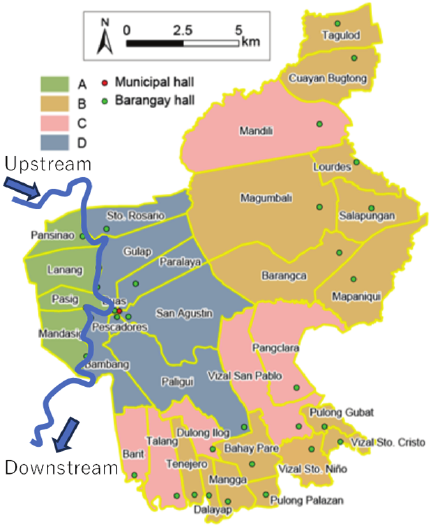
Fig. 1. Flood risk classification of barangays in Candaba City based on Nagumo et al. 10, with modifications by the authors. Flood risk is lowest in Zone A and increases in the order of B, C, and D.
In this study, each zone was assigned an indicative return period representing flood protection levels: \(1/1000\) for Zone A, \(1/100\) for Zone B, \(1/10\) for Zone C, and \(1/2\) for Zone D. Although these return periods are stylized rather than derived from hydrodynamic modeling, they approximate the relative differences in exposure and provide a transparent framework for simulating spatially heterogeneous flood risks.
3. Methods
3.1. Overview of the ABMAAF Framework
We developed the ABMAAF to examine the impact of recurrent flooding on household welfare. The model treats each farming household as an agent characterized by landholding size, seasonal cropping patterns, and household consumption needs. The model iterates annually and captures the interactions between (i) flood-induced yield losses, (ii) rice market dynamics, and (iii) household budget updates.
The ABMAAF comprises two interconnected submodels:
-
Rice Market Scheme: determines rice production, demand, and price evolution.
-
Household Budget Scheme: calculates each household’s income, consumption, and wealth trajectory.
By combining these elements, the ABMAAF extends beyond conventional crop-damage assessments, linking environmental shocks to long-term poverty dynamics and inequality.
3.2. Rice Market Scheme
At time step \(t\), the market price of rice \(p(t)\) is determined by the balance between demand and supply. Aggregate supply \(Y_{\textrm{S}}(t)\) is obtained by adding the household yields, which depend on cultivated area, productivity, and flood occurrence, as described below. Potential demand \(Y_{\textrm{D}}(p(t))\) is modeled as a function of price, with the price elasticity of demand (PED) \(\lambda\). Here, PED is defined as the absolute value of the conventional elasticity measure (denoted as \(\lambda\)), such that higher values indicate more elastic demand and lower values indicate less responsive demand. This convention is adopted to avoid confusion arising from the usual negative signs of demand elasticity.
Actual transaction volume is given by
Notably, this endogenous price mechanism is a novel contribution of the ABMAAF. Whereas many agricultural ABMs assume exogenous or fixed prices, our model captures how floods not only reduce yields, but also trigger price surges, which in turn mediate household incomes. This enables the analysis of counterintuitive outcomes such as large floods that reduce yields and stabilize incomes through market responses.
3.3. Household Budget Scheme
Each household \(i\) is modeled with cultivated area in the wet season \(A_{\textrm{w},i}(t)\) and the dry season \(A_{\textrm{d},i}(t)\), respectively, per-hectare yield \(y\) and production costs \(\iota\), and minimum consumption needs \(c_{\min}\). The annual harvest is
Negative \(B_i(t)\) reduces wealth, representing indebtedness. Accordingly, the wealth in year \(t\) is obtained as
3.4. Flood Scenario Generation
Flood scenarios are generated probabilistically. Each year, a random number \(u\sim U(0,1)\), where \(U(0,1)\) represents the uniform distribution over the interval \([0,1]\), is drawn for each zone. If \(u\) falls below the inverse return period of the zone, a flood occurs. For instance, Zone D with an inverse return period of (i.e., mean annual occurrence ratio) \(1/2\) experiences flooding on average every two years. When flooding occurs, the wet-season yield for affected households is set to zero (\(\varphi_i(t)=0\)).
This stylized design deliberately abstracts from hydrodynamic modeling. The objective is to isolate structural mechanisms rather than replicate specific historical events. By controlling flood frequency across zones, the model explores how different patterns of shocks—rare large floods versus frequent small and medium floods—affect long-term household trajectories. This approach provides methodological transparency and facilitates sensitivity analyses.
3.5. Parameterization
Model parameters were derived from a combination of national statistics from the Philippine Statistics Authority (PSA) 11 and local survey data (Table 1).
-
Rice yield: 4.3 t/ha.
-
Production cost: PHP 30,000/ha.
-
Minimum consumption expenditure: PHP 22,000 per capita per year, based on field interviews.
-
Household size: average of 5.
-
Initial rice price: PHP 17,000/t.
-
Saving rate: 5%, consistent with Orbeta 12.
Table 1. Model parameters.

Landholding distributions were based on barangay-level statistics from the 2013 Agricultural Census in Candaba. Rather than assigning the exact observed parcel sizes to household agents, we randomly generated landholdings from a gamma distribution parameterized by the mean and variance of each barangay. This choice was motivated by two considerations: (i) histograms of the census data were well approximated by a gamma distribution and (ii) the aim of this study was a stylized analysis that focused on structural mechanisms rather than replicating the precise heterogeneity of observed households.
3.6. Novelty of the Approach
The ABMAAF contributes methodologically in several ways:
-
Integrating market and household dynamics: Unlike standard flood-damage models, the ABMAAF endogenizes rice prices, capturing how market mechanisms mediate disaster impacts.
-
Long-term poverty and inequality analysis: By tracking wealth and computing Gini coefficients, the model moves beyond one-time loss estimates to explore structural socioeconomic consequences.
-
Spatial heterogeneity of risk: Assigning differential flood probabilities across zones highlights how geography shapes vulnerability and inequality.
-
Stylized scenario design for transparency: Based on hypothetical return periods, the scenario framework offers generalizable insights and prepares the ground for future integration with hydrodynamic models.
3.7. Simulation Design
Simulations were run over a 40-year horizon to approximate two farming generations. For each scenario, multiple Monte Carlo replications were conducted to account for stochastic variations in flood events. The outputs include household income trajectories, wealth accumulation, rice price evolution, and Gini coefficient dynamics.
Through this design, the model not only assesses household vulnerability, but also illuminates the structural pathways by which recurrent floods entrench poverty and widen inequality.
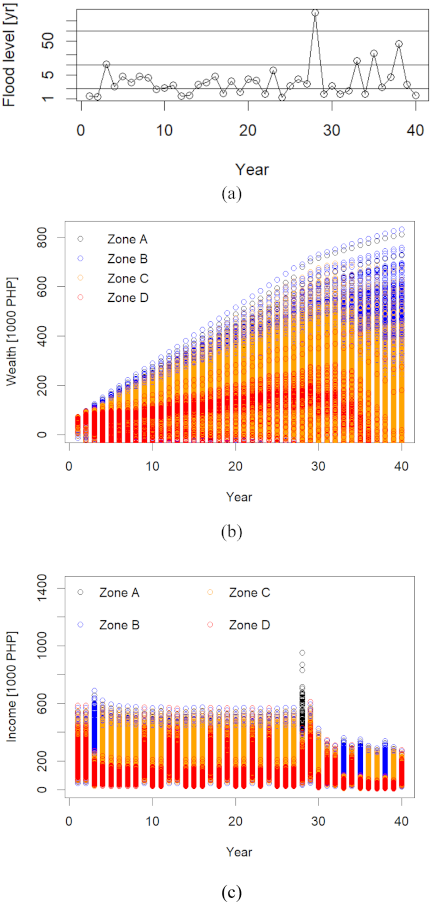
Fig. 2. Simulation results of the ABMAAF. (a) Flood magnitudes expressed as return periods, (b) savings, and (c) annual income by agent in Zones A (black), B (blue), C (yellow), and D (red). The return periods of 2, 10, and 100 years (marked by the black lines in (a)) are the flooding thresholds in each zone.
4. Results
4.1. Household Asset Formation Under Flood Scenarios
Figure 2 illustrates the temporal evolution of flood magnitudes (Panel a), household wealth across zones (Panel b), and annual household income (Panel c) over a 40-year simulation period. A key insight is the marked divergence in wealth accumulation across zones with different flood damage frequencies. Households in Zones A and B, which rarely experience floods (\(<1/100\) annual probability), steadily accumulate wealth, whereas those in Zone D, which experiences floods every two years on average, struggle to develop wealth over time.
Interestingly, the relationship between flood magnitude and income is not linear. In Year 28, a major flood exceeding the 100-year return period struck the region. Despite the substantial reduction in rice yield, farm household income did not fall as sharply as expected (Fig. 2(c)). This counterintuitive outcome is attributable to rice price surges as the market adjusts to supply shortages. This finding is consistent with observations from Southeast Asia, where food price volatility following disasters has been shown to partially buffer aggregate income losses, even while exacerbating consumer hardship 13,14.
In contrast, repeated small- and medium-scale floods (e.g., 10- to 20-year return period) produced cumulative negative effects on household budgets. In these cases, the reduction in local yield was not sufficient to trigger large price increases, indicating that the affected households in Zones C and D bore losses without compensatory gains from the market. Over time, these recurrent medium shocks eroded household wealth, leading to long-term stagnation in financial asset formation. This dynamic resonates with the “disaster poverty trap” mechanism 15, whereby frequent shocks prevent poor households from accumulating capital, leaving them persistently vulnerable.
4.2. Income Distribution and Inequality
The time series of Gini coefficients of income inequality is presented in Fig. 3, alongside flood magnitudes for comparison. The Gini coefficient did not peak during the largest flood event. Instead, the highest inequality levels emerged during medium-scale floods (return periods between 10 and 100 years).
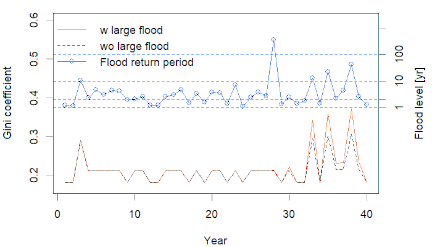
Fig. 3. Temporal variation of the Gini coefficient under scenarios with the large flood (red line) and without it (black line) in Year 28, shown together with flood magnitudes (blue line) from Fig. 2(a).
For example, in Year 3, a flood with around 10-year return period struck. Approximately 38% of all households (Zones C and D) experienced complete wet-season crop failure, whereas the remaining households maintained production and benefited from modest price increases. Consequently, inequality spiked, with the Gini coefficient reaching its maximum value. In contrast, in the extreme flood of Year 28, 95% of all households (Zones B, C, and D) were affected; therefore, relative disparities were smaller, although the aggregate losses were greater.
This outcome aligns with broader findings in the disaster risk literature: inequality is not always most pronounced during catastrophic events but often peaks when impacts are unevenly distributed across a community 16,17. In Candaba’s case, spatial heterogeneity in flood frequency means that medium floods disproportionately burden households in Zones C and D, thus magnifying inequality.
4.3. Market Dynamics and Price Adjustment
The rice market scheme indicates that PED played a critical role in mediating household outcomes. When the PED is low, consumer demand does not decrease significantly, even if rice prices rise because of a poor harvest. Consequently, while consumer expenditure on rice increases, farmers’ income losses from the reduced supply are offset (Fig. 4). Conversely, when the PED is high, demand decreases as prices rise, leading to long-term income degradation for damaged farmers and escalating inequality. This sensitivity highlights the crucial role of market functioning in shaping disaster impacts, echoing Tadasse et al.’s 18 findings on food price transmission in developing countries. Overall, the results demonstrate that household vulnerability to floods is a product of not only exposure and yield losses but also market responses and spatial inequalities.
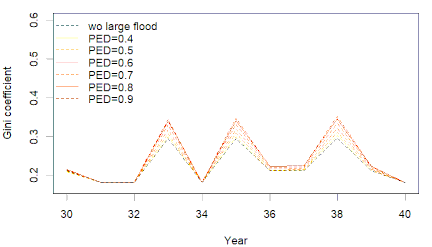
Fig. 4. Same as Fig. 3 but with a range of PED (0.4, 0.5, 0.6, 0.7, 0.8, and 0.9). The Gini coefficient from Years 30 to 40 is shown to emphasize the sequence of medium floods.
4.4. Counterfactual Analysis of the Large Flood in Year 28
To further illustrate the compounding effects of sequential floods, we compared the actual simulation, where a large flood occurred in Year 28, with a counterfactual scenario in which no large flood occurred in that year (Fig. 3). In the counterfactual sequence, moderate floods in subsequent years produced moderate fluctuations in the Gini coefficient. In contrast, in the original simulation, the large flood in Year 28 caused a drastic decline in the total supply and an initial surge in the rice price. When a medium flood occurred shortly afterward, the Gini coefficient rose markedly higher than in the counterfactual case. This divergence provides visual evidence that the timing of medium floods significantly influences the trajectories of inequality relative to the effect of large floods.
Table 2. Results of regression analysis for inequality (dependent variable: annual Gini coefficient).

4.5. Regression Analysis of Medium and Large Floods
To statistically evaluate the effects of sequential floods, we estimated a linear regression model using annual data on flood events and inequality. The explanatory variables included dummy variables (zero or one) for medium floods (MediumFlood) and large floods (LargeFlood). Furthermore, their interaction is defined as another dummy variable (MediumFlood \(\times\) LargeFlood). The dependent variable was the annual Gini coefficient. This specification allows us to test whether medium floods occurring together with a large flood exert an additional inequality effect beyond the independent impact of each event.
Table 2 summarizes the regression estimates. The coefficients for \(\textit{MediumFlood}_t\), \(\textit{LargeFlood}_t\), and the interaction term \(\textit{MediumFlood}_t \times \textit{LargeFlood}_t\) were all positive and statistically significant (\(p <0.01\)) except for \(\textit{LargeFlood}_t\). This indicates that medium floods independently increase inequality, whereas, large floods do not significantly raise inequality as discussed above. Most importantly, when medium- and large-flood conditions overlap, the inequality effect is amplified.
These results confirm that the observed surge in inequality following the large flood in Year 28 is not an artifact of a single scenario but a statistically robust pattern: sequential shocks matter.
5. Discussion
5.1. Flood Impacts Beyond Yield Losses
These results indicated that floods influence rural livelihoods through pathways beyond direct crop damage. Large-scale floods, although devastating in biophysical terms, may not always translate into the greatest income losses because market adjustments redistribute impacts. Conversely, frequent small and medium floods, which are less dramatic in isolation, cumulatively erode household wealth and perpetuate vulnerability.
Empirical evidence from other Asian agricultural contexts also supports the mechanisms identified in this study. For example, in Bangladesh, del Ninno et al. reported that repeated moderate floods had longer-lasting welfare impacts than single catastrophic events 14. Kawasaki and Shimomura 19 used household-level data from Myanmar to demonstrate that recurrent floods can exacerbate poverty and widen income disparities across communities. Their results suggest that repeated moderate-scale flood events may generate cumulative welfare losses that disproportionately affect vulnerable households, leading to distributional divergence over time.
Although Bangladesh, Myanmar, and the Philippines differ institutionally, the structural mechanism by which recurrent shocks interact with market and household dynamics to produce inequality effects appears comparable. In particular, in contexts in which price adjustments are not strongly constrained by national caps or large-scale external imports, local production shocks may translate into distributional consequences similar to those simulated here. This cross-regional consistency lends indirect empirical support to the stylized mechanism explored in this model.
5.2. Disaster–Poverty Traps in Agricultural Communities
The persistent inability of households in Zone D to accumulate financial assets illustrates a classic disaster–poverty trap 15. Recurrent shocks prevent households from investing in productivity-enhancing measures, forcing reliance on informal lenders, and leading to cycles of indebtedness. Similarly, Hallegatte et al. argue that disasters can push vulnerable populations into long-term poverty if social safety nets and financial instruments are absent 16. Our model reinforces these insights by quantifying how differential flood exposure interacts with the market dynamics to entrench inequality.
5.3. Coping Strategies and Their Limits
Field studies in Candaba have documented temporary coping strategies, such as fishing in inundated fields or boat transport during floods 8. The present model does not explicitly incorporate these jobs. Instead, it isolates agricultural income shocks and cumulative wealth effects.
In the simulated dynamics, flood-induced wealth reductions persist beyond the disaster year through gradual price adjustments and inequality accumulation. This suggests that coping strategies confined to the flood year may not fully offset the long-term economic consequences, although their actual buffering capacity cannot be evaluated within the current model. Incorporating temporary livelihood diversification would enable a more explicit assessment of short- and long-term adaptations.
5.4. Policy Implications
The insights from the ABMAAF have direct relevance to disaster risk reduction and agricultural policy. First, insurance schemes can mitigate disaster–poverty traps by smoothing income shocks, as demonstrated in the South Asian context 20. Second, planned relocation or land consolidation may be necessary in highly flood-prone zones, although such interventions require careful design to avoid social disruption 21. Third, investments in market infrastructure, such as improved storage, transport, and price-stabilization mechanisms, can help reduce harmful volatility, ensuring that price adjustments benefit producers without overburdening consumers.
The current rice price in the Philippines is controlled to remain stable under shocks, such as disasters, to stabilize the market. The model can represent this with a no-price-adjustment, \(\kappa_{\textrm{Y}}=0\), although such scenarios were not the primary focus of this study.
5.5. Methodological Contributions and Future Directions
From a methodological standpoint, the ABMAAF successfully integrated household heterogeneity, market dynamics, and spatially differentiated flood risks into a single scheme. Unlike many models that evaluate only direct damage, our approach links environmental shocks to long-term inequality metrics, offering a richer perspective on disaster impact.
Nevertheless, this study has some limitations. The flood scenarios are stylized based on the indicative return periods of barangay units a binary outcome of no damage or complete damage rather than hydrodynamic simulations. Although within-barangay variations in flood depth may exist, prior studies in Candaba suggest that flood exposure differences across barangays are more pronounced than microscale variations within them 8, partially supporting this assumption. Although this abstraction clarifies the structural mechanisms, future work should integrate the outputs from hydraulic models under climate change scenarios to improve realism.
The model assumes that flood impacts are confined to the affected cropping season and do not directly reduce production capacity in subsequent seasons. This assumption reflects the empirical conditions in Candaba, where dry-season cultivation generally resumes after wet-season flooding, agricultural machinery is evacuated before inundation, and post-flood recovery programs provide seed and fertilizer support. Nevertheless, in other contexts where capital destruction or recovery delays occur, multi-season cascading effects can significantly amplify inequality dynamics. Extending the model to incorporate recovery delays and asset depreciation is a valuable avenue for future research.
Additionally, the current model does not incorporate inter-household interactions such as credit networks or migration, which may further influence adaptation dynamics. Expanding the model to include such processes will enhance its explanatory power.
5.6. Compound Shocks and Timing Effects
The counterfactual comparison (Fig. 3) and regression analysis provide clear evidence that flood impacts are contingent not only on magnitude, but also on sequence and timing. Although both medium and large floods independently increased inequality, their interaction was particularly pronounced; medium floods following a large flood amplified inequality far more than either type of event alone. This finding highlights the importance of considering compound disasters in flood risk assessments, as highlighted in the broader literature on sequential climate extremes in terms of amplified hazard magnitudes 22.
These findings have several significant implications. Standard risk analyses often treat floods as independent events characterized only by the return period. However, the findings suggest that sequential shocks within a recovery window can damage social equity more than isolated events can. For policymakers, this implies that recovery and relief interventions must account for the possibility of subsequent floods. For example, targeted safety nets during the years immediately after a large flood may prevent medium floods from pushing vulnerable households into long-term poverty traps.
6. Conclusion
This study developed and applied ABMAAF to examine the long-term socioeconomic impacts of recurrent floods on rice-farming households in Candaba, Pampanga Province, Republic of the Philippines. Unlike conventional flood damage models, the ABMAAF integrates household-level heterogeneity, local rice market dynamics, and spatially differentiated flood risk. Using stylized flood scenarios, the model isolates structural mechanisms linking flood exposure, market responses, and household wealth trajectories.
Three key findings emerge. First, recurrent small- and medium-scale floods proved to be more detrimental to long-term household welfare than rare, large floods. Although catastrophic floods reduce regional yields, rice price surges partially offset income losses, whereas frequent moderate floods erode household wealth without triggering strong market adjustments. Second, the model revealed that inequality peaks during a series of medium floods after rare large floods, when a significant but partial share of households is affected by both degraded rice demand and prices by preceding large floods and reduced products by the following medium floods, producing sharp disparities between flooded and non-flooded zones. Third, households in highly flood-prone zones consistently fail to accumulate financial assets over time, illustrating a disaster–poverty trap mechanism that perpetuates vulnerability.
These findings suggest that market-based adaptation measures, such as price-stabilization mechanisms, could mitigate disaster–poverty traps. Structural interventions, including planned relocation or land consolidation in chronically flooded zones, may be necessary but must be designed to minimize social disruption. Strengthening credit access and reducing reliance on informal lending networks are critical for preventing indebtedness cycles.
From a methodological perspective, ABMAAF demonstrates the value of integrating market mechanisms and inequality metrics into disaster impact modeling. Although the present study employed stylized flood scenarios, the framework could be extended by coupling hydrodynamic flood simulations and climate change projections. Future studies should incorporate cases of faster price adjustments and household interactions, such as credit and social networks, to better capture collective adaptation dynamics.
This study highlights how recurrent floods reshape rural socioeconomic structures, not merely through direct yield losses, but also through complex interactions with markets and inequality. By providing a transparent, extensible modeling framework, ABMAAF contributes to advancing socio-hydrology and offers insights into designing equitable and sustainable flood risk management strategies in Southeast Asia and beyond.
Acknowledgments
This study was supported by the Science and Technology Research Partnership for Sustainable Development (SATREPS) project “Development of a Hybrid Water-Related Disaster Risk Assessment Technology for Sustainable Local Economic Development Policy under Climate Change” (Project No.JPMJSA1909). Household survey data were obtained from the Candaba City Agricultural Bureau.
- [1] Ministry of Education, Culture, Sports, Science and Technology, and Japan Meteorological Agency, “Provisional translation of the IPCC sixth assessment report,” Working Group I, Summary for Policymakers, 2021.
- [2] M. Yokomatsu, T. Schinko, J. Mochizuki, and A. Rezai, “Climate-related disaster and human capital investment in the Global South — Household heterogeneity and growth,” Economics of Disasters and Climate Change, Vol.8, pp. 351-383, 2024. https://doi.org/10.1007/s41885-024-00150-8
- [3] L. Vin and A. Kawasaki, “Do floods widen the economic disparity gap?” Progress in Disaster Science, Vol.24, Article No.100362, 2024. https://doi.org/10.1016/j.pdisas.2024.100362
- [4] A. Kawasaki, G. Kawamura, and W. Z. Win, “A local level relationship between floods and poverty: A case in Myanmar,” Int. J. of Disaster Risk Reduction, Vol.42, Article No.101348, 2020. https://doi.org/10.1016/j.ijdrr.2019.101348
- [5] S. Moulds, W. Buytaert, M. R. Templeton, and I. Kanu, “Modeling the impacts of urban flood risk management on social inequality,” Water Resources Research, Vol.57, No.6, Article No.e2020WR029024, 2021. https://doi.org/10.1029/2020WR029024
- [6] J. P. Aryal, T. B. Sapkota, R. Khurana, A. Khatri-Chhetri, D. B. Rahut, and M. L. Jat, “Climate change and agriculture in South Asia: Adaptation options in smallholder production systems,” Environment, Development and Sustainability, Vol.22, No.6, pp. 5045-5075, 2020. https://doi.org/10.1007/s10668-019-00414-4
- [7] N. Choquette-Levy, M. Wildemeersch, M. Oppenheimer, and S. A. Levin, “Risk transfer policies and climate-induced immobility among smallholder farmers,” Nature Climate Change, Vol.11, No.12, pp. 1046-1054, 2021. https://doi.org/10.1038/s41558-021-01205-4
- [8] A. M. Juarez-Lucas, K. M. Kibler, M. Ohara, and T. Sayama, “Benefits of flood-prone land use and the role of coping capacity: Candaba floodplains, Philippines,” Natural Hazards, Vol.84, pp. 2243-2264, 2016. https://doi.org/10.1007/s11069-016-2551-2
- [9] K. Aida, M. Ohara, N. Nagumo, K. Kubota, and T. Shinya, “Challenges of satellite-based rapid flood impact assessment: A case study of Typhoon Ulysses in the Philippines,” J. of Japan Society of Civil Engineers, Ser. B1 (Hydraulic Engineering), Vol.78, No.2, pp. I_985-I_990, 2020 (in Japanese).
- [10] N. Nagumo, K. Aida, M. Ohara, and V. G. Ballaran, “Classification of communities based on landforms and flood history in Candaba Swamp, Republic of the Philippines,” Proc. of the 9th Int. Conf. on Flood Management (ICFM9), pp. 1-6, 2019.
- [11] Philippine Statistics Authority, OpenSTAT. https://openstat.psa.gov.ph/ [Accessed March 19, 2026]
- [12] A. C. Orbeta, “Children and household saving in the Philippines,” Philippine Institute for Development Studies, Discussion Paper Series, No.47, 2006. https://doi.org/10.62986/dp2006.14
- [13] D. Dawe, “The contribution of rice research to poverty alleviation,” Studies in Plant Science, Vol.7, pp. 3-12, 2000. https://doi.org/10.1016/S0928-3420(00)80003-8
- [14] C. del Ninno, P. A. Dorosh, and L. C. Smith, “Public policy, markets and household coping strategies in Bangladesh: Avoiding a food security crisis following the 1998 floods,” World Development, Vol.31, No.7, pp. 1221-1238, 2003.
- [15] M. R. Carter, P. D. Little, T. Mogues, and W. Negatu, “Poverty traps and natural disasters in Ethiopia and Honduras,” World Development, Vol.35, No.5, pp. 835-856, 2007. https://doi.org/10.1016/j.worlddev.2006.09.010
- [16] S. Hallegatte, A. Vogt-Schilb, M. Bangalore, and J. Rozenberg, “Unbreakable: Building the resilience of the poor in the face of natural disasters,” World Bank, 2016. https://doi.org/10.1596/978-1-4648-1003-9
- [17] N. Islam and J. Winkel, “Climate change and social inequality,” World Development, Vol.95, pp. 366-374, 2017.
- [18] G. Tadasse, B. Algieri, M. Kalkuhl, and J. von Braun, “Drivers and triggers of international food price spikes and volatility,” M. Kalkuhl, J. von Braun, and M. Torero (Eds.), “Food price volatility and its implications for food security and policy,” pp. 59-82, Springer, 2016. https://doi.org/10.1007/978-3-319-28201-5_3
- [19] A. Kawasaki and N. Shimomura, “Accelerated widening of economic disparity due to recurrent floods,” Int. J. of Disaster Risk Reduction, Vol.102, Article No.104273, 2024. https://doi.org/10.1016/j.ijdrr.2024.104273
- [20] E. Bryan, C. Ringler, B. Okoba, C. Roncoli, S. Silvestri, and M. Herrero, “Adapting agriculture to climate change in Kenya: Household strategies and determinants,” J. of Environmental Management, Vol.41, pp. 227-240, 2013. https://doi.org/10.1016/j.jenvman.2012.10.036
- [21] B. K. Sovacool, “Bamboo beating bandits: Conflict, inequality, and vulnerability in the political ecology of climate change adaptation in Bangladesh,” World Development, Vol.102, pp. 183-194, 2018. https://doi.org/10.1016/j.worlddev.2017.10.014
- [22] J. Zscheischler, S. Westra, B. J. J. M. van den Hurk, S. I. Seneviratne, P. J. Ward, A. Pitman, A. AghaKouchak, D. N. Bresch, M. Leonard, T. Wahl, and X. Zhang, “Future climate risk from compound events,” Nature Climate Change, Vol.8, No.6, pp. 469-477, 2018. https://doi.org/10.1038/s41558-018-0156-3
This article is published under a Creative Commons Attribution-NoDerivatives 4.0 Internationa License.