Note:
The Realities and Challenges of the Evacuation Topography Time Map
Yasuhiro Komatsubara*,† and Munenari Inoguchi**

*Graduate School of Science and Engineering, University of Toyama
3190 Gofuku, Toyama, Toyama 930-8555, Japan
†Corresponding author
**College of Policy Science, Ritsumeikan University
Ibaraki, Japan

As climate change increases the frequency and severity of natural disasters, Japan faces additional challenges stemming from an aging population and a shrinking working-age demographic. These demographic shifts have heightened the significance of disseminating scientific knowledge to the public and developing technologies that apply such knowledge. One example is the Evacuation Topography Time Map, a tool designed to improve evacuation literacy by visualizing scientifically informed data and responding to the social expectations of disaster-affected communities. However, a review of individual implementations reveals that the realities and challenges surrounding the Evacuation Topography Time Map have not been sufficiently examined using rigorous academic methods. This study aims to elucidate these conditions and challenges as perceived by various stakeholders by applying both quantitative and qualitative analytical approaches. Interviews were conducted with key proponents, researchers, and practitioners who have been centrally involved in developing and disseminating the Evacuation Topography Time Map, using a disaster ethnography framework. Interview data were analyzed using both quantitative text analysis and steps for coding and theorization. Comparing the results of these methods helped the study to identify commonalities and differences, which informed the discussion of the realities and challenges of the Evacuation Topography Time Map. Consequently, seven key points were extracted and shared with the interviewees, through which consensus was reached to confirm the reliability and validity of the findings.
1. Introduction
1.1. A Framework for Supporting Science and Technology to Address Social Challenges in Disaster-Affected Areas amid Increasing Disaster Frequency
In recent years, large-scale natural disasters have been occurring with increasing frequency in Japan and abroad, largely owing to the effects of climate change. In Japan, the shortage of personnel responsible for disaster response has become a critical issue, exacerbated by the declining birthrate, aging population, and shrinking working-age demographics. Under these circumstances, science and technology play a vital role in disaster management.
The Science Council of Japan, which serves as the representative organization of scientists in the country and provides policy recommendations to the government, emphasizes the importance of utilizing science and technology in disaster risk reduction. This proposal stresses the importance of facilitating the effective use of science and technology 1. To address social issues in disaster-affected areas, particularly in anticipation of large-scale disasters such as the Nankai Trough earthquake, facilitation that bridges the disaster field and advancement of science and technology is essential. Accurately assessing the conditions in disaster-affected areas, and applying science and technology based on such assessments are crucial.
Various initiatives have been undertaken to address social issues in disaster-affected areas by applying science and technology. The Research Institute of Science and Technology for Society of the Japan Science and Technology Agency (JST-RISTEX) 2 has played a leading role in advancing research and development programs that focus on solving social challenges and promoting social implementation of science and technology. Moreover, JST-RISTEX has proactively supported disaster risk reduction. “Social implementation” is a term that originated from JST’s concept of “social technology,” which refers to science and technology for the benefit of people and society. It is defined as “applying and deploying research outcomes to solve social issues” 2.
1.2. Research and Implementation Efforts by JST-RISTEX in Disaster Risk Reduction
JST-RISTEX has implemented several projects to solve social issues in disaster risk reduction 2. For example, one notable initiative is the “Disaster Victim Livelihood Recovery Support System,” which has accumulated a substantial track record in supporting the individual recovery of disaster-affected residents 3. A key feature of these projects is their field-oriented approach: they identify and analyze issues through on-site fieldwork in both disaster-affected and disaster-prone areas, and promote implementing problem-solving strategies by applying science and technology. Furthermore, the results are not limited to individual regions, but are actively being deployed horizontally to other regions by generalizing them.
Among the various programs initiated under this framework is the Evacuation Topography Time Map (commonly referred to as the “NIGECHIZU”) 4,5,6,7, a tool developed by the volunteer division of Nikken Sekkei in the aftermath of the 2011 Great East Japan Earthquake. This tool visualizes the estimated time required to reach evacuation destinations during a disaster by considering the geographical features, road conditions, and other local factors. Workshop participants use colored pencils and leather cords to demarcate evacuation time zones on a map, which helps them share risk perceptions and encourages dialogue among residents. This method is gradually being adopted across Japan to promote proactive evacuation behaviors.
Although various case studies of its application across different hazards and stakeholder groups have been reported 8,9, and general overviews have been provided 10, there remains a lack of academic studies that critically examine the practical realities and challenges of the Evacuation Topography Time Map using rigorous research methodologies. To promote further application of science and technology, examining the actual conditions and challenges of the Evacuation Topography Time Map as a form of social technology is essential. This examination will accelerate the deployment of other scientific and technological solutions to address social issues in disaster-affected areas. Moreover, strengthening the examination from the perspective of promoting further application of “science and technology” in the “field,” with “facilitation” serving as the central conceptual framework is necessary.
1.3. Objectives of the Study
This study aims to clarify the current state and challenges of the Evacuation Topography Time Map by applying academic methodologies to ensure objectivity and reliability in its analysis.
Section 2 provides an overview of the concept and development of the Evacuation Topography Time Map. Section 3 outlines the study design and presents the proposed analytical method. Sections 4 and 5 present the analysis results and discussion, respectively. Section 6 discusses the evaluation of the proposed analytical approach by the study participants.
Using this multistage analysis, this study aims to generate foundational insights that support implementing science and technology to address social issues in disaster-affected areas.
2. What Is the Evacuation Topography Time Map?
2.1. Risk Communication Using Maps
In Japan, hazard maps are increasingly acknowledged by the public as instruments for risk communication. Several cases have been reported in which their use has promoted timely evacuation and enhanced local risk awareness. However, studies have also indicated that for many citizens, hazard maps can be difficult to understand and use effectively 11.
In response to these limitations, various map-based approaches to risk communication have been developed, including disaster imagination games 12, problem-identification-based community disaster prevention workshops 13, and the Evacuation Topography Time Map 4. In recent years, the use of digital technologies and simulation tools has been reported to advance risk communication practices 14,15,16.
2.2. The Evacuation Topography Time Map
The Evacuation Topography Time Map is a risk communication tool designed to promote a personalized understanding of evacuation during various types of disasters. As of August 2024, it has been implemented in 64 municipalities across 26 prefectures in Japan, reflecting nationwide adoption 8. This tool visually represents the distance, estimated evacuation time, and direction of evacuation destinations using color coding along roads on a map, enabling users to grasp critical evacuation information intuitively.
The reported case studies include an initiative in Kamakura City, Kanagawa Prefecture, where local residents were instrumental and subsequently contributed to the improvement of evacuation routes 17, as well as ongoing annual implementation as part of integrated learning programs in Shimoda City, Shizuoka Prefecture 18. The Evacuation Topography Time Map has been applied across Japan in diverse contexts, involving various hazards and stakeholder groups.
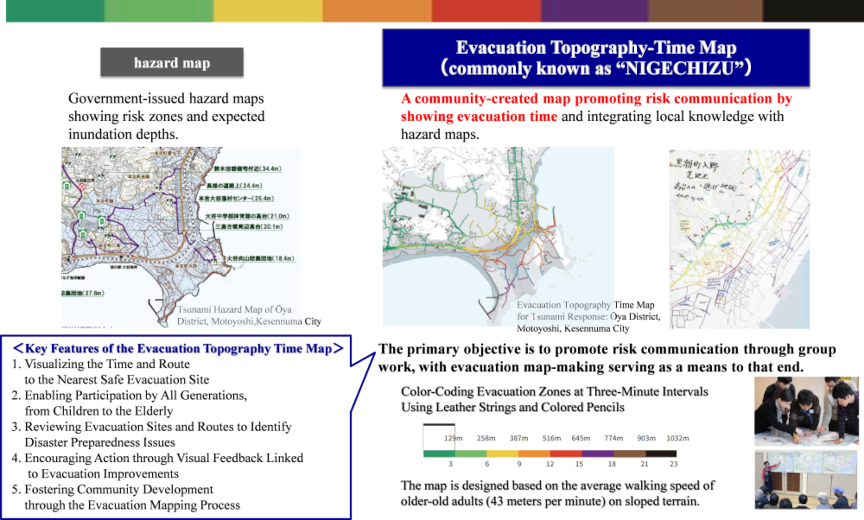
Fig. 1. Overview of the Evacuation Topography Time Map.
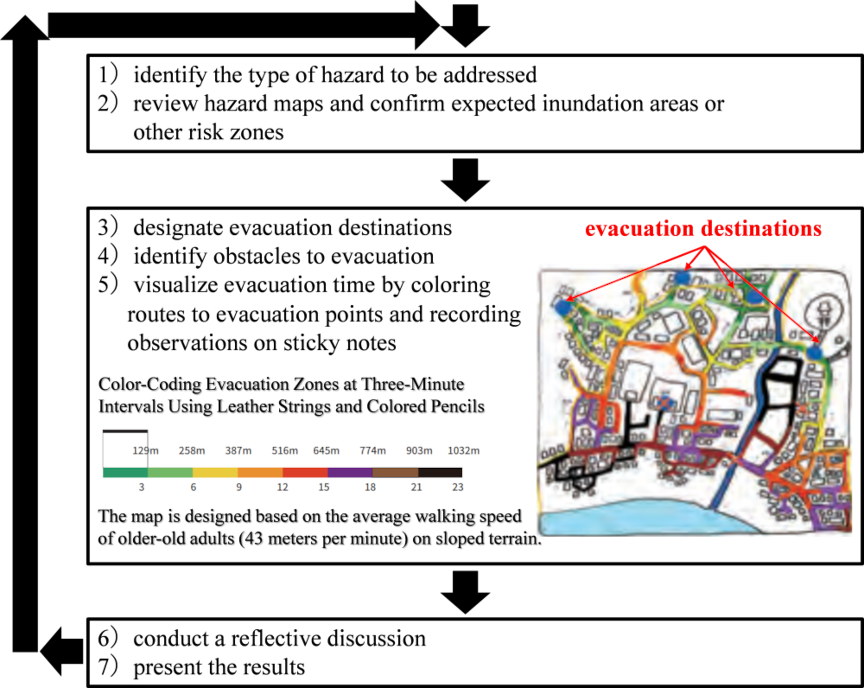
Fig. 2. Procedure for creating the Evacuation Topography Time Map (adapted and modified by the author based on references 21).
Currently, the “NIGECHIZU Study Group” 19, organized under the certified NPO corporation Japan Society of Urban and Regional Planners, is advancing this tool through collaborative efforts across industry, government, and academia. Their initiatives include developing of a qualification system for disaster preparedness facilitators, known as “Disaster NIGECHIZU Practitioners” 20, among other activities (Fig. 1).
2.3. Workshop
The detailed procedure for creating the Evacuation Topography Time Map is illustrated in Fig. 2. The process comprises the following seven steps: (1) identify the type of hazard to be addressed; (2) review hazard maps and confirm expected inundation areas or other risk zones; (3) designate evacuation destinations; (4) identify obstacles to evacuation; (5) visualize evacuation time by coloring routes to evacuation points and recording observations on sticky notes; (6) conduct a reflective discussion; and (7) present the results.
The Evacuation Topography Time Map is easy to create, even for elementary school students, using simple tools such as a blank map, colored pencils, and leather cords.
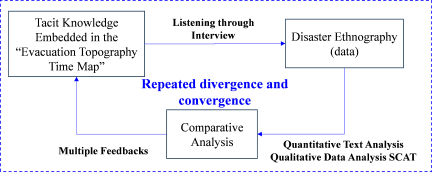
Fig. 3. Overall framework of the study.
3. Overview of the Study
The overall framework of this study is illustrated in Fig. 3. The primary objective of it is to clarify the current state and challenges associated with the Evacuation Topography Time Map. To achieve this, a combination of methodological approaches was employed for investigation and analysis. Specifically, semi-structured interviews were conducted with experts, including the tool’s originators, researchers, and practitioners, who have played central roles in developing and disseminating the Evacuation Topography Time Map, using the disaster ethnography framework.
The interview data were then analyzed using a mixed-methods approach that incorporated both quantitative text analysis and steps for coding and theorization (SCAT), a qualitative data analysis method. Using this multifaceted and scientific analysis, the study aims to obtain a comprehensive understanding of the realities and challenges of the Evacuation Topography Time Map.
The insights obtained from this study are expected to serve as foundational knowledge to support implementing scientific and technological initiatives to address the social challenges in disaster-affected areas.
3.1. Interview Survey Informed by the Principles of Disaster Ethnography
Disaster ethnography is a methodological approach used to extract tacit knowledge related to disaster response from affected individuals and translate it into explicit, shareable knowledge 22,23. Rooted in the traditions of cultural anthropology, this method seeks to visualize the lived realities of disaster response as narrated by those directly involved. Although traditional ethnography primarily aims to understand other cultures, often within the context of colonialism or subcultural studies, its application in the disaster risk reduction field has been increasingly standardized to allow for internal understanding and systematic sharing of on-the-ground knowledge 24.
The disaster ethnographic approach typically includes: (1) the use of non-structured interviews, (2) the chronological unfolding of topics, and (3) a perspective that facilitates extracting the lessons learned. In this study, these principles were adapted to explore the implicit knowledge surrounding the Evacuation Topography Time Map and strengthen our understanding of its development from inception to the present. Accordingly, semi-structured interviews were conducted to enable participants to express themselves freely within their own contextual experiences.
The interviews focused on three primary themes: (1) current involvement, how the participant has been engaged with the Evacuation Topography Time Map; (2) ideal vision, what the participant considers an ideal state for advancing the initiative; and (3) challenges, what obstacles exist in achieving that ideal. Interviewees were encouraged to chronologically recount their experiences, including their initial involvement, the evolution of their efforts, and the insights they obtained throughout the process.
3.2. Comparative Analysis
3.2.1. Quantitative Text Analysis
In this study, a quantitative analysis was conducted using KH Coder, a text-mining tool that integrates content analysis concepts with computational text analysis techniques. The KH Coder is a GUI-based software program developed by Professor Higuchi at Ritsumeikan University, a specialist in social research and quantitative text analysis 25.
A key output of this tool is a co-occurrence network that visualizes word pairs that frequently appear together within the same sentence as linked nodes. This network structure represents the similarity in word occurrence patterns using the Jaccard coefficient 26, which is employed to classify these relationships. The characteristics embedded in textual data can be identified objectively and systematically by applying quantitative text analysis.
In this study, KH Coder was used to analyze the interview transcripts to clarify the relationships among keywords and identify frequently occurring patterns in the participants’ narratives.
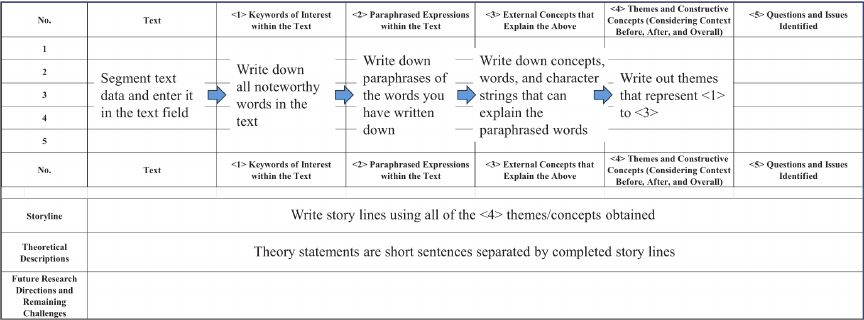
Fig. 4. SCAT form (adapted and modified by the author based on references 27,28).
3.2.2. Qualitative Data Analysis Using SCAT
Qualitative analysis was conducted using SCAT, a qualitative data analysis method. SCAT is characterized by transparent and explicit analytical procedures, and has been increasingly adopted in fields such as educational technology, healthcare, and nursing care 27,28.
SCAT involves segmenting textual data and performing four coding stages (Fig. 4): (1) extracting notable words or phrases from the text; (2) identifying external words that can serve as paraphrases for the extracted phrases; (3) associating paraphrased expressions with broader external concepts; and (4) clarifying the emergent themes and constructed concepts.
These themes and concepts are then synthesized into a coherent storyline, from which theoretical insights can be derived.
In this study, quantitative text analysis was employed to examine the data objectively, and SCAT was used to strengthen the qualitative interpretation. This study aims to enhance the richness and depth of the analytical descriptions by applying these two methods in a complementary manner.
3.2.3. Iterative Feedback Process
In this study, an iterative feedback process was conducted with reference to the methodology of Komatsubara et al. 29, to minimize the influence of researcher subjectivity and ensure analytical reliability. Recognizing that human memory is often fragmented and may contain internal inconsistencies, interview data collected from multiple participants were systematically organized. Feedback sessions were repeated with each interviewee to confirm the coherence and accuracy of their interpretations.
Using this process, the study aimed to enhance reliability by achieving a participant consensus on the consistency and structure of the analytical results.
Table 1. Interview survey schedule.

4. Results
4.1. Overview of the Interview Survey
Interview surveys were conducted with the individuals listed in Table 1. The participants were seven individuals who were instrumental in developing and disseminating the Evacuation Topography Time Map, including the original proponents, researchers, and practitioners.
To ensure the appropriateness of the selected participants, their suitability was cross-validated among interviewees during the study. Additional participants were included when necessary to ensure comprehensiveness and relevance of the data collection process.
Interviews were conducted according to the procedures described in Section 3.1. Based on the participants’ narratives, the interviewer prepared verbatim transcripts for the interviews.
4.2. Results of the Quantitative Text Analysis
The results of the quantitative text analysis are presented in Fig. 5. To enhance interpretability and reduce the potential ambiguity caused by an excessive number of visualized terms, the analysis was limited to words that appeared at least seven times and to relationships with a Jaccard coefficient of 0.2 or higher. The Jaccard coefficient is a statistical measure used to represent the similarity between two sets; values of 0.2 or above are generally interpreted as indicating a strong association (Higuchi 26).
In this study, a morphological analysis was conducted in Japanese, and a co-occurrence network was generated using the KH Coder. Note that the words visualized in the co-occurrence network were translated into English specifically for the purpose of this study; therefore, the English terms displayed in the network do not necessarily represent actual co-occurrences in the original Japanese text.
The co-occurrence network presented in Fig. 5 was further examined using the key word in context concordance function in KH Coder to understand how each extracted term was used in context. Based on these contextual interpretations, the extracted words were organized and grouped into ten categories by the researcher (Fig. 6). The group labels were reviewed based on feedback from the interview participants to confirm the appropriateness of the categorization.
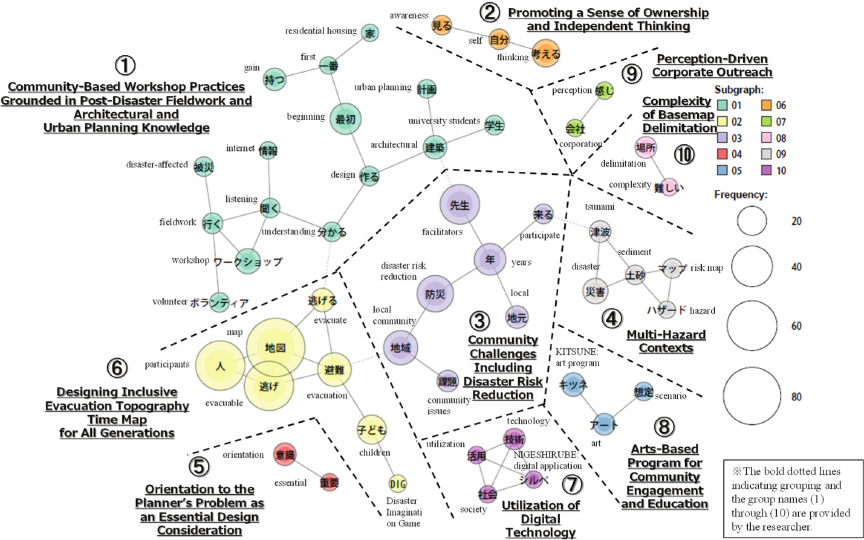
Fig. 5. Co-occurrence network.
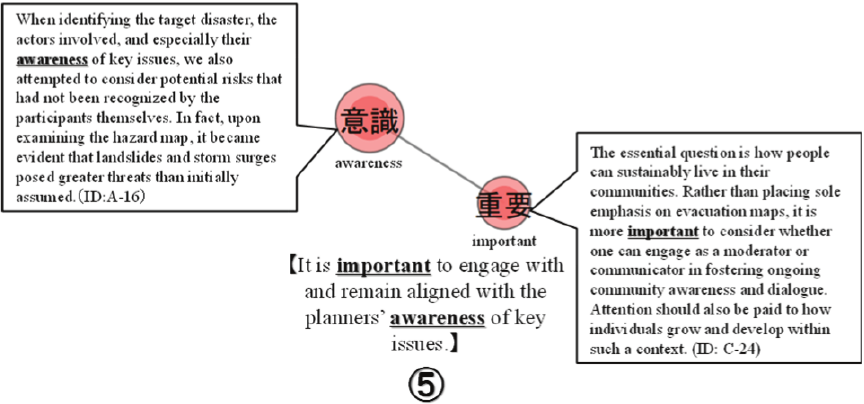
Fig. 6. Process of assigning group labels (excerpt).
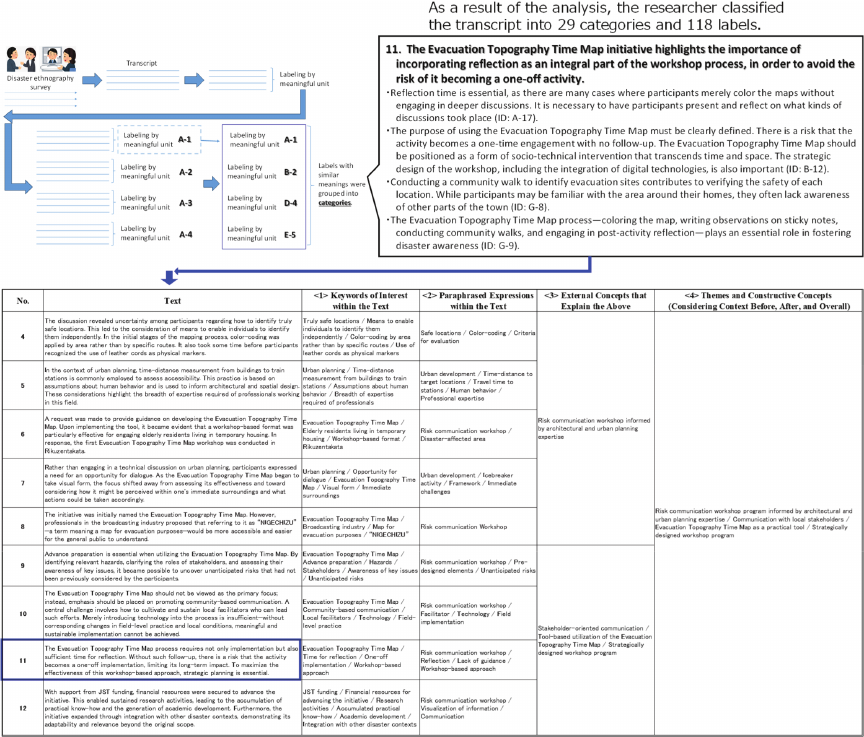
Fig. 7. SCAT analysis procedure (excerpt).
Table 2. Theoretical descriptions from SCAT (bold and underlined: \(\langle 4\rangle\) Themes and Constructive Concepts in Fig. 4).
|
① The concept of the Evacuation Topography Time Map originated from insights grounded in the experiences and lessons learned from disaster-affected communities. ② The Evacuation Topography Time Map is a risk communication workshop program that integrates architectural and urban planning knowledge, emphasizing communication with local stakeholders. ③ However, to effectively link the Evacuation Topography Time Map as a tool to the resolution of local issues, strategic workshop program design is essential. ④ The Evacuation Topography Time Map has gradually gained recognition and has expanded through collaborative efforts, receiving high acclaim from various sectors. ⑤ New initiatives have emerged from this foundation, including the application of digital technology (e.g., "NIGESHIRUBE") and art-based disaster education programs for children (e.g., "KITSUNE WO SAGASE"). ⑥ Since the tool can be used by upper-grade elementary school students, it has been utilized as educational material for disaster preparedness. In certain regions, NPOs and Boards of Education have collaborated to train facilitators who then apply the tool in school and community settings. ⑦ The NIGECHIZU Research Group, consisting of members from government, academia, and industry interested in Evacuation Topography Time Map, is promoting facilitator development through the implementation of a certification system known as the Disaster NIGECHIZU Facilitator. ⑧ Knowledge accumulation and dissemination have been advanced through the publication of books, and further discussions are underway regarding the expansion of collaborative partnerships in response to increasing demand. ⑨ On the other hand, there is a growing need to lower the barriers to implementing the Evacuation Topography Time Map, including the development of sustainable frameworks such as business models and quality assurance systems for the outputs of Evacuation Topography Time Map workshops. ⑩ Considering future societal changes such as population decline, it is necessary to re-examine the role of Evacuation Topography Time Map in communities where the number of evacuees may drastically decrease. |
Table 3. Summary of findings from the quantitative text analysis and SCAT.
| Category | Analytical results (Quantitative text analysis / SCAT extraction) |
|
Commonalities Quantitative text analysis: Identified SCAT: Identified |
⟦1⟧ Evacuation Topography Time Map is a community-based risk communication program grounded in the experiences and lessons learned from disaster-affected communities and architecture and urban planning expertise, emphasizing communication with local stakeholders.
|
⟦2⟧ Strategic workshop design for linking the Evacuation Topography Time Map to community problem-solving, including disaster preparedness and planner-oriented considerations.
|
|
⟦3⟧ Since the Evacuation Topography Time Map is designed to be inclusive for all generations and can be used by upper-grade elementary school students, it has been widely used as educational material for disaster preparedness.
|
|
⟦4⟧ The Evacuation Topography Time Map has gradually gained recognition and expanded through collaborative efforts, receiving high acclaim from various sectors. These collaborations include using digital technology and arts-based programs for community engagement and education.
|
|
⟦5⟧ There is a growing need to lower the barriers to implementing Evacuation Topography Time Map workshops, particularly in multi-hazard contexts where the complexity of base map delimitation poses significant challenges.
|
|
|
Differences Quantitative text analysis: Not identified SCAT: Identified |
⟦6⟧ The NIGECHIZU Research Group, comprising members from government, academia, and industry with a shared interest in the Evacuation Topography Time Map, has been established to advance facilitator development.
|
⟦7⟧ Considering future societal changes such as population decline, particularly in rural areas, re-examining the role of the Evacuation Topography Time Map in communities where the number of potential evacuees may drastically decrease is necessary.
|
4.3. Results of the SCAT
The analytical procedure is illustrated in Fig. 7. Based on interview transcripts, the researcher segmented the content into meaningful units and assigned labels to each unit. Labels with similar meanings were then integrated and grouped into broader categories.
Consequently, 118 labels were generated and organized into 29 categories. These 29 categories were subsequently treated as “texts” and analyzed using the SCAT method, through which theoretical descriptions were developed. This process led to the extraction of ten theoretical constructs, as summarized in Table 2.
4.4. Feedback to Interview Participants
The researcher provided feedback to the interview participants regarding the results of the quantitative text analysis and SCAT, both of which were based on interview data collected using the principles of disaster ethnography.
This iterative feedback process ensured coherence and consistency of the data, thereby enhancing the analytical rigor and reliability of the findings.
5. Discussion
This section discusses the findings by comparing the results of quantitative text analysis and SCAT, focusing on both commonalities and differences (Table 3).
5.1. Commonalities: Present in Both Quantitative Text Analysis and SCAT
The items identified by both analytical methods—quantitative text analysis and SCAT—can be interpreted as terms or themes that frequently appeared during the interviews or were recognized by the participants as particularly important. Items \(⟦ 1⟧\) through \(⟦ 5⟧\) fall under this category.
\(\boldsymbol{⟦ 1⟧}\) Evacuation Topography Time Map is a community-based risk communication program grounded in the experiences and lessons learned from disaster-affected communities and architecture and urban planning expertise, emphasizing communication with local stakeholders.
These findings suggest that the Evacuation Topography Time Map was developed through repeated visits to disaster-affected areas by proponents, who engaged with local communities and sought to incorporate the voices and lessons of those affected. This approach reflects the persistent and reflective effort to explore what could meaningfully be done in the aftermath of disasters.
The workshop was developed by the volunteer division of Nikken Sekkei, an organization with expertise in architecture and urban planning. The procedure was simple and highly visual. Participants used colored pencils and leather cords to mark evacuation routes on blank base maps. A distinctive feature of the program is its emphasis on organizers’ awareness and the importance of communicating with local residents. One participant aptly described the method as “the visualization of unintended information,” highlighting the program’s ability to reveal implicit community knowledge. Among the notable examples extracted from the data is the case where elevational differences, which are often difficult to interpret from flat maps, are represented using a physical model. An architect, who also served as a school board member, initiated this initiative. It is inferred that this example was identified through a co-occurrence analysis with keywords associated with architectural and urban planning expertise, reinforcing the interpretation that the Evacuation Topography Time Map workshop effectively integrates such disciplinary knowledge. These design features are important for evaluating the utility and potential of the Evacuation Topography Time Map.
\(\boldsymbol{⟦ 2⟧}\) Strategic workshop design for linking the Evacuation Topography Time Map to community problem-solving, including disaster preparedness and planner-oriented considerations.
Ushiyama et al. 13 and Komura 30 warned that merely conducting a workshop is not inherently meaningful because it may create a false sense of accomplishment without prompting concrete action. However, in the case of the Evacuation Topography Time Map initiative, there are reported examples in which workshop outcomes have been used to implement specific measures such as improving evacuation routes or removing concrete block walls that could hinder evacuation 17.
As a workshop developed by professionals in architecture and urban planning, the Evacuation Topography Time Map reflects a high level of awareness regarding community development. Consequently, it not only facilitates proactive disaster preparedness measures but also holds the potential to evolve into broader initiatives to solve local issues from multiple perspectives, transcending the conventional boundaries of disaster risk reduction.
\(\boldsymbol{⟦ 3⟧}\) Since the Evacuation Topography Time Map is designed to be inclusive for all generations and can be used by upper-grade elementary school students, it has been widely used as educational material for disaster preparedness.
Although the designation of the target area and selection of the disaster type during the preparatory phase can present certain challenges, the actual implementation process is simple and highly user-friendly. Consequently, the program can be conducted with upper elementary school students and has already been successfully introduced in educational settings. This demonstrates its applicability and effectiveness as a disaster education tool.
Table 4. Summary of classification by field, facilitation, and science and technology.

However, as discussed in Item \(⟦ 5⟧\) below, the preparatory process, particularly in determining the appropriate geographic scope and disaster scenario, requires careful consideration and creative planning to ensure effectiveness.
\(\boldsymbol{⟦ 4⟧}\) The Evacuation Topography Time Map has gradually gained recognition and expanded through collaborative efforts, receiving high acclaim from various sectors. These collaborations include the using digital technology and arts-based programs for community engagement and education.
A distinguishing feature of the Evacuation Topography Time Map initiative lies in its simple yet refined procedures, allowing flexible integration of various input-output elements in workshop design. This adaptability facilitates diverse collaborations between digital technology and art-based programs. According to the results of the quantitative text analysis and SCAT, the initiative attracted new participants over time, contributing to the expansion of its activities.
Further innovation is anticipated through the continued collaboration among a wide range of stakeholders across various sectors.
\(\boldsymbol{⟦ 5⟧}\) There is a growing need to lower the barriers to implementing Evacuation Topography Time Map workshops, particularly in multi-hazard contexts where the complexity of base map delimitation poses significant challenges.
However, some participants noted difficulties preparing the base map that was used as the foundation for the Evacuation Topography Time Map workshop. This challenge stems from the complexities of defining the target area and selecting a specific hazard scenario, as discussed in the procedure section. Therefore, establishing a system that allows easy access to usable base maps is essential.
The Evacuation Topography Time Map approach is fundamentally based on the assumption of safe zones derived from various types of hazard maps, and it visualizes evacuation routes accordingly. However, as Ushiyama et al. 13 highlighted, hazard knowledge is a critical component in considering evacuation and safety strategies. From the perspective of disaster risk reduction, understanding the relationship between hazards and vulnerabilities is essential 31. Further collaboration with experts, knowledge networks, and institutional partners in hazard assessment is expected to enhance the depth and applicability of the Evacuation Topography Time Map methodology.
5.2. Differences: Not Identified in Quantitative Text Analysis, Identified in SCAT
Items identified solely through SCAT—but not in the quantitative text analysis—can be interpreted as concepts that, although not frequently mentioned in participant narratives, were given interpretive significance during the theoretical description process. Items \(⟦ 6⟧\) and \(⟦ 7⟧\) fall into this category.
\(\boldsymbol{⟦ 6⟧}\) The NIGECHIZU Research Group, comprising members from government, academia, and industry with a shared interest in the Evacuation Topography Time Map, has been established to advance facilitator development.
Based on the results of the SCAT, the importance of cultivating qualified facilitators for the Evacuation Topography Time Map initiative was highlighted. In response, the NIGECHIZU Research Group established a new certification system titled “Disaster NIGECHIZU Practitioner.” This initiative aims not only to ensure the quality and consistency of workshops but also to strengthen horizontal networks among workshop organizers.
\(\boldsymbol{⟦ 7⟧}\) Considering future societal changes such as population decline, particularly in rural areas, re-examining the role of the Evacuation Topography Time Map in communities where the number of potential evacuees may drastically decrease is necessary.
Comments collected through the Evacuation Topography Time Map Initiative also reflect future social and environmental conditions. A review of the casebook published by the NIGECHIZU Research Group 8 reveals that the Evacuation Topography Time Map is often used not only for evacuation planning but also for understanding the local community and addressing a wide range of regional issues.
Although the term Evacuation Topography Time Map intuitively suggests a “map for evacuation,” a deeper examination of its content reveals that it possesses multifaceted utility. Rather than functioning only as a means of escape, it has been employed in various contexts to enhance local knowledge and support community-driven problem-solving efforts.
5.3. Comparison from the Perspectives of “Field,” “Facilitation,” and “Science and Technology”
Based on the framework of “field,” “facilitation,” and “science and technology,” Items ③ and ⑦ are categorized under “field,” Items ②, ⑤, and ⑥ fall under “facilitation,” and Items ① and ④ are classified as “science and technology” (Table 4).
In this case study, several key points were identified from the perspective of the “field,” focusing on how the Evacuation Topography Time Map has been used across various local contexts, as well as how they may be further developed. From the perspective of “facilitation,” the analysis revealed the necessity of strategic program design for effective implementation of the Evacuation Topography Time Map, the difficulties encountered during the design process—such as determining the disaster scenarios and preparing base maps—and the need for initiatives to cultivate capable facilitators. Furthermore, from the perspective of “science and technology,” it was noted that the Evacuation Topography Time Map represents a technology developed in response to local conditions and community voices in disaster-affected areas, and that new possibilities are emerging through collaboration with digital technologies and art-based programs.
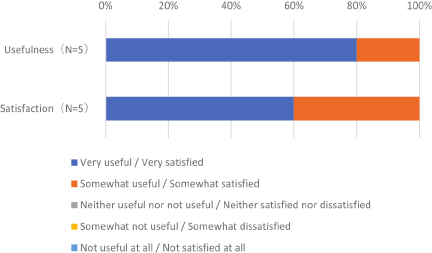
Fig. 8. Evaluation of the proposed process.
6. Evaluation by Interview Participants
An evaluation of the proposed process conducted in this study, as perceived by the interview participants, is presented in Fig. 8. The evaluation focused on the overall usefulness and satisfaction with the proposed process. Notably, although there were seven survey participants, only five responses were collected after the submission deadline.
The results indicated that all respondents rated the components as either “useful” or “somewhat useful,” and reported being “satisfied” or “somewhat satisfied” with the process overall.
Open-ended responses included the following comments from individuals with different perspectives on the ten-year initiative: “It was useful in that it objectively and clearly organized the insights gathered from interviews with seven stakeholders involved in the Evacuation Topography Time Map initiative.” “Through this study, I was able to reflect on my current efforts and future directions. Hearing the results of other participants’ interviews allowed me to take a broader view of the overall initiative.”
The following participant comments suggest that the research process was perceived as meaningful: “It was interesting to compare the results of different analytical methods and to realize that the interpretation of the same content could vary depending on the method used.” “I was satisfied with the way the process made the data visible and integrated through a scientific approach.” “The opportunity to receive explanations during the feedback session was extremely valuable.”
Regarding the quantitative text analysis, participants noted: “By aggregating words, I could grasp which topics were most frequently discussed. However, it was difficult to capture the speaker’s intentions or underlying ideas through word classification alone.” “It became clear that people are engaging with the Evacuation Topography Time Map from a wide variety of perspectives.” Regarding SCAT, one participant commented: “SCAT, which involves reinterpreting and reconstructing interview content, seemed effective in objectively and clearly summarizing multiple statements from multiple participants.”
Quantitative text analysis can handle large volumes of textual data and ensure a high degree of objectivity. However, when the text is divided into morphological units for mining, it may fail to capture the full meaning and context of the original narrative. This limitation was highlighted by the open-ended responses to the questionnaire.
In contrast, SCAT enables the careful interpretation of contextual meaning by explicitly documenting each step of the analytical process. However, it is resource-intensive and suitable only for small-scale data analysis 27,28.
Considering these characteristics, this study employs quantitative text analysis and SCAT in a complementary manner. This combined approach enables a multifaceted understanding of the current status and challenges of the Evacuation Topography Time Map. The insights obtained through this methodological integration constitute a novel contribution.
7. Conclusion
7.1. Key Findings of the Study
Semi-structured interviews were conducted with certified “Level 1 Disaster Evacuation Topography Time Map Specialists,” including the original proponents of the Evacuation Topography Time Map and experienced practitioners and researchers who have been deeply and continuously involved in its development and dissemination. Drawing on the methodological framework of disaster ethnography, this study aimed to capture the opinions of experts from multiple perspectives. A mixed-methods approach was adopted, combining quantitative text analysis with the SCAT qualitative analysis technique. Comparing the results of the two methods helped to identify seven key points concerning the current status and challenges of the Evacuation Topography Time Map. Feedback was provided to all interviewees regarding their findings, and a consensus was reached to enhance the reliability and validity of the results. The appropriateness of the number of participants in qualitative interview studies is often assessed based on the concept of “saturation,” which refers to the point at which no new information emerges as additional participants are included. However, clearly demonstrating the achievement of saturation is not always straightforward, and recent discussions have emphasized the importance of “data adequacy” as a more practical and meaningful criterion 32. We considered data adequacy to be ensured when sufficient reliability and validity were confirmed through feedback from each participant and by examining the composition of the interviewees. Additionally, when participants suggested specific individuals for interview, we incorporated these recommendations and expanded the sample accordingly. Thus, we believe that the number of participants should be determined not solely by numerical criteria, but through a flexible design informed by contextual judgment and feedback obtained during the research process.
7.2. Future Directions and Limitations of the Study
This study aimed to clarify the current state and challenges of the Evacuation Topography Time Map by conducting interviews primarily with experienced individuals, such as workshop organizers. However, the perspectives of general users of the Evacuation Topography Time Map were not sufficiently analyzed.
In future research, interview surveys, questionnaire-based studies, and workshops with beginners, intermediate users, and individuals from diverse backgrounds are expected to reveal the multifaceted value of the Evacuation Topography Time Map. Furthermore, applying the analytical process proposed in this study to other disaster-related programs will enable a clear understanding of their respective characteristics and challenges. Moreover, a comparative analysis across different programs may contribute to improving each initiative and to the exploration of more effective approaches to disaster education.
Acknowledgments
This study was partially supported by the Third Earthquake and Volcano Hazard Observation and Research Program (TYM_02), which aims to contribute to disaster mitigation efforts. The authors express their sincere gratitude to all individuals who provided invaluable cooperation throughout the course of this study.
- [1] Committee on the International Development of Disaster Prevention and Mitigation Policy Utilizing Science and Technology, Science Council of Japan, “Proposal from academia for the realization of a sustainable international society through strengthening disaster resilience,” 2020 (in Japanese). https://www.scj.go.jp/ja/info/kohyo/pdf/kohyo-24-t298-1.pdf [Accessed August 1, 2025]
- [2] Japan Science and Technology Agency Research Institute of Science and Technology for Society (JST-RISTEX) (Ed.), “Guide to social implementation,” Kousakusha, 2019 (in Japanese).
- [3] JST, “Implementation of a life reconstruction support system,” (in Japanese). https://www.jst.go.jp/seika/bt89-90.html [Accessed August 1, 2025]
- [4] Japan Science and Technology Agency Research Institute of Science and Technology for Society (JST-RISTEX), “Promoting intergenerational and regional collaboration through the creation of Evacuation Topography Time Maps for diverse disasters,” (in Japanese). https://www.jst.go.jp/ristex/output/example/needs/02/cr_nigechizu.html [Accessed August 1, 2025]
- [5] NIGECHIZU Project Team, “Creating ‘Evacuation Topography Time Maps’ to save lives from disasters,” Gyosei Corporation, 2019 (in Japanese).
- [6] S. Yamanaka, D. Kobayashi, and N. Mukoyama, “The effectiveness of the tsunami evacuation map by creating ‘NIGECHIZU’.” https://www.isc.meiji.ac.jp/%7Eonepiece/workshop/nan2015/07.pdf [Accessed August 1, 2025]
- [7] T. Yamamoto, K. Homma, and T. Moriwaki, “Making of voluntary evacuation maps from various disasters on hazard map,” J. of Injury and Violence Research, Vol.11, Suppl.2, Article No.162, 2019.
- [8] NIGECHIZU Study Group, “Case studies,” (in Japanese). https://nigechizu.jsurp.jp/case/ [Accessed August 1, 2025]
- [9] M. Inoue and Y. Komatsubara, “Study on the creation and utilization of ‘NIGECHIZU (Evacuation Topography Time Map)’ for various disasters (Part 29): Evaluation of the effectiveness of Nigechizu workshops—A case study of a disaster education program at a junior high school in Tokoname City,” Summaries of Technical Papers of Annual Meeting, Architectural Institute of Japan (Kanto), p. 879, 2024 (in Japanese).
- [10] I. Kinoshita and M. Terada, “Nige-chizu: For safety community by the chrono-evacuation map,” J. of Rural Planning Association, Vol.38, No.4, pp. 440-443, 2020 (in Japanese). https://doi.org/10.2750/arp.38.440
- [11] S. Murakoshi, K. Mitsushita, and M. Koyama, “Is the risk of natural hazards properly understood from hazard maps? An examination of map literacy,” Map, J. of the Japan Cartographers Association, Vol.58, No.4, pp. 1-16, 2020 (in Japanese). https://doi.org/10.11212/jjca.58.4_1
- [12] T. Komura and M. Hirano, “About the map-based training DIG,” Proc. of the Japan Society for Safety Engineering, Vol.7, pp. 136-139, 1997 (in Japanese).
- [13] M. Ushiyama, S. Iwadate, and Y. Ohta, “A trial of community based workshop to explore problems of disaster prevention,” J. of Japan Society for Natural Disaster Science, Vol.28 Issue 2, pp. 113-124, 2009 (in Japanese).
- [14] Y. Yoshida, T. Kimura, Y. Minegishi, and T. Sano, “Tsunami safe town planning with evacuation simulation,” J. Disaster Res., Vol.9, No.sp, pp. 719-729, 2014. https://doi.org/10.20965/jdr.2014.p0719
- [15] D. Shiozaki and Y. Hashimoto, “System development for tsunami evacuation drill using ICT and tsunami inundation simulation data,” J. Disaster Res., Vol.19, No.1, pp. 72-80, 2024. https://doi.org/10.20965/jdr.2024.p0072
- [16] K. Nakahara and M. Hatayama, “A simulation model for resident-led tsunami evacuation planning: Design and feasibility,” Int. J. of Disaster Risk Reduction, Vol.127, Article No.105652, 2025. https://doi.org/10.1016/j.ijdrr.2025.105652
- [17] NIGECHIZU Study Group, “Case study: Zaimokuza and Yuigahama, Kamakura City, Kanagawa Prefecture,” (in Japanese). https://nigechizu.jsurp.jp/case/%E9%8E%8C%E5%80%89%E5%B8%82%E6%9D%90%E6%9C%A8%E5%BA%A7%E3%83%BB%E7%94%B1%E6%AF%94%E3%83%B6%E6%B5%9C%E5%9C%B0%E5%8C%BA/ [Accessed August 1, 2025]
- [18] NIGECHIZU Study Group, “Case study: Asahi Elementary School, Shimoda City, Shizuoka Prefecture,” (in Japanese). https://nigechizu.jsurp.jp/case/%e4%b8%8b%e7%94%b0%e5%b8%82%e7%ab%8b%e6%9c%9d%e6%97%a5%e5%b0%8f%e5%ad%a6%e6%a0%a1%e3%80%80/ [Accessed August 1, 2025]
- [19] NIGECHIZU Study Group, “About the study group,” (in Japanese). https://nigechizu.jsurp.jp/ [Accessed August 1, 2025]
- [20] NIGECHIZU Study Group, “Certification and registration of Certified NIGECHIZU Disaster Prevention Practitioners,” (in Japanese). https://nigechizu.jsurp.jp/nigegrapher/ [Accessed August 1, 2025]
- [21] NIGECHIZU Study Group, “Nigechizu workshop manual for disaster education,” (in Japanese). https://nigechizu.jsurp.jp/manual/nigechizu_manual-education.pdf [Accessed August 1, 2025]
- [22] H. Hayashi and K. Shigekawa, “Producing disaster ethnography for the development of disaster ethnology,” Proc. of the Annual Conf. of the Institute of Social Safety Science, Vol.7, pp. 376-379, 1997 (in Japanese).
- [23] H. Hayashi, K. Shigekawa, and S. Tanaka, “Disaster ethnography as the key to disaster reduction: Hidden words from the Great Hanshin-Awaji Earthquake,” NHK Publishing, 2009 (in Japanese).
- [24] S. Tanaka, H. Hayashi, K. Shigekawa, Y. Urata, and H. Kameda, “Development of standardized procedure for disaster ethnography—Interview, case compilation, coding, and disaster process identification—,” J. of Social Safety Science, Vol.2, pp. 267-276, 2000 (in Japanese). https://doi.org/10.11314/jisss.2.267
- [25] K. Higuchi, “Quantitative text analysis for social research (2nd ed.),” Nakanishiya Shuppan, 2020 (in Japanese).
- [26] K. Higuchi, Y. Nakamura, and K. Shu, “Learn by doing! An introduction to text-mining,” Nakanishiya Shuppan, 2022 (in Japanese).
- [27] T. Otani, “SCAT: A qualitative data analysis method that is explicit, easy to begin, and suitable for small-scale data,” J. of Japan Society of Kansei Engineering, Vol.10, No.3, pp. 155-160, 2011 (in Japanese).
- [28] T. Otani, “Paradigm and design of qualitative study: From research methodology to SCAT,” The University of Nagoya Press, 2019 (in Japanese).
- [29] Y. Komatsubara, H. Hayashi, N. Maki, K. Tamura, G. Urakawa, N. Yoshitomi, M. Inoguchi, and K. Fujiharu, “Visualization business process of damage certificate issuing process from ethnographical interviews,” J. of Social Safety Science, Vol.10, pp. 77-87, 2008 (in Japanese). https://doi.org/10.11314/jisss.10.77
- [30] T. Komura, “Past, present and future of DIG (disaster imagination game),” Proc. of the Annual Conf. of the Institute of Social Safety Science, Vol.34, pp. 77-80, 2014 (in Japanese).
- [31] H. Hayashi, “Seismic disaster reduction science to protect lives,” Iwanami Shoten, 2003 (in Japanese).
- [32] K. Vasileiou, J. Barnett, S. Thorpe, and T. Young, “Characterising and justifying sample size sufficiency in interview-based studies: Systematic analysis of qualitative health research over a 15-year period,” BMC Medical Research Methodology, Vol.18, No.1, Article No.148, 2018. https://doi.org/10.1186/s12874-018-0594-7
This article is published under a Creative Commons Attribution-NoDerivatives 4.0 Internationa License.