Paper:
Spatio-Temporal Dynamics of Collective Disaster Event Cognition in the Digital Sphere: A Long-Term Case Study of the Great East Japan Earthquake (2011–2025)
Ryo Saito*1,†
 , Ryota Takano*2
, Pradytia Putri Pertiwi*3
, Mufidatun Khoiriyah*4
, Akihiro Aotani*5, Hiroyuki Miura*6
, Toshiaki Muramoto*7, and Osamu Murao*7
, Ryota Takano*2
, Pradytia Putri Pertiwi*3
, Mufidatun Khoiriyah*4
, Akihiro Aotani*5, Hiroyuki Miura*6
, Toshiaki Muramoto*7, and Osamu Murao*7
*1Graduate School of Information Sciences, Tohoku University
468-1 Aramaki Aza-Aoba, Aoba-ku, Sendai, Miyagi 980-8572, Japan
†Corresponding author
*2Graduate School of Informatics, Nagoya University
Nagoya, Japan
*3Faculty of Psychology, Gadjah Mada University
Yogyakarta, Indonesia
*4School of Engineering, Tohoku University
Sendai, Japan
*5Hiroshima University of Economics
Hiroshima, Japan
*6Hiroshima University
Higashi-Hiroshima, Japan
*7International Research Institute of Disaster Science, Tohoku University
Sendai, Japan

How does public cognition (e.g., awareness, attention, memory) of a disaster event change over time and become distributed across geographical space after the event occurs? This question addresses the spatio-temporal characteristics of collective disaster event cognition (CDEC). This study focuses on the Great East Japan Earthquake, a catastrophic disaster that struck the coastal region of Japan’s Tohoku area on March 11, 2011, resulting in over 20,000 people dead or missing. Using long-term data from the Google Trends service (supplemented by long-term Wikipedia pageview data), the study investigates the spatio-temporal dynamics of CDEC. Key temporal findings include a seasonal effect, in which Google Trends scores increased during the annual month of remembrance, and a milestone effect, where scores rose relatively higher during major anniversary years, such as the fifth and tenth anniversaries. Additionally, an association effect was observed. For example, attention increased in response to other major earthquakes, such as the 2016 Kumamoto Earthquake and the 2024 Noto Peninsula Earthquake. In the spatial dimension, analyzing the relationship between Google Trends scores and distance from the affected areas revealed a distance decay effect. This effect was more accurately captured by nonlinear models than by linear ones. Finally, this study discusses the theoretical and social implications of these findings and offers perspectives for elucidating the phenomenon of CDEC and informing future disaster risk reduction efforts.
Socio-cognitive model of CDEC
1. Introduction
“Disasters strike when they are forgotten.”
(Torahiko Terada, 1878–1935)(1)
This quote, spoken nearly a century ago by a Japanese physicist, highlights how easily people’s awareness, attention, and memory of disasters can fade. After a disaster, how do public awareness, interest, and memory decline over time? How does cognition of the disaster itself differ across regions? Furthermore, what patterns emerge when temporal and spatial aspects of cognition are considered together? These interrelated questions highlight the core issue of the spatio-temporal nature of disaster event cognition 3,4.
Since the time of Dr. Terada, about a century has passed. Today, computers and the Internet have developed to the point where human behavior now extends into the digital sphere. We engage in cognition and even act in digital spaces. For example, this can be observed in environments such as the metaverse. As the GPS technology in physical space is now used to better understand human cognition and behavior, various technologies in the digital realm are being employed to investigate and interpret how we think and act.
In physical space, GPS technology allows us to visualize when, where, and how densely people gather, as well as how they move across space and time. Such GPS data enable us to infer patterns of human cognition. Similarly, technologies in the digital sphere record and visualize people’s behaviors as data. Moreover, these digital traces enable us to estimate people’s cognitive states. A prominent example is Google Trends, which provides indicators of people’s search behaviors that can be used to infer their levels of cognition, such as interest, attention, and memory 5,6,7.
1.1. Google Trends Service
Google Trends provides users with data that reflect changes in the search volume of specific queries over a defined period. These changes are expressed as relative values on a scale from 0 to 100 8. The two primary parameters that users can configure are the temporal window and the geographical window. The temporal window covers the period from 2004 to the present. Depending on the selected range, the data can be retrieved at different levels of resolution, such as by minute or by month. The geographical window includes options ranging from global scale to specific countries, regions within countries, and even localized areas. Users can also set additional parameters, such as one of 26 search categories, including “All categories,” or the type of search platform. Available platforms include web search, image search, news search, Google Shopping, and YouTube search. In addition to search scores, Google Trends provides information on related topics and associated keywords for each query.
To date, scores obtained from Google Trends have been used across a wide range of fields, most notably medicine 9,10,11 and economics 12,13,14. Although several methodological limitations have been identified 15,16,17,18, Google Trends scores (GTS) have been used as a tool to describe and predict social phenomena. They have contributed to the accumulation of knowledge to understand and explain our society 5,6,7. In this study, we used GTS to examine the spatio-temporal aspects of disaster event cognition, as outlined at the beginning of this paper.
In previous studies, the scores obtained from Google Trends service have been interpreted as reflecting various aspects of human cognition. These include interest 19, memory 19,20,21, awareness 22,23,24, and in some cases, understanding 25. However, determining which of these terms is the most appropriate lies beyond the scope of this study. In this research, the term “cognition” is adopted as the most inclusive concept among those used in prior work. Specifically, we interpreted GTS as indicators of cognitive responses to disaster events, including interest, memory, attention, and awareness.
The data obtained in this study reflect both micro-level individual behaviors and macro-level collective behaviors. Discussions on collective human cognition are closely related not only to the concept of collective memory 26,27, but also to emerging ideas such as collective attention 28,29 and collective consciousness 30,31. While there may be room to question whether what is captured by GTS primarily reflects individual- or collective-level cognition, we deliberately avoided pursuing this distinction too assertively in the present study. Instead, for reasons outlined below, we interpreted GTS as an indicator of collective cognition.
Indicators based on digital logs, including those provided by Google Trends, are understood not so much as aggregates of independent individual data, but rather as reflections of macro-level phenomena that emerge through interactions among individuals 32,33. In fact, trends represented by services such as Google Trends often arise through processes of social interaction. Individuals may begin searching for information after being exposed to external sources such as news articles or media reports. These search behaviors can influence others, whose actions in turn affect still others, creating a chain of mutual influence. Based on this understanding, this study focuses on collective event cognition, specifically how people, as a group, come to hold or activate cognition in response to an event. In this study, we define collective disaster event cognition (CDEC) as the shared or collective cognition of a disaster event, encompassing psychological components such as attention, memory, and awareness. The term disaster event refers not only to natural hazards (e.g., earthquakes, tsunamis, floods, typhoons, and hurricanes) but also to human-induced disasters (e.g., terrorist attacks, nuclear accidents, wars, and industrial disasters). To describe this concept throughout the paper, we use the term CDEC.
1.2. Previous Studies
Previous studies using Google Trends in the context of disasters can be broadly classified into two categories. One category focuses on disasters in general 34,35,36, whereas the other addresses human cognition related to specific disaster events 37,38. Studies in the first category typically use generic disaster-related keywords, such as “earthquake,” “tsunami,” or “typhoon,” as search queries. In contrast, the second category involves studies that use the names of specific disaster events as search queries. The present study focuses on the latter category, which is more directly related to the CDEC. This section reviews relevant prior work in this area.
Yeo and Knox investigated changes in the CDEC using Google Trends 37. They analyzed the GTS for the 2016 Louisiana Flood over a 15-day period, using a daily time frame. The first day in this 15-day frame was defined as the date when the flood was officially recorded. In addition to the Louisiana Flood, the study included several comparative cases: the 2015 Texas–Oklahoma Flood, the 2013 Colorado Flood, Hurricane Sandy in 2012, and Hurricane Katrina in 2005. The analysis revealed that the GTS for the Louisiana Flood peaked on the first day, whereas for the other events, the peak occurred later, typically around the third or fourth day. The authors attributed this difference to variations in how state governments responded, particularly when issuing emergency declarations. Moreover, the analysis revealed that, in the case of the Louisiana Flood, the GTS remained above 90 for four days following the peak, but decreased to 23 by the end of the observation period. In contrast, for Hurricane Katrina, the GTS remained relatively stable at approximately 60 throughout the entire observation period, even after reaching its highest value. These findings suggest that both the rise and persistence of CDEC may be influenced by characteristics of the disaster event itself. These characteristics include factors such as the physical power of the hazard and the scale of economic and human damage ultimately caused.
Silver and Jackson examined CDEC for two events using Google Trends 38. Their dataset comprised GTS data for Hurricanes Florence and Michael, covering the period from September 1 to October 25, 2018, spanning approximately two months. The analysis revealed a clear contrast between the two events. Hurricane Florence maintained a high GTS over a longer duration, whereas Hurricane Michael demonstrated a sharp increase to its peak, followed by a rapid decline. The authors interpreted this difference as reflecting a characteristic of disaster events. These studies have certainly specifically the duration over which each event unfolded.
As demonstrated by previous studies, such as Yeo and Knox and Silver and Jackson, GTS has been used as an indicator of CDEC 37,38. Reviewing these studies revealed variations in the observation periods used to capture CDEC. In previous studies 37,38, these periods ranged from several weeks, as in Yeo and Knox, to several months, as in Silver and Jackson. These studies have certainly succeeded in illustrating the short-term volatility of CDEC, particularly its rapid rise and subsequent decline following disaster events. However, the present study focuses on CDEC, which extends beyond a span of weeks or months. We aim to explore the patterns in which CDEC rises or declines again over the course of a year, several years, or even decades.
For example, in many cases, memorial ceremonies are held during the anniversary month or milestone year following various disasters. Although there are only a few examples, cases of man-made disasters include the September 11 attacks in 2001 and the Manchester Arena bombing on May 22, 2017. Examples of natural disasters include the Great East Japan Earthquake on March 11, 2011, and the Indian Ocean tsunami on December 26, 2004. After such tragic events, people often conduct commemorative acts annually on the same date or month, and sometimes even at the exact time of the event. Moreover, these ceremonies tend to occur on milestone occasions, such as the 10th or 20th anniversary. Such practices suggest that the CDEC may increase again over time. In the case of the Great East Japan Earthquake, for instance, especially in areas that experienced severe damage, people hold memorial services at 2:46 p.m. on March 11, the exact time when the disaster occurred. One of the most common commemorative practices is a one-minute silent prayer, known in Japanese as mokutou (黙祷). In heavily affected areas, people pause their work, stand still, and collectively experience a moment that feels as though time itself has stopped. These acts have continued even more than ten years after the disaster. However, it is important to note that even within Japan, such commemorative behaviors are rarely observed in areas that were not directly affected or where the damage was minimal. This suggests that the re-emergence of CDEC is also limited in these areas. Japan stretches northeast to southwest. While it takes approximately two and a half hours to travel from Tokyo to Sendai by bullet train, it takes approximately four hours to reach Kyoto. At the time of the Great East Japan Earthquake, Tokyo experienced a seismic intensity of 5-lower on the Japanese scale, whereas Kyoto recorded 3-lower. In comparison, Sendai experienced 6-lower. Generally, official memorial events for the Great East Japan Earthquake are rarely held in Tokyo or Kyoto.
Although previous studies have examined short-term CDEC 37,38, long-term CDEC has received little attention, particularly with respect to the temporal patterns described above. Prior research has not addressed the potential influence of long-term seasonal effects or milestone effects that may emerge over extended periods. Clarifying these effects is essential for understanding how CDEC is sustained and expressed over time. Accordingly, the primary aim of the present study is to examine the temporal dynamics of long-term CDEC. In addition, long-term CDEC may involve associative recall, whereby past disasters are reactivated when similar large-scale events occur. For example, reports following the January 1, 2024 Noto Peninsula Earthquake in Japan indicated renewed public awareness of the Great East Japan Earthquake. On this basis, the present study also investigates potential association effects as part of a broader analysis of long-term temporal influences on CDEC.
In addition to the temporal dimension, the spatial dynamics of CDEC, particularly the potential decay effect across geographical distances, have not been sufficiently explored in the context of specific disaster events. Although several studies have addressed this phenomenon in relation to general disaster-related terms such as “earthquake,” “tsunami,” or “typhoon” 34,39,40,41, studies specifically examining the geographical distribution of cognition concerning particular disaster events remain limited. Although the primary focus of this study is on the temporal dimension of long-term CDEC, it also aims to investigate how CDEC related to a specific disaster event evolves across geographical space. This study seeks to provide new insights into the spatial characteristics of the CDEC and the effects of geographical distance on collective disaster cognition.
1.3. Framework and Purpose of the Study
This study focuses on the Great East Japan Earthquake as a case for examining the long-term spatio-temporal dynamics of the CDEC. The disaster is considered appropriate for analysis, as it is one of the most devastating events in recent history, both in Japan and globally. The Great East Japan Earthquake resulted in 19,775 confirmed deaths, including disaster-related fatalities, and 2,550 people were reported as missing. A large number of precious lives were lost 42. Additionally, the name of one of the major cities affected by this disaster is included in the Sendai Framework for Disaster Risk Reduction (2015–2030), which outlines global disaster risk goals 43. Even today, nearly 15 years after the disaster, memorial activities and ceremonies continue, particularly in the regions that were severely affected. Given this context, the present study determines that selecting the Great East Japan Earthquake as a representative disaster event is both appropriate and meaningful.
The first purpose of this study is to clarify the spatio-temporal dynamics of the CDEC related to the Great East Japan Earthquake using GTS data. Regarding temporal effects, this study aims to identify three main patterns: the seasonal effect, in which the GTS peaks in March each year; the milestone effect, in which the GTS increases during notable anniversary years, such as the tenth year; and the association effect, in which the GTS rises following other disasters that evoke memories of the Great East Japan Earthquake. The second purpose of this study is to examine the spatial aspects of CDEC. Specifically, it investigates the distance decay effect of the CDEC by analyzing its relationship with the geographical distance from Sendai City Hall to each prefectural government office across Japan.
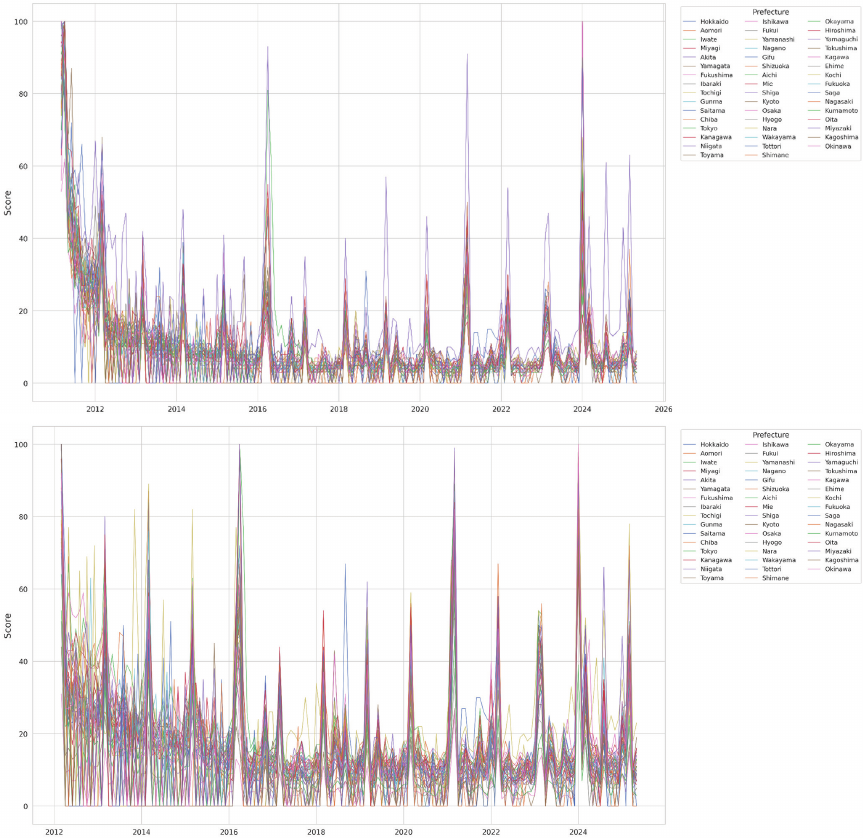
Note. Top: Dataset I (March 11, 2011–May 31, 2025). Bottom: Dataset II (March 1, 2012–May 31, 2025). The same applies to the other figures.
Fig. 1. Temporal trends of GTS by prefecture.
Note. The top figure presents data for 2011–2025, and the bottom figure for 2012–2025.
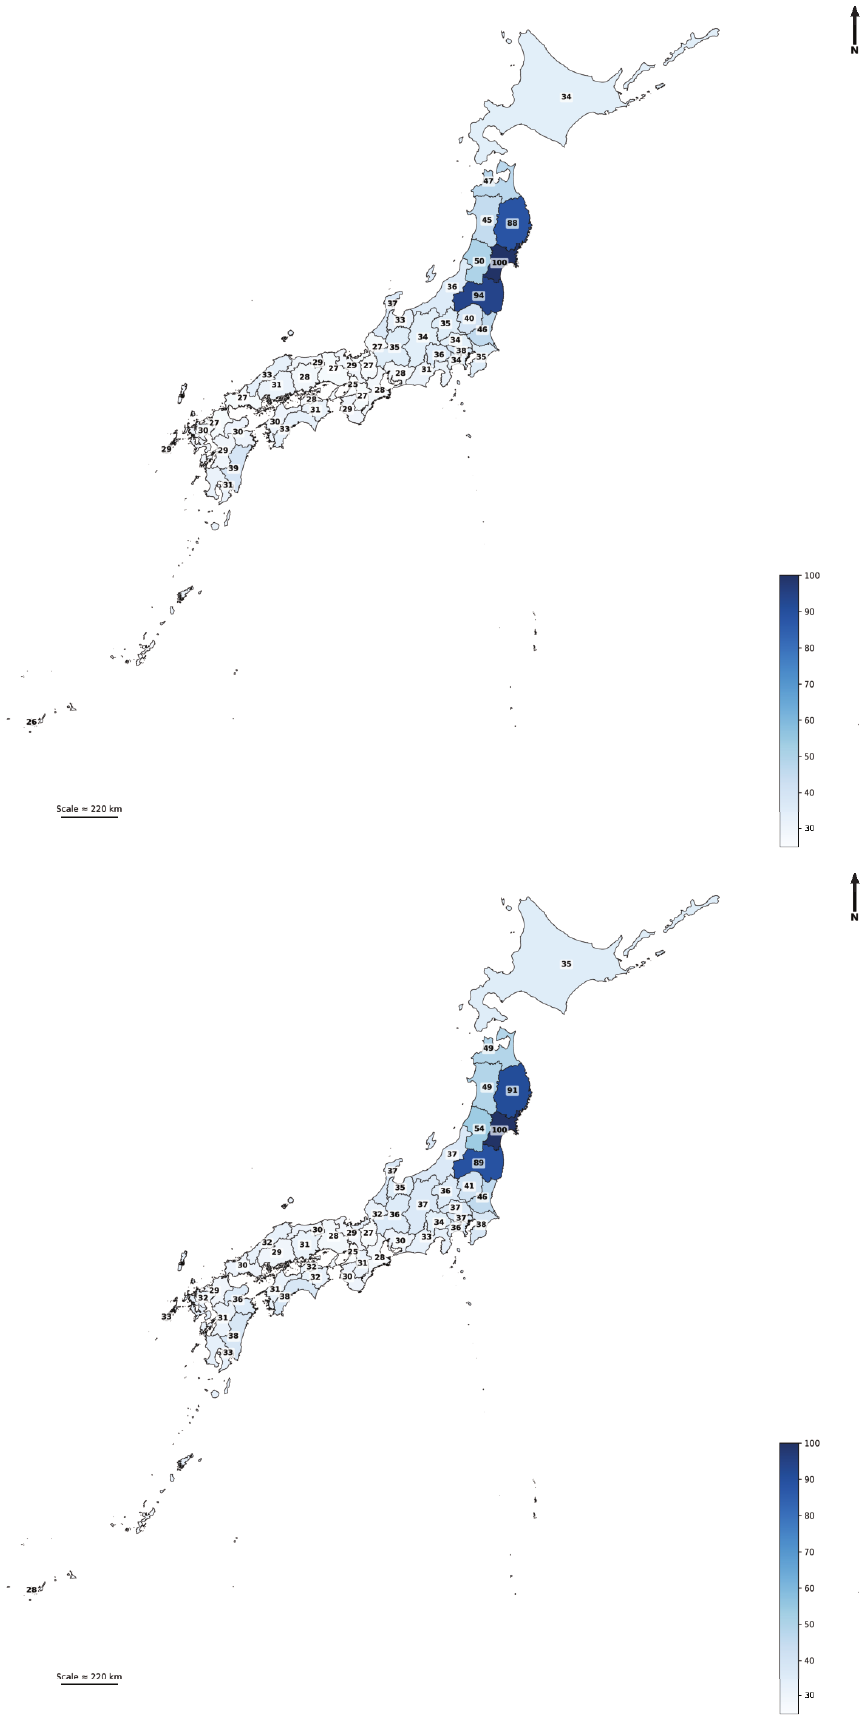
Fig. 2. Geographical distribution of GTS.
2. Methods
The search query “東日本大震災” (The Great East Japan Earthquake, entered in Japanese kanji and enclosed in double quotation marks) was used in Google Trends. The time period was set from March 11, 2011, to May 31, 2025, and GTS data were collected for all 47 prefectures in Japan (Fig. 1). The retrieved data consisted of the monthly GTS values, totaling 170 months. In addition, for the same time period (March 11, 2011, to May 31, 2025), the GTS values for each prefecture as a whole were also collected (Fig. 2).
Since GTS is a relative measure, a high score at a specific observation point can influence the scores at other points. In the present dataset, the GTS values for March 2011 and the months immediately following are extremely high owing to the occurrence of the Great East Japan Earthquake. To address this, an additional dataset was obtained that excludes the approximately one-year period following the disaster, specifically from March 2012 to May 2025. Thus, in addition to the dataset covering the full period from March 11, 2011, to May 31, 2025, a separate dataset was collected for the period from March 1, 2012, to May 31, 2025. This approach makes it possible to analyze the GTS trends while controlling for immediate post-disaster effects. Accordingly, in this study, the full-period dataset (March 11, 2011, to May 31, 2025) is referred to as Dataset I, and the adjusted dataset (March 1, 2012, to May 31, 2025) is referred to as Dataset II. All data were collected in July 2025.
For both datasets, time-series data for all 47 prefectures were used to calculate the basic monthly statistics of the GTS, including the mean, standard deviation, and standard error. These statistics were employed to explain the temporal effects observed in the data. In addition to the analysis of the GTS, geographical distance was calculated to examine the distance decay effect, which refers to the tendency of the CDEC to be lower in areas that are geographically farther from the disaster epicenter. Sendai was selected as the reference point to define the geographical distance. Sendai represents one of the most heavily affected cities and is also the namesake of the Sendai Framework for Disaster Risk Reduction 2015–2030 43. Sendai City Hall was used as the reference location. From this point, straight-line distances to each prefectural government offices in Japan(2) were calculated and used as geographic variables. Specifically, the latitude and longitude coordinates were obtained for Sendai City Hall and each prefectural office. Distances were calculated using the Haversine formula.
Examining the relationship between this geographical distance variable and the GTS values for each prefecture enabled us to assess the presence of a distance decay effect. Specifically, a negative correlation between the two variables provides evidence to support this effect. To investigate this relationship further, both linear and nonlinear models were tested. This decision was based on prior psychological research suggesting that human cognition may follow nonlinear patterns 44,45,46,47,48,49,50,51. Similar discussions on nonlinear behavior have been found in sociology and economics, particularly in studies on collective human behavior 52,53,54. Although the approach in this study was exploratory, three types of nonlinear models were tested: an exponential model (Eqs. \(\eqref{eq:1}\) and \(\eqref{eq:1U0027}\)), a logarithmic model (Eq. \(\eqref{eq:2}\)), and a power-law model (Eq. \(\eqref{eq:3}\)).
In each of the following equations, \(S\) represents the GTS for each prefecture, and \(d\) denotes the distance from Sendai City Hall to the respective prefectural government office. The coefficient \(a\) is a scaling factor, and \(b\) represents either the rate of change or the slope (exponent), depending on the model. Both \(a\) and \(b\) are constants estimated through regression analysis using the respective dataset. Here, \(e\) refers to the base of the natural logarithm, known as Euler’s number. In the case of the exponential model (Eq. \(\eqref{eq:1}\)), parameter estimation did not converge. Therefore, an alternative form (Eq. \(\eqref{eq:1U0027}\)) was used instead. To evaluate the goodness of fit for each model, the following indices were calculated: mean squared error (MSE), coefficient of determination (\(R^2\)), Akaike information criterion (AIC), and Bayesian information criterion (BIC). A lower MSE indicates better fit, an \(R^2\) value closer to 1 indicates stronger explanatory power, and smaller values of AIC and BIC indicate better model performance. Notably, for models in which variables include zero values, the equations are not applicable. This specifically concerns Miyagi Prefecture, where the distance from Sendai City Hall to itself is zero. Therefore, Miyagi Prefecture was excluded from the model analysis. The four models examined in this study are presented below:
In addition to GTS, this study used data from Wikipedia page views (WPV) 55. Unlike GTS, which provides relative scores, WPV data are presented as absolute values. Thus, page views are reported as data. This absolute metric was used to support and strengthen the findings obtained from the time-series analysis based on the GTS. Although a limitation of WPV data is that they are only available from July 2016 onward, the decision to use them was made recognizing the unique advantage of having absolute values. To align with the GTS endpoint, the WPV dataset used in this study covered the period from July 1, 2016, to May 31, 2025 56. Similar to the GTS, the WPV data were collected in July 2025.
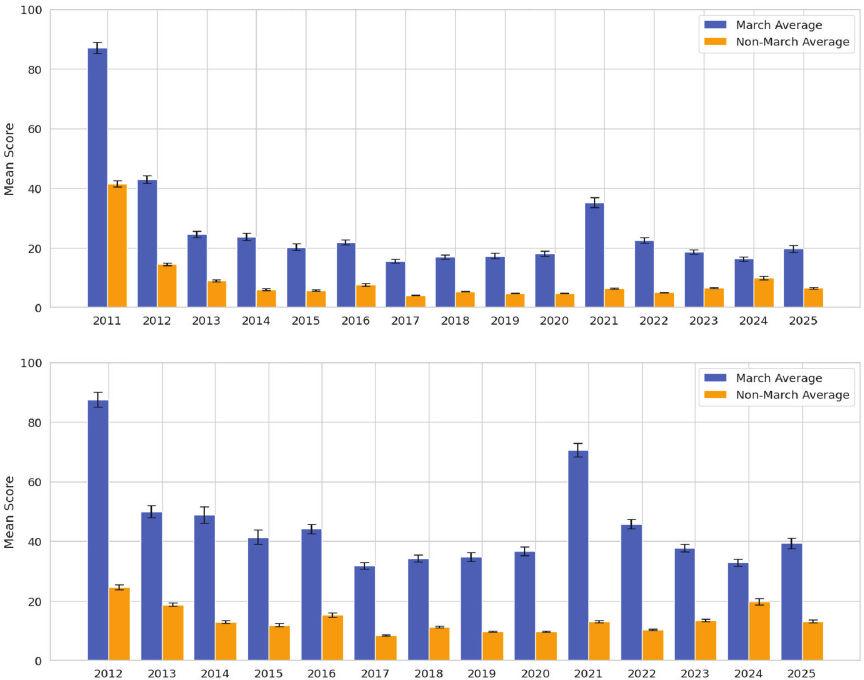
Note. The mean and standard error of GTS were calculated for all prefectures. The top figure presents data for 2011–2025, and the bottom figure for 2012–2025.
Fig. 3. Comparison of GTS between the memorial month (March) and non-memorial months (mean and standard error).
3. Results
3.1. Temporal Trends of GTS by Prefecture
The temporal trends of GTS by prefecture are presented in Fig. 1.
3.2. Seasonal Effects
To examine whether there was a significant difference in the scores between the anniversary month (March) and other months in Dataset I (2011–2025), Welch’s \(t\)-test was conducted (Fig. 3). The results revealed that the scores during the anniversary month (\(M=26.71\), \(\textit{SD}=19.25\)) were significantly higher than those in the other months (\(M=8.85\), \(\textit{SD}=11.74\)), \(t(755.193)=24.21\), \(p<.001\), \(d=1.12\), 95% CI \([1.02,1.22]\).
Welch’s \(t\)-test was also conducted on Dataset II (2012–2025) to examine whether there was a significant difference in the scores between the anniversary month (March) and other months (Fig. 3). The results revealed that scores during the anniversary month (\(M=45.40\), \(\textit{SD}=19.54\)) were significantly higher than those in the other months (\(M=13.60\), \(\textit{SD}=12.16\)), \(t(706.981)=40.98\), \(p<.001\), \(d=1.95\), 95% CI \([1.82,2.08]\).
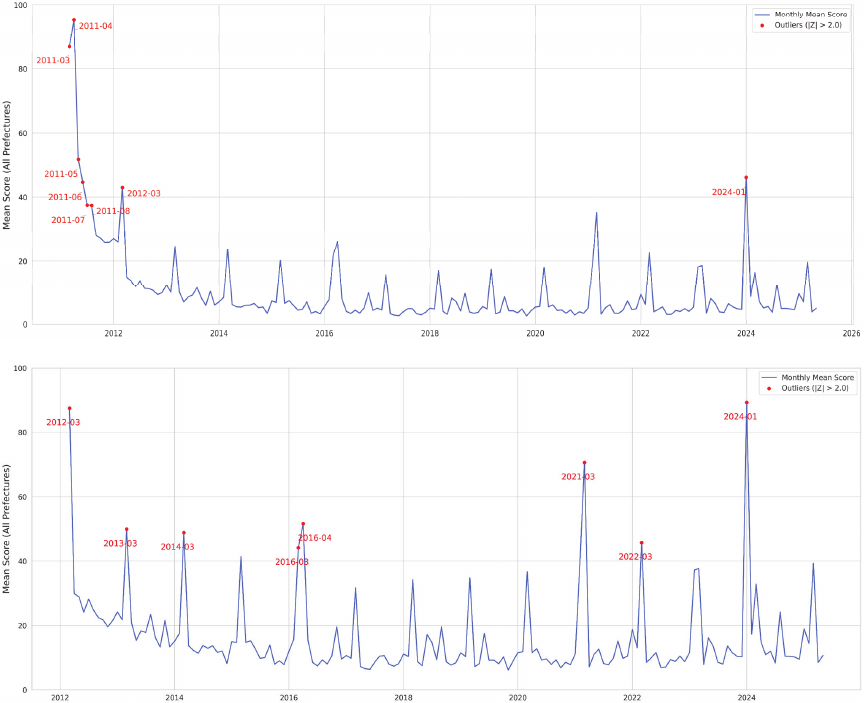
Note. Anomalies were defined as data points with Z-scores greater than or equal to 2.0. The top figure presents data for 2011–2025, and the bottom figure for 2012–2025.
Fig. 4. Anomaly detection in the time-series data of GTS.
3.3. Milestone and Association Effects
Anomaly detection was performed on the GTS time-series data using Z-scores. A Z-score is calculated by subtracting the overall mean from each monthly score and dividing the result by the overall standard deviation, which represents the number of standard deviations by which a given value deviates from the mean. A Z-score exceeding 2.0 was defined as an anomaly (highlighted in red), and the monthly page views were visualized accordingly (Fig. 4). As a result, in Dataset I (from 2011), anomalies were detected in March–August 2011, March 2012, and January 2024. In Dataset II (from 2012), anomalies were detected in March 2012, March 2013, March 2014, March 2016, April 2016, March 2021, March 2022, and January 2024.
3.4. Spatio-Geographic Distance Decay Effects
Figure 5 shows a scatter plot of GTS and distance from Sendai City Hall to each prefectural government office, with various models (linear, exponential, logarithmic, and power law). Correlation analysis was conducted to examine the relationship between the geographical distance from Sendai City Hall to each prefectural government office and the GTS. In Dataset I, the correlation coefficient was \(r=-0.533\) (\(p=.001\)), and in Dataset II, it was \(r=-0.528\) (\(p=.001\)), indicating a negative correlation between the two variables. The relationship between the GTS and geographical distance was modeled using a linear model and three types of nonlinear models: exponential, logarithmic, and power-law (Table 1). For both datasets, the linear model demonstrated the poorest fit (Dataset I: \({R}^2=.25\), AIC \(=358.66\), BIC \(=362.32\); Dataset II: \(R^2=.25\), AIC \(=356.00\), BIC \(=359.65\)), whereas the power law model exhibited the best fit (Dataset I: \(R^2=.51\), AIC \(=339.41\), BIC \(=343.07\); Dataset II: \(R^2=.51\), AIC \(=336.09\), BIC \(=339.75\)).
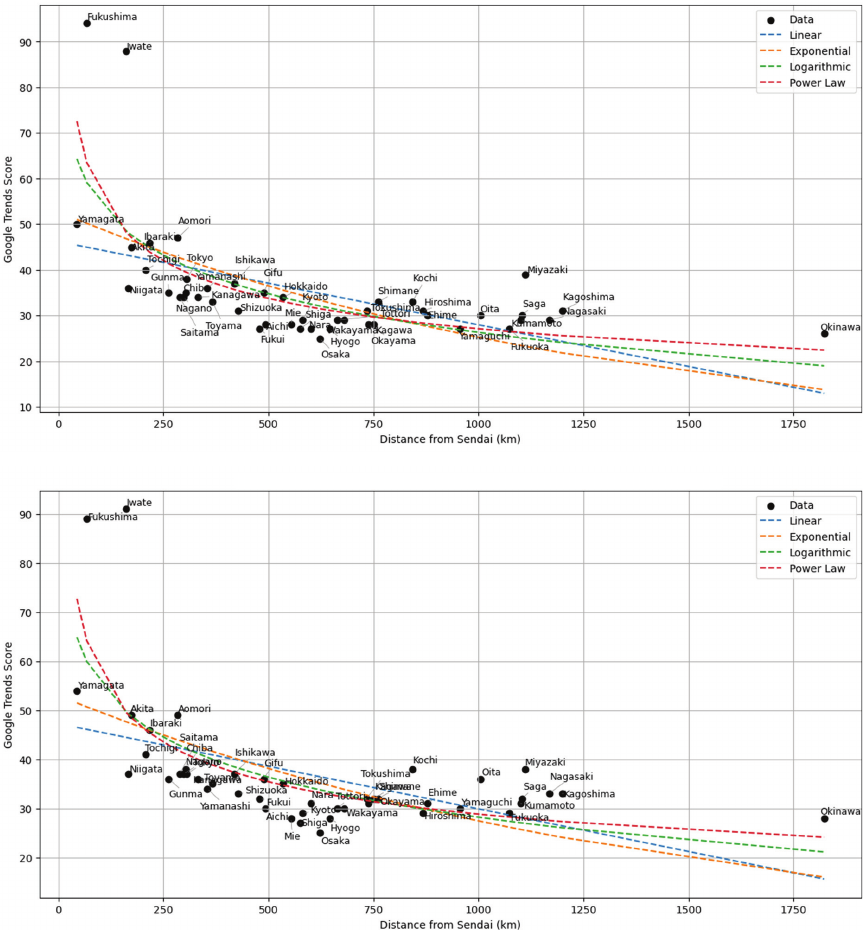
Note. The top figure presents data for 2011–2025, and the bottom figure for 2012–2025.
Fig. 5. Scatter plot of GTS and distance from Sendai City Hall to each prefectural government office, with various models (linear, exponential, logarithmic, and power law).
3.5. Supplementary Analysis
To supplement the main findings, WPV data were analyzed for temporal trends (Fig. 6(A)). Consistent with the previous results, both seasonal effects (Fig. 6(B)) and milestone and association effects (Fig. 6(C)) were observed.
To examine the seasonal effect, Welch’s \(t\)-test was conducted to compare the WPV in the anniversary month (March) with other months (Fig. 6(B)).
The results revealed a statistically significant difference, with WPV during the anniversary month (\(M=536,644.10\), \(\textit{SD}=183,589.24\)) was higher than that during the other months (\(M=131,147.96\), \(\textit{SD}=105,000.76\)), \(t(9.548)=6.88\), \(p<.001\), \(d=2.71\), 95% CI \([1.34,4.06]\).
Anomaly detection was performed on the WPV time-series data using Z-scores. Monthly page views were visualized based on the following criteria: Z-scores greater than 2.0 were defined as anomalies (yellow), greater than 3.0 as high anomalies (red), and greater than 4.0 as extreme anomalies (purple) (Fig. 6(C)). As a result, anomalies were detected in March 2016, April 2016, March 2017, March 2018, March 2019, March 2020, February 2021, March 2021, March 2022, and January 2024. Of these, March 2016, April 2016, March 2019, March 2020, and February 2021 were classified as high anomalies (Z \(>3.0\) but \(\le 4.0\)), and March 2021 was classified as an extreme anomaly (Z \(>4.0\)).
4. Discussion
The purpose of this study was to examine the spatio-temporal dynamics of CDEC related to the Great East Japan Earthquake, using GTS data from March 11, 2011, to May 31, 2025, as well as from March 1, 2012, to May 31, 2025, for a subset analysis. Using the GTS, we analyzed the temporal effects of CDEC, including seasonal, milestone, and association effects. We also investigated the spatial effects of CDEC, with particular focus on the distance decay effect. In addition, WPV data were analyzed to support and reinforce the examination of temporal effects.
4.1. Temporal Effects
This study confirmed the presence of all three temporal effects: the seasonal effect, the milestone effect, and the association effect. Regarding the seasonal effect, in both GTS datasets (2011–2025 and 2012–2025), the scores during the anniversary month (March) were statistically higher than those in the other months, demonstrating a consistent seasonal trend (Fig. 3). This finding was also supported by the corresponding analysis of WPV (Fig. 6(B)). In the case of GTS, the scores during March were approximately three times higher than those of the other months, whereas for WPV, the difference was approximately fourfold. Considered together, these results suggest that the CDEC during the anniversary month was three to four times greater than that in other months. This study empirically confirmed that public cognition of a disaster increases at the macro level during the month in which the disaster occurs.
Table 1. Model comparison.

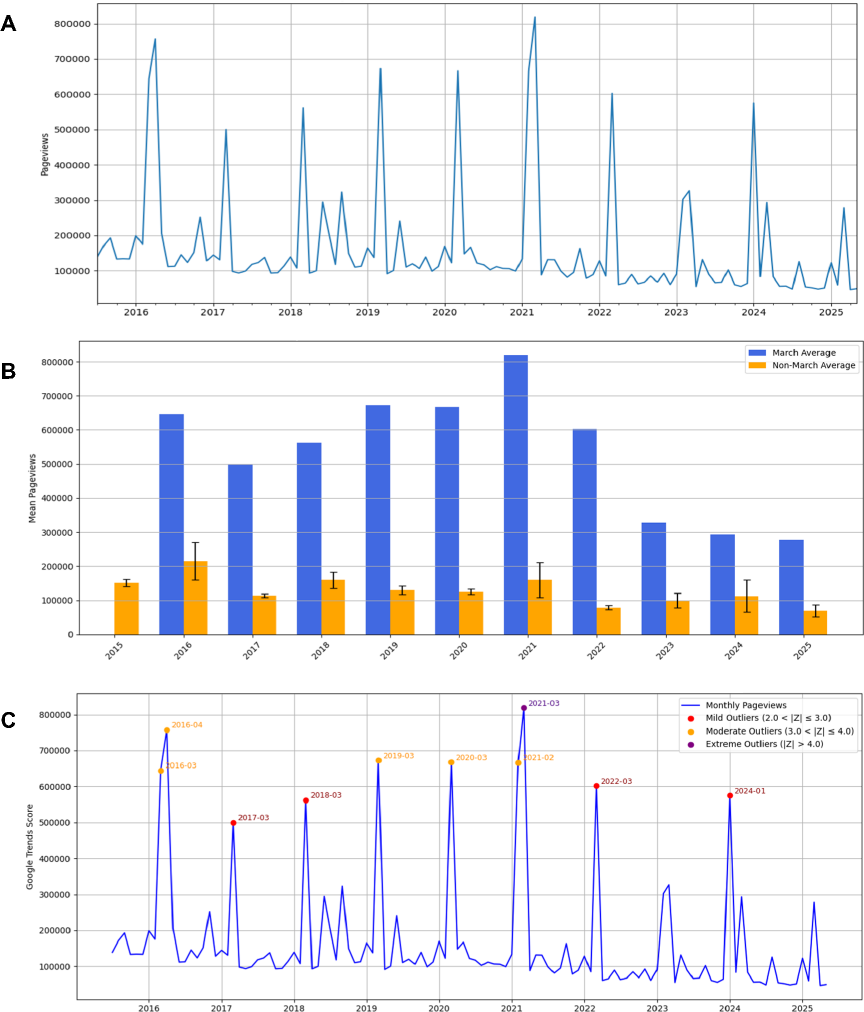
Note. The scores were color-coded based on their Z-scores as indicators of deviation: red for Z \(\ge 2.0\), yellow for Z \(\ge 3.0\), and purple for Z \(\ge 4.0\).
Fig. 6. WPV data: (A) basic data, (B) WPV values, means, and standard errors for the memorial month (March) and non-memorial months by year, and (C) results of anomaly detection.
Next, regarding the milestone effect, although differences were observed between the two GTS datasets, this effect was confirmed in both cases (Fig. 4). When focusing on the anniversary month (March), Dataset I identified March 2012, marking one year since the disaster, as an anomaly. In Dataset II, anomalies were detected in March 2012, March 2013, March 2014, March 2016, March 2021, and March 2022, which correspond to the one-, two-, three-, five-, ten-, and eleven-year milestones.
In addition, when applying a stepwise threshold for anomaly detection using WPV (Fig. 6(C)), Z-scores above 2.0 were classified as small, above 3.0 as medium, and above 4.0 as large. Based on these criteria, anomalies were observed in March 2016, April 2016, March 2017, March 2018, March 2019, March 2020, February 2021, March 2021, March 2022, and January 2024. Among these, March 2016, April 2016, March 2019, March 2020, and February 2021 were medium anomalies (Z \(>3.0\) and \(\le 4.0\)), and March 2021 was identified as a large anomaly (Z \(>4.0\)).
Table 2. Types of spatio-temporal effects in CDEC.

Notably, the largest anomaly in WPV appeared in March 2021, which marked the tenth anniversary of the disaster. This provides clear evidence of the milestone effect. The same effect was also evident in March 2016, the fifth anniversary. Moreover, the medium anomalies observed in March 2019 and March 2020 suggest that the CDEC declined after the fifth anniversary in 2016, but gradually increased again as the tenth anniversary approached. This indicates long-term fluctuations in CDEC. Notably, a medium anomaly was detected in February 2021, the month preceding the tenth anniversary. This finding suggests a secondary aspect of the milestone effect, namely, a preparatory increase in CDEC prior to the milestone itself. If the increase in March 2021 is considered a direct effect of the milestone, then the increase in February 2021 can be interpreted as an indirect effect.
However, it should be noted that the earthquake off the coast of Fukushima in February 2021 57, although it did not result in major damage, may have contributed to the increase in the GTS during that period. This suggests a possible compounding influence on CDEC. In this study, the indirect effect observed as part of the milestone effect is tentatively proposed as a distinctive hypothesis. However, this should be further examined and empirically validated in future research.
Furthermore, regarding the association effect, GTS data from Dataset II (2012–2025) identified January 2024 as an anomaly. This result is likely due to an increase in the CDEC in response to the 2024 Noto Peninsula Earthquake. Similarly, in the case of WPV (Fig. 6(C)), anomalies were detected in April 2016 and January 2024. Similar to the GTS data, the anomaly in January 2024 appears to reflect a response to the 2024 Noto Peninsula Earthquake, whereas the anomaly in April 2016 can be interpreted as a reaction to the Kumamoto Earthquake. These findings confirm the presence of the association effect. Since the Great East Japan Earthquake, several major earthquakes have occurred in Japan. Both the Kumamoto Earthquake and the 2024 Noto Peninsula Earthquake caused significant damage. The Kumamoto Earthquake resulted in the deaths of 278 people, including disaster-related deaths, and the 2024 Noto Peninsula Earthquake resulted in 616 deaths, also including disaster-related deaths 58,59. These numbers are large compared with other disasters that occurred in Japan after the Great East Japan Earthquake. While it is essential to acknowledge that even a single fatality constitutes a disaster and is a source of grief, and thus cannot be easily compared, it is worth noting that, for example, the 2018 Northern Osaka Earthquake resulted in six fatalities 60. Considered together, these findings indicate that when a major disaster occurs, public cognition of past disasters also resurfaces. This result confirms the occurrence of an association effect.

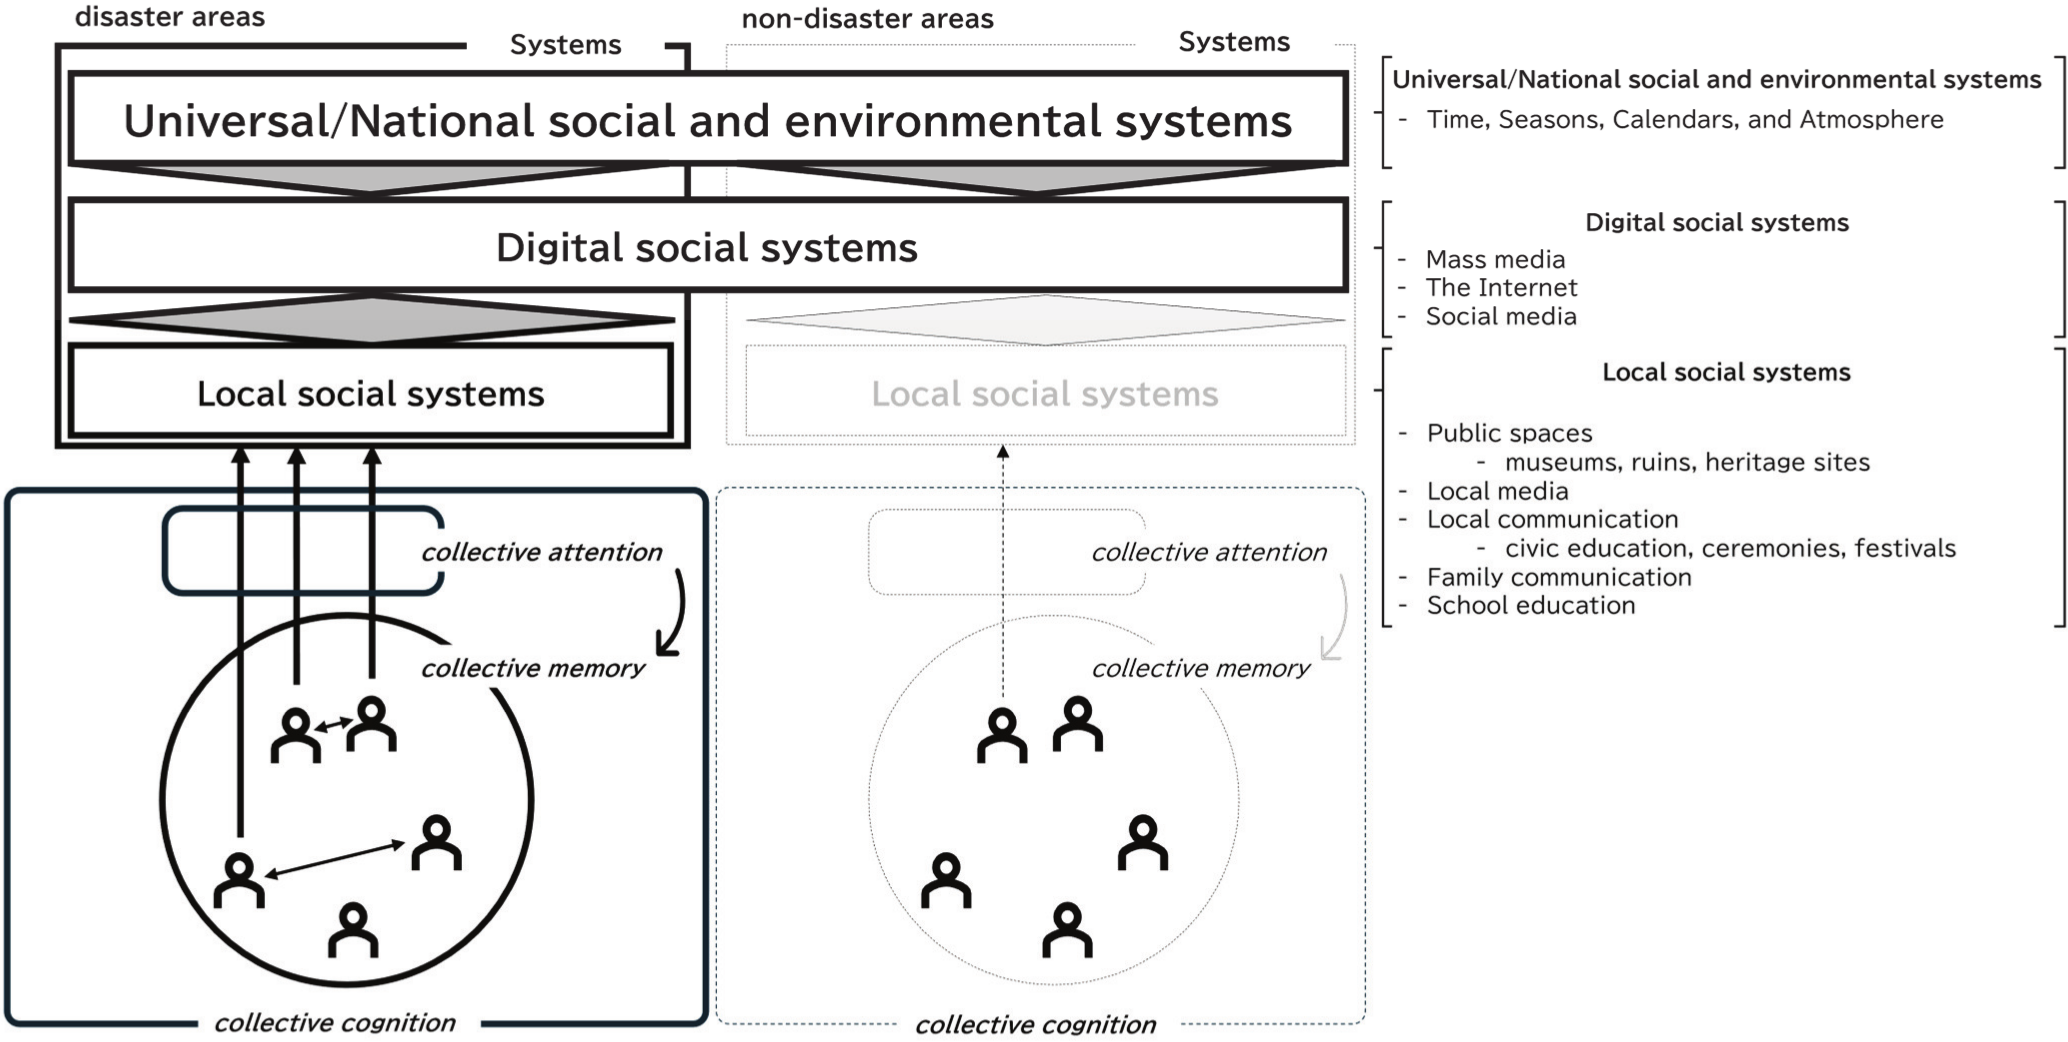
Note. The model, described in detail in the main text, conceptualizes CDEC and illustrates how collective attention and collective memory emerge through interactions among three socio-environmental system layers: universal/national, digital, and local, across both disaster and non-disaster contexts. The arrows represent bidirectional feedback processes between attention and memory, indicating how collective cognition is formed and sustained.
Fig. 7. Socio-cognitive model of CDEC.
4.2. Spatio-Geographic Distance Decay Effects
To examine the spatial effect, a correlation analysis was first conducted. The results indicated negative correlations in both cases (Dataset I: \(r=-0.533\); Dataset II: \(r=-0.528\)), suggesting an inverse relationship between geographical distance from the affected area and the level of CDEC. In other words, the CDEC tended to be higher in regions closer to the disaster site and lower in more distant regions.
Subsequently, model fitting was examined to determine whether the spatial relationship could be better explained using a linear or a nonlinear model. The results indicated that the nonlinear model provided a better fit than the linear model. Among the nonlinear models, the power-law model demonstrated the best fit. From a parsimonious perspective, the superior nonlinear fit suggests that the CDEC decreased sharply within a relatively short distance from the disaster area and then declined more gradually over longer distances. The steep decline in CDEC suggests that beyond a certain threshold distance, the level of CDEC tends to converge and remains relatively similar across more distant regions. As discussed in Section 4.4, one of the key challenges for disaster risk reduction in Japan and globally is how to mitigate this spatial decline in CDEC.
Although the power-law model provided the best fit among the nonlinear models (exponential, logarithmic, power law), we refrained from drawing a definitive conclusion about its superiority. Instead, we conclude more cautiously that the decay of the CDEC is better captured by nonlinear models rather than by a linear model. While the power-law model has been discussed in psychology as a way to describe human cognition, and in economics and sociology as a framework for explaining social dynamics, further research is needed to determine whether the power-law model is indeed the most appropriate for describing the spatial decay of CDEC, or whether another model may better account for the observed phenomena.
4.3. Spatio-Temporal Effects on CDEC
The spatio-temporal effects of the CDEC discussed thus far are summarized in Table 2. The effects summarized in the table are the seasonal effect, the milestone effect, the association effect, and the distance decay effect. Among these, the milestone effect includes an indirect effect that emerged during the course of the analysis and is therefore explained in greater detail, namely the gradual buildup of cognition leading up to that milestone. This may occur, for example, during the year preceding the milestone or in the month preceding the anniversary month in the milestone year.
4.4. Social and Theoretical Implications
Based on the findings of this study, several social and theoretical implications can be considered. CDEC is understood as a cognitive construct that may be associated with levels of disaster preparedness and awareness. In fact, a recent study focusing on the spatio-temporal characteristics of disaster education in Japan suggests that such education is primarily implemented in regions that have experienced major disasters in the past 3. These regions also tend to exhibit higher levels of disaster awareness. By integrating the findings of that study with the present results, it remains essential to avoid making premature claims about a causal relationship between CDEC and disaster education. However, the current findings suggest that maintaining a certain level of CDEC may be associated with heightened disaster awareness and the promotion of preparedness-related behaviors. In this context, exploring mechanisms to sustain and enhance CDEC, together with educational and social interventions, represents an important step toward building disaster-resilient communities and fostering a more resilient society overall.
4.4.1. The Uneven Distribution of CDEC
We must pay renewed attention to the issue of uncertainty surrounding when and where disasters will occur, as such events are inherently difficult to predict. In contemporary society, where advancements in transportation infrastructure and information technology have made human mobility a daily norm, disaster risk extends not only within people’s places of residence but also beyond them. In light of this situation, it is important that residents of regions recently affected by disasters are not the only ones maintaining high levels of CDEC. People living in areas with little or no disaster experience must also sustain their disaster awareness by maintaining elevated levels of CDEC. This is because individuals frequently travel for leisure or business and may experience a disaster while away from home. For instance, during the 2024 Noto Peninsula Earthquake (January 1, 2024), people were affected while returning home or traveling, and during the Great East Japan Earthquake (March 11, 2011), some victims were on business trips or taking entrance exams at the time of the disaster. Such cases of individuals being caught in a disaster simply by being in the wrong place at the wrong time have been reported not only in Japan but also around the world. This perspective on disaster risk should be shared across national and regional boundaries.
4.4.2. Disaster Education
As explained at the beginning of Section 4.4 (see also Fig. 7 and the discussion in the next section), although no causal relationship can be claimed, CDEC and disaster education may appear to be closely related. Based on this assumption, it reasonable to discuss the implications of disaster education as a coherent and reasonable extension of the argument.
In the international context, the Sendai Framework for Disaster Risk Reduction 2015–2030 43 identifies the reduction of human and material losses from disasters as a central goal. To achieve this, the importance of non-structural measures aimed at disaster risk reduction, particularly those that focus on public cognition and behavior, has been strongly emphasized. Among such measures, disaster education is positioned as a core element. In the case of Japan, which served as the focus of this study, disaster education was not designated as an independent subject within the compulsory education system. Although supplementary textbooks on disaster preparedness exist, their publication and distribution are limited, and their implementation is inconsistent across all regions. In particular, many of these materials are used in regions that have experienced major disasters, such as the Great East Japan Earthquake and the Great Hanshin-Awaji Earthquake (January 17, 1995). This suggests that educational resources for disaster preparedness tend to be concentrated in areas with higher levels of disaster awareness 3,4. In other words, there is a structural tendency in Japan for disaster education to be unevenly distributed, favoring regions where awareness is already elevated. Addressing this regional disparity and promoting disaster education in a geographically and socially inclusive manner is a critical challenge for the broader implementation of disaster risk reduction in society. Even in Japan, which is often considered a global leader in disaster preparedness, such issues persist. Therefore, it is likely that many other countries face even more severe educational and institutional challenges. The uneven distribution of disaster education is an urgent issue that must be addressed at the international level.
4.4.3. Socio-Cognitive Model of CDEC
Developing a socio-cognitive model may serve as a useful direction for future research as well as for advancing theoretical understanding. This study theoretically describes the structure of the CDEC and presents a socio-cognitive model that illustrates its framework (Fig. 7). The model was developed based on insights drawn from several recent theoretical works 61,62,63,64,65. The fundamental perspective underlying this model is rooted in Maurice Halbwachs’s concept of collective memory and the epistemological stance that memory is constituted within a social context 66.
This model explains how social systems and human agents interact within the process of CDEC. As stated earlier in this study, it serves as a useful framework for understanding the distance decay effect, which refers to how the processes of CDEC operate and take shape differently between disaster and non-disaster areas, with stronger CDEC observed in disaster-affected regions. Furthermore, as illustrated in the explanation of the model (Fig. 7), digital social systems are conceptualized as an integrated layer embedded within broader socio-environmental systems and interlinked with other layers. In this framework, behavioral data such as GTS and WPV are represented as indicators of collective attention, which are in turn connected to collective memory. As these relationships are driven by the dynamics proposed in the CDEC model, it is assumed that capturing data such as GTS and WPV can serve as an expression of the degree of CDEC.
In this model, three layers of socio-environmental systems are assumed: universal/national social and environmental systems, digital social systems, and local social systems. Under these systems, individuals are positioned, representing the formation of collective attention and collective memory, as well as the reciprocal circulation between the two. The layers of socio-environmental systems are defined as follows.
Universal/National Social and Environmental Systems
The first layer represents general social and environmental systems, whose concepts are universally shared across regions of the world. This layer comprises time, seasons, calendars, and atmosphere. Among these elements, time, seasons, and atmosphere contain both physical and social dimensions, whereas calendars are primarily composed of social constructs.
Digital Social Systems
The second layer represents a relatively new domain constructed through digital technologies and the Internet. Over the past two decades, and particularly in recent years, this layer has developed rapidly and has become widely integrated into daily life. This encompasses mass media, the Internet, and social media.
Local Social Systems
The third layer represents a unique domain rooted in specific local communities, and includes various elements related to the cognition of disaster events. Specifically, it comprises public spaces, such as museums, ruins, and heritage sites; local media; local communications, such as civic education, ceremonies, festivals, family communication, and school education. These local social systems repeatedly experience phases of development and decline within disaster-affected areas, demonstrating an overall trend of gradual attenuation over the long term. In contrast, they tend to be structurally underdeveloped in non-disaster areas.
Among these three layers, the influence of the first layer extends to the second and third layers, whereas the second and third layers mutually affect each other. Under these system layers, at the level of individuals and interpersonal phenomena, communication related to disasters, such as collaborative recollection and the sharing of narratives, occurs within disaster-affected areas, accompanied by individuals directing their attention toward the three-layered systems. Through these processes, collective attention and collective memory emerge. Although the causal relationship between the two remains unresolved and is often described as a “chicken and egg” problem, a reciprocal feedback loop is formed. In contrast, such communication is rarely observed in non-disaster areas, and because local social systems (the third layer) are absent or inactive, attention directed toward the three-layered systems is also limited.
This model was constructed primarily to explain the distance decay effect demonstrated in this study, although it does not yet sufficiently account for how CDEC propagates to surrounding areas. It also does not fully capture how CDEC weakens over time or how the periodicity identified in this study emerges in the long term. In addition, within the broad framework of cognition, notions such as awareness and consciousness may be positioned not merely as subordinate elements, but as potentially central or integrative concepts. As such, this model represents a conceptual understanding of CDEC at the current stage and should be refined as further knowledge and empirical data accumulate in the future.
Before concluding the theoretical implications, it is worth briefly noting the social implications derived from this model, which also relate to other sections of this study. To sustain CDEC within disaster-affected areas, it is important to focus on the elements within the third layer, the local social systems, that allow for relatively high levels of social intervention, rather than on those where intervention is inherently difficult. This is a relative consideration, since it is challenging to intervene in private domains such as family communication and also difficult to modify public spaces. Activities such as implementing civic education as a form of local communication, organizing and conducting community events and festivals, and continuously providing disaster education in schools are considered to contribute to the transmission of disaster memory and enhancement of community resilience (see the previous discussion on disaster education).
In contrast, to activate CDEC in non-disaster areas, or in other words, to suppress its distance decay and promote its propagation, the second layer, the digital social systems, is considered to play a crucial role. Although the negative aspects of misinformation and AI-generated content on social media have been increasingly highlighted in recent years, the appropriate use of social media can also evoke CDEC beyond disaster-affected regions. For example, sharing short videos that depict scenes from the time of a disaster or live-streaming memorial events may help people outside the disaster area pay attention to and remember such experiences, even without visiting the sites themselves. In this way, digital social systems are likely to serve as important mediating platforms that support the propagation of CDEC to non-disaster areas.
This study shares theoretical insights through the proposal of a CDEC model. It is expected that this model can be applied and extended not only to disaster contexts, but also to various phenomena related to memory, including historical events.
4.4.4. Respect for the Individual Within CDEC
This study has also attempted to conceptualize the CDEC and its socio-cognitive model, which may offer new insights into the phenomenon described above. However, perspectives on individual cognition should not be ignored or dismissed, especially when addressing practical issues related to psychosocial contexts. This discussion specifically focuses on how individual memory functions within the CDEC. In society, messages such as “Please do not forget the disaster” or “Remember that day” are often disseminated. However, despite the intentions of those who communicate these messages, they may impose a psychological burden on those directly affected. There are people who express a desire not to recall the disaster, or who say they would rather forget what happened on that day. The first author has occasionally encountered such sentiments during fieldwork, and similar narratives are also commonly found in the mass media. The tendency to avoid remembering may not remain confined to individuals. This can influence others through family members and the surrounding community, potentially affecting the next generation. In particular, when parents are reluctant to talk about the disaster, this hesitancy may be transmitted to their children, unintentionally constraining how memory and understanding of the event are formed (see also Fig. 7). This phenomenon represents a critical perspective that should not be overlooked, especially in discussions of disaster memory inheritance. Whether or not one remembers a disaster should ultimately be left to individual free will and agency. If we acknowledge the legitimacy of such individual freedom regarding memory, then any discussion of CDEC must be approached with careful consideration of whether it refers to individual cognition, collective cognition, or a combination of both, depending on the context.
4.4.5. Concluding Implications
Based on the above discussion, this study summarizes the social significance and future challenges of CDEC. The maintenance and promotion of CDEC is no longer a matter limited to disaster-affected areas; rather, it is a shared responsibility that extends across society as a whole. In an increasingly mobile and interconnected world, where tourists, migrants, and international students all share disaster risks, the CDEC can serve as a common cognitive foundation. In this sense, CDEC should be positioned as a core element of social resilience. Recognizing and implementing this perspective is an urgent issue not only for Japan, but also for the global community. In addressing the conceptual dichotomy between “individual” and “collective” in the context of CDEC, it is essential to avoid drawing rigid boundaries and instead pursue continuous reexamination from multilayered and relational perspectives. Finally, it must be acknowledged that humans are susceptible to cognitive tendencies such as normalcy bias and confirmation bias, which can lead to the underestimation of imminent risks and the false belief that “It will be fine” 67. These tendencies resonate not only at the individual level, but also within groups, contributing not only to momentary misjudgments, but also to the long-term decline of disaster awareness. Such cognitive dynamics may hinder the timely implementation of disaster preparedness. In light of these risks and guided by the implications of this study, it is imperative to move beyond the individual level and adopt concrete and immediate collective actions.
4.5. Limitations and Future Directions
Finally, seven limitations and future directions of this study should be noted. First, this study examined only one representative search query related to the Great East Japan Earthquake. However, the disaster involved not only earthquakes and tsunamis but also nuclear power plant accidents. Nuclear accidents are a significant component of how an event is cognitively represented as part of the CDEC. Future studies should investigate this aspect in greater detail.
Second, the present study was limited to 2011–2025. In memory research, several studies have addressed long-term cognition extending across decades 68,69. In the future, it will be valuable to examine how public cognition will evolve 20 years later in 2031, 30 years later in 2041, 40 years later in 2051, 50 years later in 2061, and even 100 years later in 2111. Continuing research in the coming years will be essential for understanding CDEC on such an extraordinarily long timescale.
Third, a potential limitation of this study concerns the analysis of the distance decay effect. Owing to the mathematical properties of the model, the data for Miyagi Prefecture were excluded from the model analysis because its distance from Sendai City Hall was calculated to be zero. Although we consider the impact of this exclusion on the model estimates to be limited, the present study did not conduct a comparative examination using a model that included Miyagi Prefecture. This is a methodological limitation because the study could not rigorously assess the extent of any potential influence or bias that may have arisen from this exclusion. Future research would benefit from examining the stability and validity of the distance decay effect by employing alternative distance measures and conducting re-analyses using multiple model specifications.
Fourth, which is partly related to the third limitation, this study did not fully address the spatial heterogeneity and homogeneity of temporal changes. We treated the temporal dynamics and spatial variation as separate factors and employed a relatively simple analytical approach. Although we attempted time-series analyses that combined the temporal and spatial dimensions, we were unable, partly due to space constraints, to obtain a model that we could judge as valid. In addition, we could not share pragmatic data outputs that would allow others to evaluate the validity of such models. The integration of temporal and spatial dimensions, and the clarification of the phenomena that emerge from their interaction, remain significant challenges for future research.
Fifth, this study is a case study. It examined public cognition related to a single disaster event, and naturally, the generalizability of the findings is limited. Future research should investigate other disaster events to examine the reproducibility of the effects hypothesized in this study. If the results are not replicated, it is important to carefully explore the reasons for the discrepancy, paying close attention to the differences in characteristics between the Great East Japan Earthquake and other events. In addition, although this study focused on natural disasters, contemporary perspectives on disasters recognize that not all disasters are natural in origin. Therefore, it is also necessary to examine public event cognition in the context of human-made disasters. Such investigations would align with the conceptual concerns discussed in this study.
Sixth, as is often the case with similar studies, this study faces the challenge of further validating the indicators used to enhance the reproducibility and robustness of the findings. In this study, a certain degree of cross-validation has been achieved by capturing the phenomenon of CDEC using GTS and WPV. However, it remains necessary for future research to examine whether the same phenomenon can be reproduced when using other indicators. For example, employing social media data, which are most similar to present data, could further strengthen the robustness of the phenomenon’s explanation. Moreover, using related indicators such as mass media coverage, textbook descriptions, and the number or participation rates of local events may enable a more multifaceted examination of the reproducibility and robustness of the CDEC.
Seventh, another limitation of this study is that, although the theoretical framework of CDEC was ambitiously constructed and proposed as a socio-cognitive model, there remains room for further development and systematic organization in relation to existing concepts. This study focused on visualizing and describing the phenomenon of CDEC, with an emphasis on identifying its presence and dynamics through empirical data. It remains a future task to refine the model’s theoretical positioning by clarifying similarities and differences with existing frameworks. For example, within the field of memory research, relevant frameworks may include flashbulb memory 70,71, collective memory 26,27, autobiographical memory 72,73, episodic memory 74,75, and even trauma memory 76,77. Future studies should explore these theoretical relationships to clarify the conceptual distinctiveness of the CDEC and to further deepen our understanding of collective cognition in disaster contexts.
5. Concluding Remarks
This study examines the long-term spatio-temporal dynamics of the CDEC using the Great East Japan Earthquake as a case study. The findings revealed various spatio-temporal effects associated with CDEC over time. Notably, this study identified and classified long-term temporal effects into three distinct categories: the seasonal effect, the milestone effect, and the association effect. In terms of spatial effects, the analysis demonstrated the distance decay effect and demonstrated that this decay was better captured by nonlinear models than by a linear model. Among the nonlinear models tested, the power-law model was found to be the most appropriate. Future research should explore the applicability of these findings to other disaster events and identify additional spatio-temporal effects beyond those specified in this study. Such efforts will contribute to a deeper understanding of how CDEC unfolds. From a practical perspective, future research should focus on the social sharing of collective public cognition. Such sharing may serve as a foundation for developing policies in the domain of “soft” disaster risk reduction, particularly in the areas of disaster education and public awareness-raising.
Acknowledgments
We would like to express our sincere gratitude to the reviewers for their constructive and insightful comments, which have greatly contributed to improving the quality of this study. Their feedback has been both encouraging and inspiring, not only for this research but also for our future work. This study utilized ChatGPT (GPT-4o and GPT-5) and Microsoft 365 Copilot to support English proofreading, logical consistency, and data analysis. The research was conducted with support from the Grants-in-Aid for Scientific Research (KAKENHI Grant Numbers 23KK0084 and 24K16597) and the Disaster Resilience Co-Creation Center, IRIDeS, Tohoku University 2024 Disaster Resilience Co-Creation Project (Principal Investigator: R. Saito).
Footnotes
(1) There is a well-known quote often attributed to Charles Darwin: “It is not the strongest of the species that survives, nor the most intelligent that survives. It is the one that is most adaptable to change”; however, the original source of this quote is unclear, and it is widely believed that Darwin himself did not actually say or write these words 1. While this attribution should be approached with caution, this study interprets a similar sentiment to have been referenced, or at least implied, by Dr. Torahiko Terada. Accordingly, this quote is cited in the present study as representative of Terada’s views. For instance, in his book “Natural Disasters and National Defense” 2, he refers to the human tendency to forget disasters, which resonates with the message of adaptability and change.
(2) The Nagasaki Prefectural Government has specified the latitude and longitude of the former site.
- [1] University of Cambridge, “Darwin Correspondence Project.” https://www.darwinproject.ac.uk/ [Accessed July 31, 2025]
- [2] T. Terada, “Natural disasters and national defense,” Aozora Bunko, 1934. https://www.aozora.gr.jp/cards/000042/files/2509_9319.html [Accessed July 27, 2025]
- [3] R. Saito, M. Yasuda, T. Muramoto, and T. Oda, “The possibility of geographic area and time distribution of DRR education to represent disaster collective memory: A time geographic study of newspapers in Japan,” Inclusive and Integrated Disaster Reduction, pp. 472-480, 2024. https://doi.org/10.1007/978-3-031-81072-5_34
- [4] R. Saito, T. Muramoto, and T. Oda, “Differences of educational practices for disaster risk reduction in elementary and junior high school in coastal areas in three prefectures affected by the Great East Earthquake: A comparison study in prefectures and in types of school,” Research J. of Disaster Education, Vol.3, No.2, pp. 1-23, 2023 (in Japanese). https://doi.org/10.51004/rjde.3.2_1
- [5] N. Dasandi, S. Jankin, D. K. Pantera, and M. Romanello, “Public engagement with health and climate change around the world: A Google Trends analysis,” The Lancet Planetary Health, Vol.9, No.3, pp. e236-e244, 2025. https://doi.org/10.1016/S2542-5196(25)00029-4
- [6] S. P. Jun, H. S. Yoo, and S. Choi, “Ten years of research change using Google Trends: From the perspective of big data utilizations and applications,” Technological Forecasting and Social Change, Vol.130, pp. 69-87, 2018. https://doi.org/10.1016/j.techfore.2017.11.009
- [7] A. Mavragani, G. Ochoa, and K. P. Tsagarakis, “Assessing the methods, tools, and statistical approaches in Google Trends research: Systematic review,” J. of Medical Internet Research, Vol.20, No.11, Article No.e270, 2018. https://doi.org/10.2196/jmir.9366
- [8] Google, “FAQ about Google Trends data.” https://support.google.com/trends/answer/4365533?hl=en [Accessed May 24, 2025]
- [9] S. V. Nuti, B. Wayda, I. Ranasinghe, S. Wang, R. P. Dreyer, S. I. Chen, and K. Murugiah, “The use of Google Trends in health care research: A systematic review,” PLOS ONE, Vol.9, No.10, Article No.e109583, 2014. https://doi.org/10.1371/journal.pone.0109583
- [10] V. S. Arora, M. McKee, and D. Stuckler, “Google Trends: Opportunities and limitations in health and health policy research,” Health Policy, Vol.123, Issue 3, pp. 338-341, 2019. https://doi.org/10.1016/j.healthpol.2019.01.001
- [11] H. A. Carneiro and E. Mylonakis, “Google Trends: A web-based tool for real-time surveillance of disease outbreaks,” Clinical Infectious Diseases, Vol.49, Issue 10, pp. 1557-1564, 2009. https://doi.org/10.1086/630200
- [12] H. Choi and H. Varian, “Predicting the present with Google Trends,” Economic Record, Vol.88, Issue s1, pp. 2-9, 2012. https://doi.org/10.1111/j.1475-4932.2012.00809.x
- [13] D. Borup and E. C. M. Schütte, “In search of a job: Forecasting employment growth using Google Trends,” J. of Business & Economic Statistics, Vol.40, Issue 1, pp. 186-200, 2022. https://doi.org/10.1080/07350015.2020.1791133
- [14] E. Castelnuovo and T. D. Tran, “Google it up! A Google Trends-based uncertainty index for the United States and Australia,” Economics Letters, Vol.161, pp. 149-153, 2017. https://doi.org/10.1016/j.econlet.2017.09.032
- [15] E. Cebrián and J. Domenech, “Is Google Trends a quality data source?,” Applied Economics Letters, Vol.30, Issue 6, pp. 811-815, 2023. https://doi.org/10.1080/13504851.2021.2023088
- [16] G. Cervellin, I. Comelli, and G. Lippi, “Is Google Trends a reliable tool for digital epidemiology? Insights from different clinical settings,” J. of Epidemiology and Global Health, Vol.7, No.3, pp. 185-189, 2017. https://doi.org/10.1016/j.jegh.2017.06.001
- [17] I. Lolić, M. Matošec, and P. Sorić, “DIY Google Trends indicators in social sciences: A methodological note,” Technology in Society, Vol.77, Article No.102477, 2024. https://doi.org/10.1016/j.techsoc.2024.102477
- [18] J. Hölzl, F. Keusch, and C. Sajons, “The (mis)use of Google Trends data in the social sciences—A systematic review, critique, and recommendations,” Social Science Research, Vol.126, Article No.103099, 2025. https://doi.org/10.1016/j.ssresearch.2024.103099
- [19] E. J. Masicampo and N. Ambady, “Predicting fluctuations in widespread interest: Memory decay and goal-related memory accessibility in Internet search trends,” J. of Experimental Psychology: General, Vol.143, No.1, pp. 205-214, 2014. https://doi.org/10.1037/a0030731
- [20] N. Rouhani, D. Stanley, COVID-Dynamic Team, and R. Adolphs, “Collective events and individual affect shape autobiographical memory,” Proc. of the National Academy of Sciences, Vol.120, No.29, Article No.e2221919120, 2023. https://doi.org/10.1073/pnas.2221919120
- [21] S. Merrill and S. Lindgren, “The rhythms of social movement memories: The mobilization of Silvio Meier’s activist remembrance across platforms,” Social Movement Studies, Vol.19, Issues 5-6, pp. 657-674, 2020. https://doi.org/10.1080/14742837.2018.1534680
- [22] J. Kam, K. Stowers, and S. Kim, “Monitoring of drought awareness from Google Trends: A case study of the 2011–17 California drought,” Weather, Climate, and Society, Vol.11, Issue 2, pp. 419-429, 2019. https://doi.org/10.1175/WCAS-D-18-0085.1
- [23] S. P. Shariatpanahi, A. Jafari, M. Sadeghipour, N. Azadeh-Fard, K. Majidzadeh-A, L. Farahmand, and A. M. Ansari, “Assessing the effectiveness of disease awareness programs: Evidence from Google Trends data for the world awareness dates,” Telematics and Informatics, Vol.34, Issue 7, pp. 904-913, 2017. https://doi.org/10.1016/j.tele.2017.03.007
- [24] M. Kaatz, S. Springer, R. Schubert, and M. Zieger, “Representation of long COVID syndrome in the awareness of the population is revealed by Google Trends analysis,” Brain, Behavior, & Immunity-Health, Vol.22, Article No.100455, 2022. https://doi.org/10.1016/j.bbih.2022.100455
- [25] Z. D. U. Durmuşoğlu, “Using Google Trends data to assess public understanding on the environmental risks,” Human and Ecological Risk Assessment: An Int. J., Vol.23, Issue 8, pp. 1968-1977, 2017. https://doi.org/10.1080/10807039.2017.1350566
- [26] W. Hirst, J. K. Yamashiro, and A. Coman, “Collective memory from a psychological perspective,” Trends in Cognitive Sciences, Vol.22, Issue 5, pp. 438-451, 2018. https://doi.org/10.1016/j.tics.2018.02.010
- [27] J. V. Wertsch and H. L. Roediger III, “Collective memory: Conceptual foundations and theoretical approaches,” Memory, Vol.16, Issue 3, pp. 318-326, 2008. https://doi.org/10.1080/09658210701801434
- [28] P. Lorenz-Spreen, B. M. Mønsted, P. Hövel, and S. Lehmann, “Accelerating dynamics of collective attention,” Nature Communications, Vol.10, No.1, Article No.1759, 2019. https://doi.org/10.1038/s41467-019-09311-w
- [29] F. Wu and B. A. Huberman, “Novelty and collective attention,” Proc. of the National Academy of Sciences, Vol.104, No.45, pp. 17599-17601, 2007. https://doi.org/10.1073/pnas.0704916104
- [30] H. C. Lee, S. M. Broniarczyk, and J. Zheng, “Mapping collective consciousness to consumer research: In-person to virtual social presence,” J. of Consumer Psychology, Vol.34, Issue 4, pp. 694-704, 2024. https://doi.org/10.1002/jcpy.1435
- [31] G. Shteynberg, “The psychology of collective consciousness,” J. of Consumer Psychology, Vol.34, Issue 4, pp. 678-686, 2024. https://doi.org/10.1002/jcpy.1434
- [32] M. Mooijman, J. Hoover, Y. Lin, H. Ji, and M. Dehghani, “Moralization in social networks and the emergence of violence during protests,” Nature Human Behaviour, Vol.2, No.6, pp. 389-396, 2018. https://doi.org/10.1038/s41562-018-0353-0
- [33] K. Sasahara, W. Chen, H. Peng, G. L. Ciampaglia, A. Flammini, and F. Menczer, “Social influence and unfollowing accelerate the emergence of echo chambers,” J. of Computational Social Science, Vol.4, No.1, pp. 381-402, 2021. https://doi.org/10.1007/s42001-020-00084-7
- [34] D. Erokhin and N. Komendantova, “Analyzing public interest in geohazards using Google Trends data,” Geosciences, Vol.14, Issue 10, Article No.266, 2024. https://doi.org/10.3390/geosciences14100266
- [35] F. T. Gizzi, J. Kam, and D. Porrini, “Time windows of opportunities to fight earthquake under-insurance: Evidence from Google Trends,” Humanities and Social Sciences Communications, Vol.7, No.1, Article No.61, 2020. https://doi.org/10.1057/s41599-020-0532-2
- [36] C. Houser, B. Vlodarchyk, and P. Wernette, “Short communication: Public interest in rip currents relative to other natural hazards: Evidence from Google search data,” Natural Hazards, Vol.97, pp. 1395-1405, 2019. https://doi.org/10.1007/s11069-019-03696-z
- [37] J. Yeo and C. C. Knox, “Public attention to a local disaster versus competing focusing events: Google Trends analysis following the 2016 Louisiana flood,” Social Science Quarterly, Vol.100, Issue 7, pp. 2542-2554, 2019. https://doi.org/10.1111/ssqu.12666
- [38] A. Silver and S. Jackson, “Public attention during Hurricanes Florence and Michael,” Weather, Climate, and Society, Vol.15, Issue 2, pp. 425-435, 2023. https://doi.org/10.1175/WCAS-D-22-0090.1
- [39] D. M. Ahmad and J. Kam, “Disparity between global drought hazard and awareness,” npj Clean Water, Vol.7, No.1, Article No.75, 2024. https://doi.org/10.1038/s41545-024-00373-y
- [40] S. M. B. Shahabi-Haghighi and H. Hamidifar, “Exploring the link between drought-related terms and public interests: Global insights from LSTM-based predictions and Google Trends analysis,” Hydrological Processes, Vol.37, Issue 11, Article No.e15016, 2023. https://doi.org/10.1002/hyp.15016
- [41] J. J. Thompson, R. L. Wilby, T. Matthews, and C. Murphy, “The utility of Google Trends as a tool for evaluating flooding in data-scarce places,” Area, Vol.54, Issue 2, pp. 203-212, 2022. https://doi.org/10.1111/area.12719
- [42] Reconstruction Agency, “Recovery status and efforts since the Great East Japan Earthquake” (in Japanese). https://www.reconstruction.go.jp/topics/main-cat1/sub-cat1-1/20131029113414.html [Accessed May 24, 2025]
- [43] United Nations Office for Disaster Risk Reduction, “Sendai Framework for Disaster Risk Reduction 2015–2030,” 2015. https://www.undrr.org/publication/sendai-framework-disaster-risk-reduction-2015-2030 [Accessed May 24, 2025]
- [44] S. Dehaene, “The neural basis of the Weber–Fechner law: A logarithmic mental number line,” Trends in Cognitive Sciences, Vol.7, Issue 4, pp. 145-147, 2003. https://doi.org/10.1016/s1364-6613(03)00055-x
- [45] C. Donkin and R. M. Nosofsky, “A power-law model of psychological memory strength in short- and long-term recognition,” Psychological Science, Vol.23, Issue 6, pp. 625-634, 2012. https://doi.org/10.1177/0956797611430961
- [46] J. Gibbon and R. M. Church, “Time left: Linear versus logarithmic subjective time,” J. of Experimental Psychology: Animal Behavior Processes, Vol.7, No.2, pp. 87-108, 1981. https://doi.org/10.1037/0097-7403.7.2.87
- [47] C. T. Kello, G. D. A. Brown, R. Ferrer-i-Cancho, J. G. Holden, K. Linkenkaer-Hansen, T. Rhodes, and G. C. V. Orden, “Scaling laws in cognitive sciences,” Trends in Cognitive Sciences, Vol.14, Issue 5, pp. 223-232, 2010. https://doi.org/10.1016/j.tics.2010.02.005
- [48] D. C. Rubin and A. E. Wenzel, “One hundred years of forgetting: A quantitative description of retention,” Psychological Review, Vol.103, No.4, pp. 734-760, 1996. https://doi.org/10.1037/0033-295X.103.4.734
- [49] S. S. Stevens, “On the psychophysical law,” Psychological Review, Vol.64, No.3, pp. 153-181, 1957. https://doi.org/10.1037/h0046162
- [50] S. S. Stevens, “A scale for the measurement of a psychological magnitude: Loudness,” Psychological Review, Vol.43, No.5, pp. 405-416, 1936. https://doi.org/10.1037/h0058773
- [51] J. T. Wixted and E. B. Ebbesen, “On the form of forgetting,” Psychological Science, Vol.2, No.6, pp. 409-415, 1991. https://doi.org/10.1111/j.1467-9280.1991.tb00175.x
- [52] A. Clauset, C. R. Shalizi, and M. E. Newman, “Power-law distributions in empirical data,” SIAM Review, Vol.51, Issue 4, pp. 661-703, 2009. https://doi.org/10.1137/070710111
- [53] X. Gabaix, “Power laws in economics and finance,” Annual Review of Economics, Vol.1, No.1, pp. 255-294, 2009. https://doi.org/10.1146/annurev.economics.050708.142940
- [54] J. Laherrere and D. Sornette, “Stretched exponential distributions in nature and economy: ‘Fat tails’ with characteristic scales,” The European Physical J. B – Condensed Matter and Complex Systems, Vol.2, No.4, pp. 525-539, 1998. https://doi.org/10.1007/s100510050276
- [55] Wikipedia, “Wikipedia: Pageview statistics.” https://en.wikipedia.org/wiki/Wikipedia:Pageview_statistics [Accessed July 27, 2025]
- [56] Wikipedia, “Pageviews analysis” (in Japanese). https://pageviews.wmcloud.org/?project=ja.wikipedia.org&platform=all-access&agent=user&redirects=0&start=2015-07&end=2025-05&pages=東日本大震災 [Accessed July 27, 2025]
- [57] Cabinet Office, Government of Japan, “The disaster caused by the earthquake off the coast of Fukushima Prefecture in 2021,” White Paper on Disaster Management 2021, 2021.
- [58] NHK, “Kumamoto Earthquake: One additional disaster-related death confirmed in Kumamoto Prefecture, bringing the total death toll to 278,” April 11, 2025 (in Japanese). https://www3.nhk.or.jp/news/html/20250411/k10014776751000.html [Accessed May 24, 2025]
- [59] NHK, “Noto Peninsula Earthquake: Nine additional disaster-related deaths confirmed, bringing the total death toll to 616,” June 20, 2025 (in Japanese). https://www3.nhk.or.jp/news/html/20250620/k10014840121000.html [Accessed May 24, 2025]
- [60] Cabinet Office, Government of Japan, “Northern Osaka Earthquake,” White Paper on Disaster Management 2019, 2019.
- [61] J. R. Finley, “Expanded taxonomies of human memory,” Frontiers in Cognition, Vol.3, Article No.1505549, 2025. https://doi.org/10.3389/fcogn.2024.1505549
- [62] I. Momennejad, “Collective minds: Social network topology shapes collective cognition,” Philosophical Trans. of the Royal Society B, Vol.377, Issue 1843, Article No.20200315, 2022. https://doi.org/10.1098/rstb.2020.0315
- [63] J.-F. Orianne and F. Eustache, “Collective memory: between individual systems of consciousness and social systems,” Frontiers in Psychology, Vol.14, Article No.1238272, 2023. https://doi.org/10.3389/fpsyg.2023.1238272
- [64] J.-F. Orianne, D. Peschanski, J. Müller, B. Guillery, and F. Eustache, “The process of memory semantization as the result of interactions between individual, collective, and social memories,” Cortex, Vol.183, pp. 1-14, 2025. https://doi.org/10.1016/j.cortex.2024.11.001
- [65] F. Seeme, D. Green, and C. Kopp, “Ignorance of the crowd: Dysfunctional thinking in social networks,” Frontiers in Communication, Vol.10, Article No.1547489, 2025. https://doi.org/10.3389/fcomm.2025.1547489
- [66] M. Halbwachs, “La mémoire collective,” T. Koseki (Trans.), Kōrōsha, 1989.
- [67] T. Muramoto and R. Saito, “Disaster and the human mind,” T. Oda (Ed.), “Disaster Risk Reduction Workbook for Educators,” pp. 37-45, Asakura Publishing, 2021 (in Japanese).
- [68] H. L. Roediger III and K. A. DeSoto, “Forgetting the presidents,” Science, Vol.346, No.6213, pp. 1106-1109, 2014. https://doi.org/10.1126/science.1259627
- [69] H. L. Roediger III and K. A. DeSoto, “Recognizing the presidents: Was Alexander Hamilton president?,” Psychological Science, Vol.27, No.5, pp. 644-650, 2016. https://doi.org/10.1177/0956797616631113
- [70] R. Brown and J. Kulik, “Flashbulb memories,” Cognition, Vol.5, Issue 1, pp. 73-99, 1977. https://doi.org/10.1016/0010-0277(77)90018-X
- [71] A. R. A. Conway, L. J. Skitka, J. A. Hemmerich, and T. C. Kershaw, “Flashbulb memory for 11 September 2001,” Applied Cognitive Psychology, Vol.23, Issue 5, pp. 605-623, 2009. https://doi.org/10.1002/acp.1497
- [72] M. A. Conway and C. W. Pleydell-Pearce, “The construction of autobiographical memories in the self-memory system,” Psychological Review, Vol.107, No.2, pp. 261-288, 2000. https://doi.org/10.1037/0033-295X.107.2.261
- [73] A. Wilson and M. Ross, “The identity function of autobiographical memory: Time is on our side,” Memory, Vol.11, Issue 2, pp. 137-149, 2003. https://doi.org/10.1080/741938210
- [74] E. Tulving, “Episodic memory: From mind to brain,” Annual Review of Psychology, Vol.53, No.1, pp. 1-25, 2002. https://doi.org/10.1146/annurev.psych.53.100901.135114
- [75] D. C. Rubin, “The basic-systems model of episodic memory,” Perspectives on Psychological Science, Vol.1, Issue 4, pp. 277-311, 2006. https://doi.org/10.1111/j.1745-6916.2006.00017.x
- [76] B. M. Elzinga and J. D. Bremner, “Are the neural substrates of memory the final common pathway in posttraumatic stress disorder (PTSD)?,” J. of Affective Disorders, Vol.70, Issue 1, pp. 1-17, 2002. https://doi.org/10.1016/S0165-0327(01)00351-2
- [77] D. C. Rubin, D. Berntsen, and M. K. Bohni, “A memory-based model of posttraumatic stress disorder: Evaluating basic assumptions underlying the PTSD diagnosis,” Psychological Review, Vol.115, No.4, pp. 985-1011, 2008. https://doi.org/10.1037/a0013397
This article is published under a Creative Commons Attribution-NoDerivatives 4.0 Internationa License.