Paper:
Research of Life Recovery Process of Victims of Small and Medium-Sized Floods Using Mobile Spatial Statistics and Social Survey
Jinsaku Asano*, Shosuke Sato**,†
 , and Fumihiko Imamura**
*Department of Civil Engineering, School of Engineering, Tohoku University
468-1 Aza-Aoba, Aramaki, Aoba-ku, Sendai, Miyagi 980-8572, Japan
**International Research Institute of Disaster Science, Tohoku University
Sendai, Japan
†Corresponding author

Focusing on small- to medium-scale floods, whose frequency is projected to increase, this study examined post-disaster population dynamics and the life recovery process of affected individuals. Analysis of mobile spatial statistics for the July 2023 Akita heavy rain showed a population decline within inundated areas and spatial variation in population changes across those areas. A questionnaire survey found that preparedness measures increased after the disaster. The results show that, although physical recovery progresses quickly in small- to medium-scale floods, the restoration of local economic activity and residents’ perceptions (the “soft” aspects) takes as long as in earthquakes or large-scale floods.
1. Introduction
The Sixth Assessment Report of the Intergovernmental Panel on Climate Change (IPCC) 1 projects increases in overall precipitation and in the frequency of extreme rainfall events. In Japan, comparisons between present and future climates show that short-duration heavy rainfall exceeding 50 mm per hour will become significantly more frequent across all regions and seasons, with the annual occurrence expected to double 2. Because of the associated rise in future flood risk, Japanese society now demands effective countermeasures.
Because completely eliminating flood damage is extremely difficult, it is essential to discuss how to support recovery and reconstruction in flood-affected areas and to advance the life reconstruction process for victims. Although studies such as those by Taylor et al. 3 and Peacock et al. 4 address the restoration of physical infrastructure, empirical knowledge about the life recovery process remains limited, and further research is needed 5.
In large-scale flood disasters involving levee breaches, dwellings are washed away, and victims begin recovery in temporary housing. In contrast, in floods without house washouts from levee breaches or catastrophic destruction from landslides, and with a low proportion of completely destroyed houses among all affected houses (termed “small- to medium-scale floods” in this study), houses usually remain standing. This allows residents to rebuild their lives while continuing to live in the affected area. For example, after the heavy rainfall in Akita Prefecture in July 2023, where inland flooding was the main hazard, no large-scale relocation schemes were implemented. Instead, many households repaired damaged houses to secure living space 6.
Since the 1995 Great Hanshin-Awaji Earthquake, researchers have measured the progress of life reconstruction by combining victims’ subjective assessments of their recovery and future outlook into a “life reconstruction perception scale.” Tatsuki et al. 7 identified seven elements of life reconstruction and found that success depends not only on physical rebuilding but also on engagement with government, the wider community, and neighboring residents.
Representative studies on life reconstruction after floods include Kimura et al. 8, who analyzed conditions in the area affected by the 2011 Kii Peninsula floods using a recovery–reconstruction calendar 9, and suggested that flood recovery may follow a process similar to that observed after earthquakes. Tsuboi 10 calculated temporal changes in perceptions of life reconstruction through a social survey in districts affected by Typhoon Hagibis in 2019, and showed that community-level population movement, as well as housing repair, influences life reconstruction. Most other studies have focused on housing reconstruction 11,12; comprehensive analyses of the life recovery process remain limited, and research on small- to medium-scale floods is virtually absent.
During the life reconstruction process after small- to medium-scale floods, preparedness for future events requires particular attention. Because reconstruction occurs in situ, residents who remain in the affected area must adopt preparedness measures and other adaptive strategies 13. To the best of the authors’ knowledge, no study has documented the actual state of preparedness in these settings.
Against this backdrop, the present study examines the July 2023 Akita heavy rain event, classified here as a small- to medium-scale flood, with the aim of analyzing (1) population dynamics in the affected area, (2) behavioral changes in disaster preparedness, and (3) the current status and challenges of the life reconstruction process. Objective (1) is addressed by analyzing recently developed human-mobility data 14,15,16; objectives (2) and (3) are investigated through a questionnaire survey that captures the life reconstruction process, its current state, and related issues. By describing the recovery trajectory and the preparedness measures adopted to sustain residence, this study aims to provide insights that support more effective life reconstruction and recovery in response to increasingly frequent small- to medium-scale floods.
2. Data and Methods
2.1. Study Area
This study examines the area affected by the heavy rain event that struck Akita Prefecture in July 2023. From July 14 to July 16, 2023, a stationary Baiu front caused intense rainfall in northern Tohoku. Several gauges in Akita Prefecture recorded their highest-ever 24-hour totals, and cumulative rainfall exceeded 400 mm in some locations. Monthly totals in parts of Akita and Aomori greatly exceeded the region’s normal July rainfall.
The event caused river overflows, pluvial flooding, and slope failures throughout Tohoku, resulting in five deaths (including disaster-related deaths) and six injuries in Akita Prefecture 17. In Akita City, extensive urban inundation occurred. Across the prefecture, 7,375 dwellings were damaged; however, only 11 houses were completely destroyed (including those washed away). Most damage involved above-floor or below-floor inundation. In comparison, the 2011 Kii Peninsula floods resulted in 240 completely destroyed houses out of 7,933 damaged, indicating a much higher proportion of complete destruction. This comparison confirms that the July 2023 event qualifies as a small- to medium-scale flood as defined in this study.
In Akita City and Gojome Town, residents experienced life-reconstruction challenges, including difficulty overwintering because of flooded household goods 6, and prolonged psychological stress after the disaster 18. Recovery support coordinated by local social welfare councils 19 continued as of July 2025. Because of these circumstances, Akita City and Gojome Town, both affected by the July 2023 Akita heavy rain, were selected as the study area.
In addition to the July 2023 event, the study area has experienced several flood disasters in the past five years. In May 2018, a flood in the southern part of Akita City caused above-floor inundation in 146 dwellings and below-floor inundation in 232 dwellings 20. In August 2022, heavy rain in Gojome Town led to above-floor inundation in 36 dwellings and below-floor inundation in 63 dwellings 21. This study presents these disaster experiences as part of the disaster history of the study area.
2.2. Population Change Analysis
Population change was analyzed using the Mobile Spatial Statistics real-time domestic population distribution data set from NTT Docomo. This data set provides hourly counts of devices in each 500 m grid cell. Values are withheld when the count for any attribute category is less than 10, and this missing-data rule was considered in the analysis.
Following earlier work 15,16, the estimated population based on data recorded between 04:00 and 04:59 was used as a proxy for the resident population. Flood-affected cells were identified by intersecting inundation extents from prefectural flood-simulation outputs with district-level counts of damaged houses compiled by Gojome Town. A 500 m grid cell was considered flood-affected if any part of the cell overlapped with the inundation area; complete submergence of the entire grid was not required. This process identified 127 grid cells within the presumed inundated area.
For each cell, we calculated a three-day moving average of the daily resident-population series for the period June 14, 2023, to June 14, 2024, following the procedure of Hong et al. 22. We then applied \(K\)-means clustering with Euclidean distance to the resulting time series to identify characteristic patterns of population change. As discussed in the following chapter, this procedure produced three distinct clusters.
2.3. Questionnaire Survey
A questionnaire survey was conducted in the inundated areas of Akita City and Gojome Town to examine households’ life reconstruction and preparedness status. The survey team mailed questionnaires to 1,500 households located within the flood zone. Target households were selected using simple random sampling from residential buildings identified on large-scale residential maps provided by Zenrin Co., Ltd., within the survey meshes described below.
Eighteen 500 m meshes within the inundated area were selected as survey meshes. To ensure enough eligible households in each population-change cluster identified in the previous analysis, and to include affected households through random sampling, meshes were chosen if they met the following criteria: they belonged to one of the three clusters, had an average daily resident population of at least 100 persons, and showed a high post-flood population-change rate.
The questionnaire included three sections. The first section covered respondent attributes, such as age, changes in household finances, occupation, damage level certified by disaster-victim certificates, presence or absence of inundation damage, and related variables. The second section addressed changes while rebuilding daily life, focusing on the implementation of 20 preparedness measures before and after the flood. For each respondent, we calculated the number of newly adopted measures, and for each item, the change in implementation rate. The third section examined post-disaster actions and impacts, including items on the recovery-reconstruction calendar 9, a stress scale 23, the life reconstruction perception scale 23, and the disaster coexistence culture attitude scale 24.
3. Results
3.1. Population Change Analysis
3.1.1. Population Increase and Decrease in Flood-Affected Areas
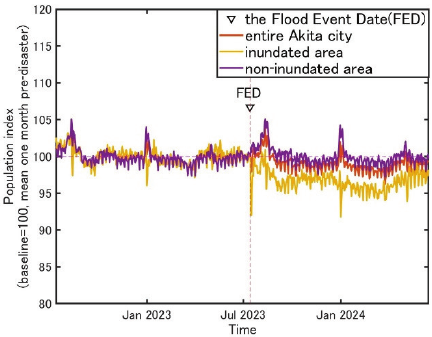
Fig. 1. Population change in Akita City, from July 14, 2022, to June 30, 2024.
A comparison of population change before and after the flood shows that the inundated area had a decline of about 5% relative to the non-inundated area (Fig. 1). Previous studies have measured household-level depopulation in large-scale floods. Namikawa et al. 25 reported a 6%–16% decline by age cohort within the inundated zone of Kurashiki City, Okayama Prefecture, after the July 2018 heavy rain, which caused 52 fatalities (excluding disaster-related deaths) and destroyed 4,645 houses, with an additional 1,331 houses partially destroyed, partially damaged, or flooded above floor level 26. In Joso City, Ibaraki Prefecture, which was affected by the September 2015 heavy rain and levee breach along the Kinugawa River, population in the inundated zone fell by 1%–3% by age cohort. This event resulted in two deaths (excluding disaster-related deaths) and damage to 53 houses completely destroyed, 1,581 houses severely destroyed, 3,491 houses partially destroyed, and 3,216 houses flooded above or below floor level 27.
Although only 11 houses were completely destroyed in Akita Prefecture during the July 2023 event, far fewer than in large-scale floods, the 5% population decline within the inundated area was greater than that observed in Joso City and only slightly less than in Kurashiki City. Kurashiki’s recovery plan included extensive levee reinforcement, new evacuation routes, and significant budgets for temporary housing, permanent rebuilding, and community restoration 28. Joso City carried out basin-wide levee upgrades, channel dredging, and community and childcare support programs 29,30. In contrast, Akita City’s actions have so far been limited to installing drainage pumps and conducting about 2 km of minor channel dredging 31. These limited structural measures may have contributed to the observed depopulation following this small- to medium-scale flood.
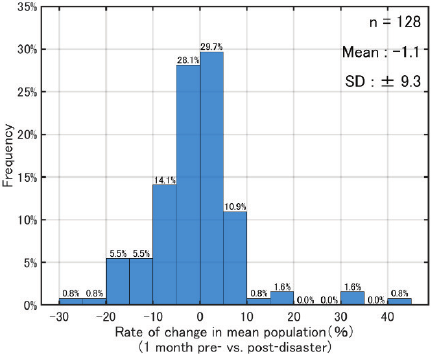
Fig. 2. Distribution of population change rates within inundated meshes.
Within the inundated zone, the difference in average daily population for each mesh was calculated by comparing the month before and the month after the flood (Fig. 2). On average, population per mesh declined by 1.1%. The mesh with the largest decrease lost about 30% of its population, while the mesh with the largest increase gained about 40%. Although overall depopulation was generally smaller than that reported for large-scale floods, localized decreases sometimes exceeded those of large events. This finding indicates that small- to medium-scale floods can still cause severe population losses at fine spatial scales.
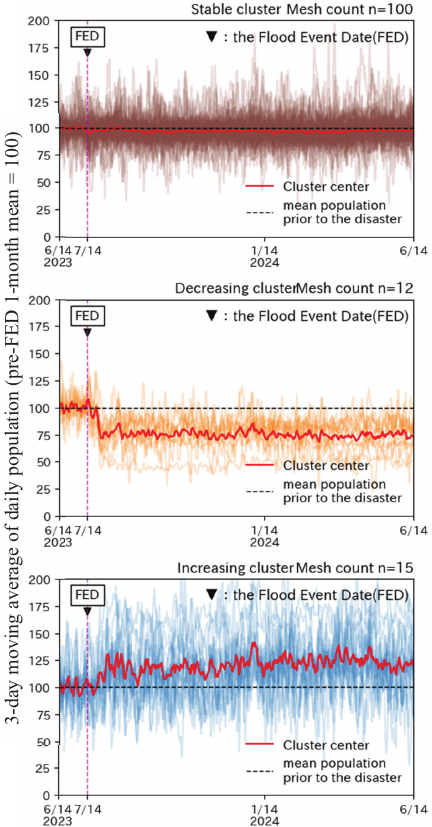
Fig. 3. Results of the cluster analysis.
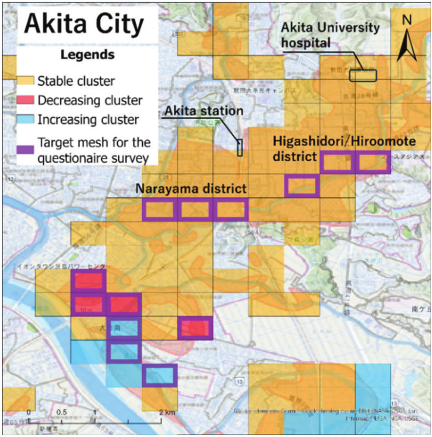
Fig. 4. Results of the cluster analysis in Akita City and target meshes for the questionnaire survey.
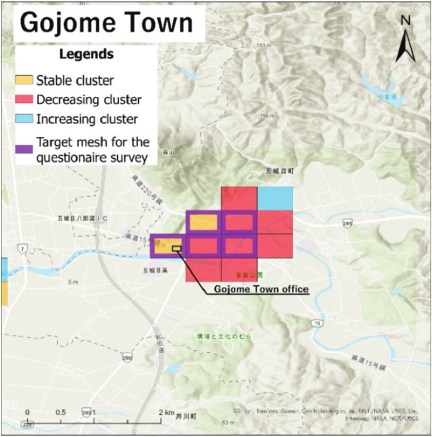
Fig. 5. Results of the cluster analysis in Gojome Town and target meshes for the questionnaire survey.
3.1.2. Regional Typology Based on Population Change
To examine spatial heterogeneity within the inundated zone, we clustered the population-change trajectories of all affected meshes (Fig. 3). We used the mean resident population during the month before the flood as the baseline. Based on this baseline, we classified each mesh into one of three groups: stable, decreasing, or increasing.
Based on previous studies 22, the initial number of clusters was set at approximately three to four. When three clusters were specified, the resulting groups most clearly represented the key characteristics of the data. In contrast, increasing the number of clusters to four or more mainly resulted in additional clusters with only a single element. Therefore, the number of clusters is set to three.
In the decreasing cluster, the population does not decline immediately after the FED but begins to decrease several days later. Although no specific event occurred during this period, one possible explanation is evacuation to secondary destinations. Because the data set in this study has a spatial resolution of 500-m meshes, population movements that occur entirely within the same mesh are not captured. Each mesh contains multiple primary evacuation shelters, but many of these facilities, such as elementary schools, are not suitable for long-term stays. Residents may have remained at primary shelters within the same mesh for several days after the FED, then relocated to more comfortable secondary evacuation destinations, such as hotels or relatives’ homes, in other areas.
The resulting clusters are color-coded on the maps in Fig. 4 (Akita City) and Fig. 5 (Gojome Town). The maps indicate significant depopulation in the heavily damaged town center of Gojome, while population growth was concentrated mainly in the southern part of Akita City. In contrast, the Higashidori, Hiroomote, and Narayama Districts, where Akita Prefecture 17 reported the highest numbers of damaged houses, did not show clear population decrease. Marked depopulation occurred in several districts with comparatively fewer damaged houses. These patterns support the view of Namikawa et al. 25 that post-flood out-migration is influenced by factors beyond physical housing damage alone, even in small- to medium-scale floods.
Some meshes within the inundated area showed population increases. This result indicates that, despite the clear future flood risk, residential inflow may occur, which can increase the number of people exposed to future flooding.
3.2. Questionnaire Survey
Figures 4 and 5 show the survey meshes. Of the 1,500 questionnaires mailed, 353 were returned. After excluding blank forms, 350 were valid, resulting in a valid response rate of 23.3%. Respondents included 61.0% men and 39.0% women. The age distribution was 1.5% in their 30s, 4.7% in their 40s, 13.1% in their 50s, 29.2% in their 60s, and 51.6% aged 70 or older. Most respondents resided in Akita City (79.4%), with the remainder in Gojome Town (20.6%). Only four households reported relocating because of flood damage, which limited the possibility of comparative analysis between resettled and non-resettled households.
3.2.1. Results on Characteristics of Respondents
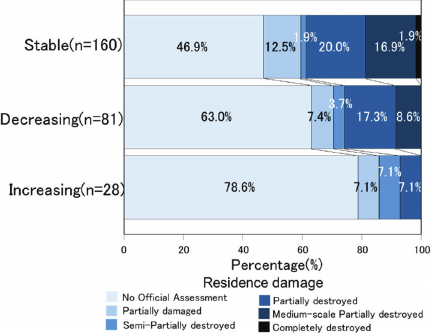
Fig. 6. Residence damage.
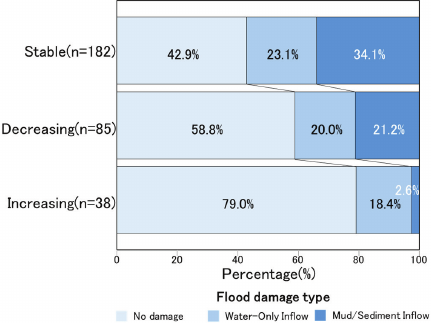
Fig. 7. Flood damage type.
Attributes and damage-related characteristics of respondents were aggregated for the three population-change clusters and tested for significance using \(\chi^{2}\) tests or one-way ANOVA. Variables with significant inter-cluster differences are shown in Figs. 6–13. At the 5% level, residence damage (Fig. 6), changes in expenditure (Fig. 8), damage amount relative to household income (Fig. 10), and score of stress (Fig. 11) differed significantly. Flood damage type (Fig. 7), changes in savings (Fig. 9), occupation (Fig. 12), and years of residence (Fig. 13) differed at the 1% level.
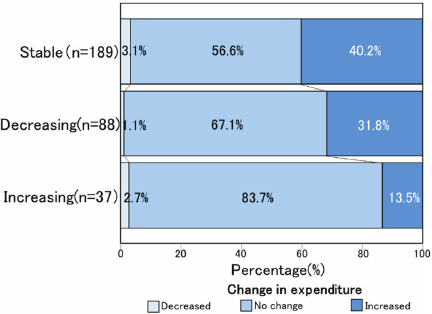
Fig. 8. Change in expenditure.
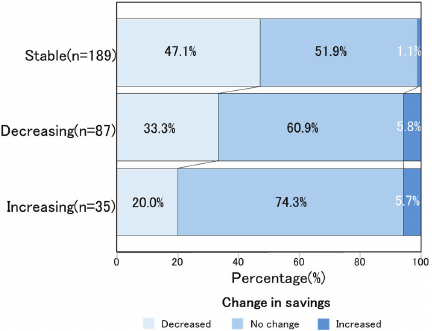
Fig. 9. Change in savings.
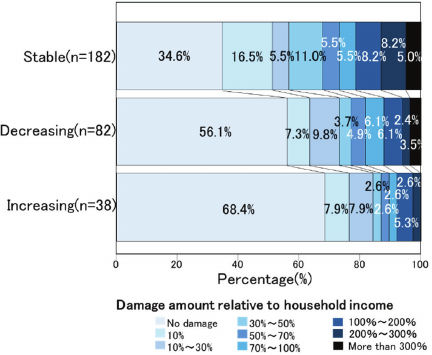
Fig. 10. Damage amount relative to household income.
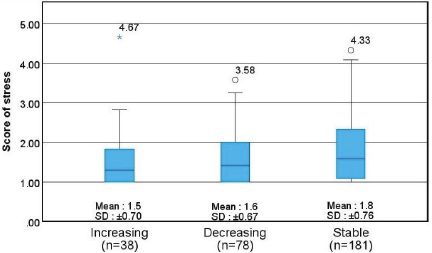
Fig. 11. Score of stress.
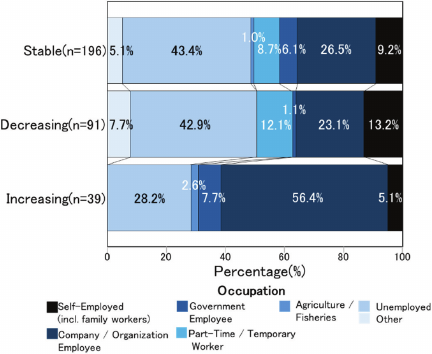
Fig. 12. Occupation.
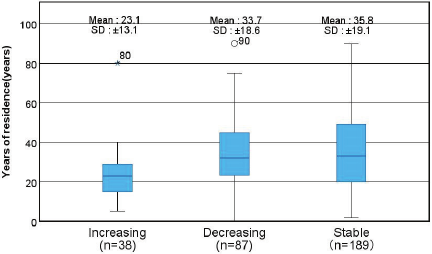
Fig. 13. Years of residence.
Figure 6 shows residence damage severity by cluster. In the stable cluster, 1.9% of households were classified as completely destroyed, 16.9% as medium-scale partially destroyed, and 20.0% as partially destroyed, resulting in 38.8% of households with damage at least at the partially destroyed level. In the decreasing cluster, no household was completely destroyed, and 25.9% were in the partially destroyed or worse categories. In the increasing cluster, no household was completely destroyed or medium-scale partially destroyed, and only 7.1% were classified as at least partially destroyed. Therefore, the proportion of severely damaged households was highest in the stable cluster, lower in the decreasing cluster, and lowest in the increasing cluster.
All three clusters showed approximately 20% “inundation-only” cases. However, the proportion of sediment intrusion was highest in the stable cluster and lowest in the increasing cluster (Fig. 7).
Flood impacts on household finances varied across clusters. The stable cluster had the highest proportion of respondents reporting increased expenditure (Fig. 8), reduced savings (Fig. 9), and losses exceeding 300% of annual income (Fig. 10). In contrast, the increasing cluster consistently experienced the lowest financial burden. Average stress scores followed a similar pattern, with the highest levels in the stable cluster and the lowest in the increasing cluster (Fig. 11). These results suggest that greater physical damage is associated with higher psychological distress.
Overall, residents in the stable cluster experienced the most housing damage, financial strain, and stress. Those in the increasing cluster experienced the least, while the decreasing cluster fell in between. These differences suggest that economic and psychological effects of flood damage persist for households that remain in severely affected areas. The increasing cluster had a significantly higher proportion of company employees and a much shorter average residence period (Figs. 12 and 13). This indicates that meshes in this cluster are likely newer residential areas with working-age households, which helps explain why population can increase even after a documented inundation event.
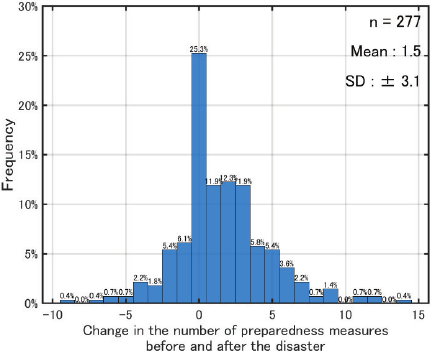
Fig. 14. The change in the number of preparedness measures.
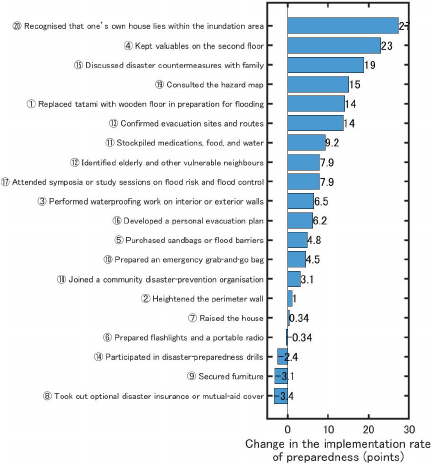
Fig. 15. Change in the implementation rate of preparedness measures.
3.2.2. Changes in Preparedness Measures
A histogram of the change in the number of preparedness measures per respondent before and after the disaster (Fig. 14) shows a mean increase of 1.5 measures, indicating that preparedness generally increased after the event, even in a small- to medium-scale flood setting. For each of the 20 items, the difference between pre- and post-flood implementation rates was calculated, ranked by magnitude, and presented in Fig. 15. Respondents who left more than half of the items blank were excluded from this analysis.
The ranking shows significant variability. The largest increases occurred in soft measures, such as “Recognized that one’s own house lies within the inundation area” (Item 20), “Discussed disaster countermeasures with family” (Item 15), and “Consulted the hazard map” (Item 19). In contrast, hard measures to prevent inundation, such as “Raised the house” (Item 7) and “Performed waterproofing work on interior or exterior walls” (Item 3), showed smaller increases. Costlier actions intended to speed post-flood recovery, such as “Kept valuables on the second floor” (Item 4) and “Replaced tatami with wooden floor in preparation for flooding” (Item 1), ranked among the top five. After the flood, households tended to prefer hard measures that support rapid recovery rather than those that prevent inundation, while also assigning equal importance to soft measures.
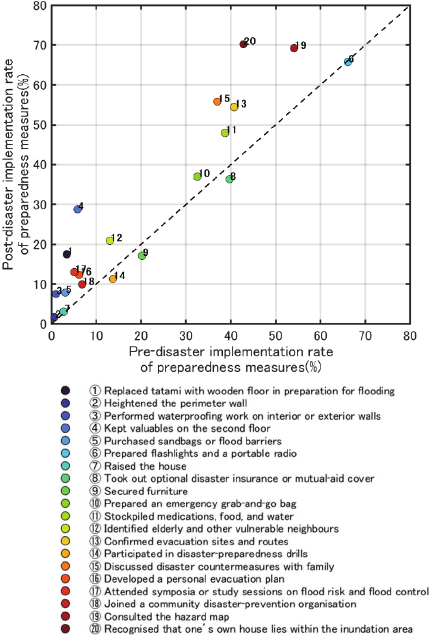
Fig. 16. Pre- and post-disaster implementation rate of preparedness measures.
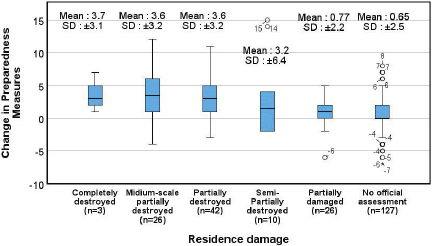
Fig. 17. Relationship between changes in preparedness measures and residence damage.
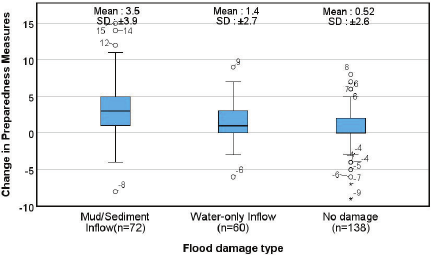
Fig. 18. Relationship between changes in preparedness measures and flood damage type.
Figure 16 shows a scatter plot with the pre-disaster implementation rate of each preparedness measure on the x-axis and the post-disaster implementation rate on the y-axis. Examination of the post-disaster rates indicates that even for the housing-related measures with the highest uptake (“Kept valuables on the second floor” (Item 4) and “Replaced tatami with wooden floor in preparation for flooding” (Item 1)) actual implementation remained below 30%. Because similar flood damage may occur again in the affected area, it is necessary to promote household-level housing measures that individuals can take, whether through public assistance or self-help.
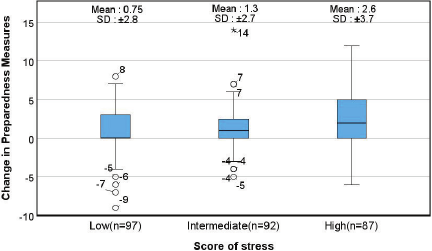
Fig. 19. Relationship between changes in preparedness measures and score of stress.
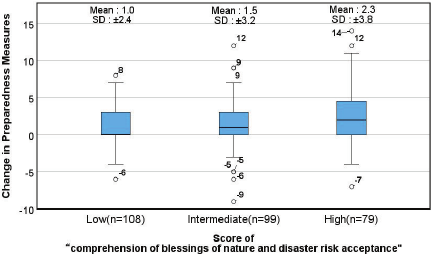
Fig. 20. Relationship between changes in preparedness measures and score of community attachment and disaster heritage.
Figures 17 and 18 show preparedness change in relation to residence damage and flood damage type, respectively. One-way ANOVA shows significant differences at the 1% level in both cases. Preparedness increased most among households that experienced mud and sediment inflow, likely because post-disaster cleanup was prolonged and labor-intensive, which increased motivation to reduce future damage. Households with greater overall damage showed a similar pattern.
Respondents were divided into tertiles based on stress-scale scores and the “community attachment and disaster heritage” factor of the disaster coexistence culture attitude scale. Figs. 19 and 20 present the relationships between these variables and changes in preparedness. ANOVA showed significant differences at the 1% level for stress and at the 5% level for disaster-culture attitude, confirming positive correlations: higher stress or cultural-attitude scores were associated with greater increases in preparedness.
By contrast, the three population-change clusters showed no significant differences in preparedness changes. No significant correlation was found between preparedness change and other respondent attributes. These results indicate that preparedness behavior depends less on regional demographic characteristics or general household attributes, and more on direct disaster experience and individual psychological or cultural factors. Therefore, even in areas with clear future flood risk, households without direct disaster experience may remain reluctant to improve their preparedness measures.
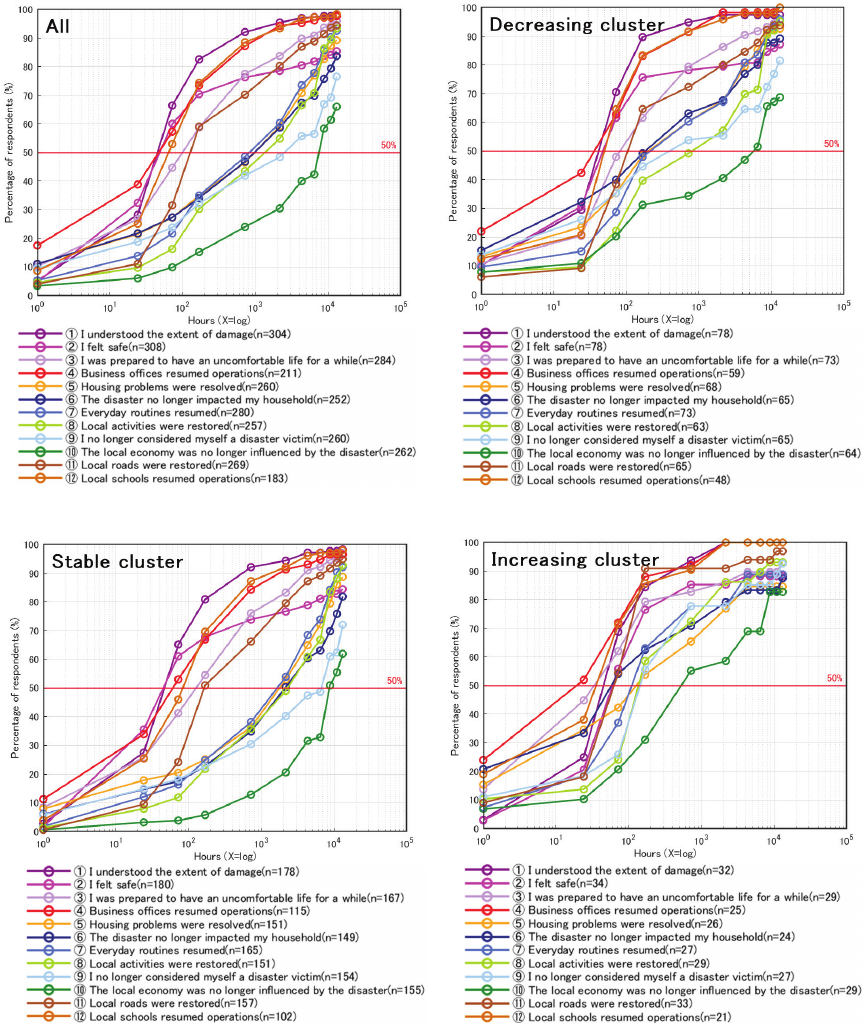
Fig. 21. Recovery and reconstruction calendar of the July 2023 Akita heavy rain.
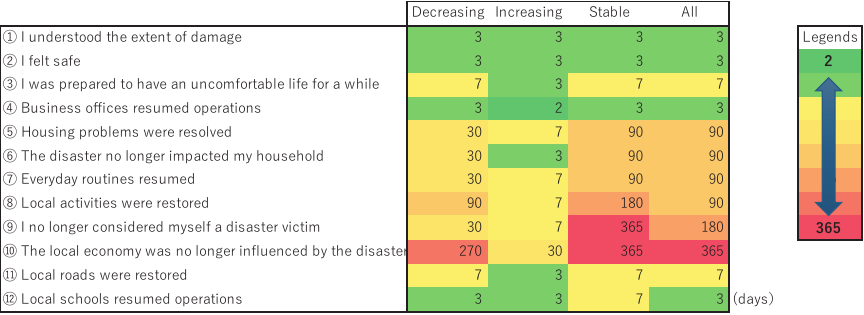
Table 1. The number of hours required for each item to reach the 50% attainment threshold.
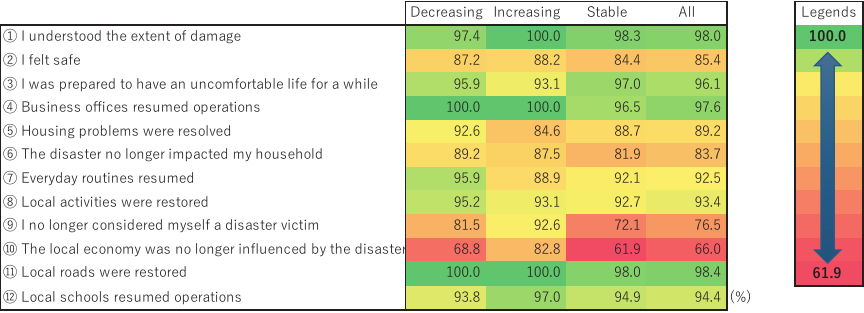
Table 2. The attainment levels of each item at the survey time point (approximately one year and eight months after the disaster).
3.2.3. Results of the Recovery and Reconstruction Calendar
Figure 21 shows the results of the recovery and reconstruction calendar. Cumulative percentages were calculated after excluding non-respondents for each milestone. Table 1 presents the number of hours required for each item to reach the 50% attainment threshold. At the aggregate level, “① I understood the extent of damage,” “② I felt safe,” and “③ I was prepared to have an uncomfortable life for a while” recovered first, which aligns with previous studies 8,9. Recovery curves for the other items varied. “④ Business offices resumed operations,” “⑫ Local schools resumed operations,” and “⑪ Local roads were restored” (the relatively “hard” aspects) also reached 50% in about 102 hours, similar to the first three items. In contrast, “⑥ The disaster no longer impacted my household,” “⑦ Everyday routines resumed,” “⑧ Local activities were restored,” “⑨ I no longer considered myself a disaster victim,” and “⑩ The local economy was no longer influenced by the disaster” (the “soft” dimensions) took longer, requiring more than 103 hours to exceed 50%. This pattern is similar to that observed for the Kii Peninsula torrential rain disaster 8.
Previous work 9 has argued that, in earthquakes and large-scale floods, life recovery generally follows this order: first, victims prepare for a period of discomfort and understand the extent of damage; second, they feel safe, and offices and schools reopen; third, daily life stabilizes, housing issues are resolved, and personal finances are no longer affected by the disaster; fourth, individuals stop identifying as victims; and fifth, the local economy is no longer affected by the disaster. Our results show that, in the Akita heavy rainfall case, stages one and two were perceived at about the same time, followed by stages three, four, and five in sequence.
Recovery after small- to medium-scale floods is characterized by a faster initial restoration of hard aspects compared to earthquakes or large-scale floods, while the recovery of soft aspects takes a similar amount of time as in large-scale floods. Across all three clusters, more than 50% of respondents reported milestones such as “① I understood the extent of damage,” “⑪ Local roads were restored,” and “④ Business offices resumed operations” within one week, indicating that these hard aspects were perceived quickly. However, the pace of recovery for other items varied. The increase cluster recovered the fastest, with more than 50% of respondents reporting recovery for all items except “⑩ The local economy was no longer influenced by the disaster” in about 102 hours. The decreasing cluster was slower than the increase cluster but still surpassed 50% for all items except “⑩ The local economy was no longer influenced by the disaster” by 103 hours. The stable cluster was the slowest, taking more than 103 hours to exceed 50%. Differences between clusters were most evident in the perceived recovery of soft aspects related to stages (3), (4), and (5).
Table 2 presents the attainment levels for each item at the survey time point, approximately one year and eight months after the disaster. Several items had not reached 90%, showing that the effects of the flood continued. The perceptions “⑨ I no longer considered myself a disaster victim” and “⑩ The local economy was no longer influenced by the disaster” remained lower than other items, with about 30% of respondents still not feeling recovered. In small- to medium-scale floods, because large-scale destruction of housing and infrastructure is limited, hard aspects recover quickly. In contrast, soft aspects—“⑥ The disaster no longer impacted my household,” “⑦ Everyday routines resumed,” “⑧ Local activities were restored,” “⑨ I no longer considered myself a disaster victim,” and “⑩ The local economy was no longer influenced by the disaster”—recover gradually in stages, similar to other hazards such as earthquakes and large-scale floods. Therefore, even after water recedes and roads and buildings are restored, affected areas need long-term support for the economy, psychological well-being of victims, and community activities at a scale similar to that required for large-scale floods.
Disaster case management 32, which supports victims in their independent recovery, has received increasing attention in recent years. As flood damage becomes more frequent, promoting self-reliant reconstruction in areas affected by small- and medium-scale floods is expected to encourage the use of sustainable and adaptive countermeasures when large-scale assistance is unavailable.
4. Conclusion
This study examined post-disaster population dynamics and the life reconstruction process of victims affected by small- to medium-scale floods, which are expected to occur more frequently. The principal findings are as follows:
-
1)
Even without house washouts, the inundated area in this case experienced a nighttime population decline of approximately 5%, while the most severely affected 500 m mesh recorded a 30% decrease.
-
2)
Whereas earlier studies on large-scale floods generally reported only population losses, this event also included areas where the population increased by up to 40%, indicating that exposure can grow even when flood damage occurs.
-
3)
\(K\)-means clustering grouped meshes into “increasing,” “decreasing,” and “stable” categories. Households in the increasing group experienced the least residence damage, financial burden, and psychological stress. Those in the stable group experienced the most, while the decreasing group fell between these two. This pattern suggests that residents who remain may face considerable economic and emotional strain.
-
4)
Increasing meshes corresponded to newly developed residential zones with relatively short residence histories and a high proportion of middle-aged salaried workers. This pattern suggests that these areas may experience elevated future exposure even after inundation.
-
5)
Preparedness measures increased by an average of 1.5 items, indicating that experiencing a flood, even at a moderate scale, leads to the adoption of additional measures.
-
6)
Increases differed by type of measure. Soft measures, such as “recognizing that one’s home lies within the inundation area,” “discussing disaster countermeasures with family,” and “consulting the hazard map,” rose substantially. In contrast, expensive hard measures to prevent inundation increased only modestly. However, hard measures that support post-flood recovery, such as replacing tatami with flooring or storing valuables on the second floor, rose significantly. These trends indicate a preference for actions that support faster recovery rather than those that prevent floodwater entry. Furthermore, even after the disaster, the implementation rate of structural (hard) measures remains below 30%, highlighting the need to further promote these measures through both self-help and public assistance.
-
7)
Greater increases in preparedness were linked to households that experienced mud or sediment inflow, sustained damage above the “partially collapsed” level, and reported higher stress and stronger community attachment. This suggests that, without direct damage, households may be reluctant to change their behavior despite underlying risk.
-
8)
Physical recovery of infrastructure and dwellings progressed more rapidly than in large-scale floods because there was no widespread structural destruction. However, recovery of finances, psychological well-being, and community activities occurred on a timeline similar to that of larger events. Therefore, long-term support for economic revitalization, mental health care, and community cohesion remains essential even when physical infrastructure is restored quickly.
Small- to medium-scale floods can cause population decline and impose significant economic and psychological burdens, requiring assistance similar to that needed after large-scale floods. However, as flood damage becomes more frequent and public resources for structural measures are limited, it is unrealistic to provide comprehensive support to every affected household. Residents and communities must build their own capacity for life reconstruction, adopt knowledge and preparedness that support soft recovery, and develop an ethos of coexistence with future floods. It is essential to increase support initiatives, such as disaster case management.
Limitations remain. Because the survey included only households that continued to reside in the affected area, it did not capture those who relocated. As a result, the full demographic impact of small- to medium-scale floods and the complete range of life-reconstruction trajectories could not be examined. Future research should compare movers and stayers to better explain the drivers of population movement in such events.
In addition, the questionnaire survey relied on a household roster compiled before the disaster, so it did not include individuals who moved into the affected area after the event. Consequently, newly arrived residents identified in the population analysis were excluded from the survey. Future studies could use household rosters updated after the disaster to identify post-disaster in-migrants and conduct targeted questionnaire surveys with this group. This approach would improve understanding of post-disaster population movements and regional recovery processes, and provide insights relevant to disaster-prevention policies in affected areas.
Acknowledgments
This research was conducted by the 2024 Disaster Resilience Co-Creation Research Project (Principal Investigator: Shosuke Sato) at the International Research Institute of Disaster Science, Tohoku University. We would like to express our gratitude to them.
- [1] Intergovernmental Panel on Climate Change (IPCC), “Sixth assessment report (AR6) cycle,” 2021.
- [2] Japan Meteorological Agency, “Global warming projection information,” Vol.9, Chapter 3, Section 3, pp. 30-31, 2017.
- [3] G. J. Taylor, L. Jorge, and K. A. Divine, “Quantifying hazard resilience by modeling infrastructure recovery as a resource-constrained project scheduling problem,” Natural Hazards and Earth System Science, Vol.24, No.7, pp. 2285-2302, 2024. https://doi.org/10.5194/nhess-24-2285-2024
- [4] W. G. Peacock, S. Van Zandt, Y. Zhang, and W. E. Highfield, “Inequities in long-term housing recovery after disasters,” J. of the American Planning Association, Vol.80, No.4, pp. 356-371, 2015. https://doi.org/10.1080/01944363.2014.980440
- [5] T. Yamada and Y. Karatani, “A study on trend analysis of the social scientific study of the flood considering the time axis and the identity,” J. of Japan Society for Natural Disaster Science, Vol.33, No.3, pp. 271-292, 2014 (in Japanese).
- [6] Kahoku Shimpo, “Many flood victims remain at home in Akita; Fears of disaster-related deaths before the harsh winter as strict ‘Deemed Temporary Housing’ rules curb uptake,” October 31, 2023.
- [7] S. Tatsuki, H. Hayashi, K. Yamori, R. Noda, K. Tamura, and R. Kimura, “Model building and testing of long-term life recovery processes of the survivors of the 1995 Kobe earthquake: Structural equation modeling (SEM) of the 2003 Hyogo prefecture life recovery survey,” J. of Social Safety Science, No.6, pp. 251-260, 2004 (in Japanese). https://doi.org/10.11314/jisss.6.251
- [8] R. Kimura and S. Ohtomo, “Life reconstruction processes of flood disaster victims in semimountainous area – A case study of Kii peninsula flood disaster (the Typhoon No.12 in 2011) in Japan –,” J. of Social Safety Science, No.21, pp. 137-147, 2013 (in Japanese). https://doi.org/10.11314/jisss.21.137
- [9] R. Kimura, H. Hayashi, S. Tatsuki, and K. Tamura, “Psychologically defined life reconstruction processes of disaster victims in the 1995 Hanshin-Awaji Earthquake,” J. of Social Safety Science, No.6, pp. 241-250, 2004 (in Japanese). https://doi.org/10.11314/jisss.6.241
- [10] S. Tsuboi, “A study on the life reconstruction and evacuation behavior in Typhoon 19 Hagibis – A case study of Utsunomiya city TOCHIGI Prefecture –,” Papers on Environmental Information Science, Vol.33, No.3, pp. 271-292, 2014 (in Japanese). https://doi.org/10.11492/ceispapers.ceis34.0_55
- [11] T. Kondo, M. Banba, and R. Fujii, “Relationship analysis be-tween residents’ risk perception and housing mitigation & recovery actions in flood-prone area – The case of Mabi town, Kurashiki city after the heavy rain event of July 2018 in Western Japan –,” J. of the City Planning Institute of Japan, Vol.58, No.1, pp. 58-69, 2023 (in Japanese). https://doi.org/10.11361/journalcpij.58.58
- [12] S. Watanabe, S. Fujimoto, Z. Wakiyama, K. Ono, N. Imai, S. Higuchi, and Y. Ishiyama, “Study on rehabilitation of houses after flood events part 1: Discussion from the viewpoint of construction works and costs,” J. of Architecture and Planning, Vol.88, No.809, pp. 2179-2187, 2023 (in Japanese). https://doi.org/10.3130/aija.88.2179
- [13] Climate Change Adaptation Information Platform (A-PLAT). https://adaptation-platform.nies.go.jp/ [Accessed July 30, 2025]
- [14] N. Matsubara, “Grasping dynamic population by ‘Mobile Spatial Statistics’: From the viewpoint of tourism disaster and stranded persons,” J. of Information Processing and Management, Vol.60, No.7, pp. 493-501, 2017 (in Japanese). https://doi.org/10.1241/johokanri.60.493
- [15] F. Sato, M. Chikaraishi, and A. Fujiwara, “Independent component analysis of recovery and reconstruction process by using mobile spatial statistics: A case study of landslide disaster in August 2014, Hiroshima,” J. of Social Safety Science, CD-ROM, Vol.55, 2017 (in Japanese).
- [16] Y. Ooyabu, M. Terada, T. Yamaguchi, S. Iwasaki, A. Hagiwara, and D. Koizumi, “Reliability assessment of mobile spatial statistics,” Technical J. of NTT Docomo, Vol.20, No.3, 2012 (in Japanese).
- [17] Akita Prefecture, “damage situation caused by the heavy rainfall beginning July 14, 2023 (44th Report),” 2024 (in Japanese).
- [18] S. Seto and J. Okuyama, “Longitudinal study on the psychological. impacts of the record-breaking heavy rainfall in Akita prefecture since July 2023: Six-month follow-up survey,” FY 2023 Research Results Report of the Study Group on the Accuracy and Advanced Utilization of Meteorological and Climatological Information in the Tohoku Region, pp. 34-37, 2024 (in Japanese).
- [19] Social Welfare Corporation, Akita City Council of Social Welfare, “Community Mutual Support Center.” https://www.akita-city-shakyo.jp/sasaeai/ [Accessed July 9, 2025]
- [20] Akita Prefecture, “Damage situation caused by the heavy rainfall beginning May 18, 2018,” 2018 (in Japanese).
- [21] Akita Prefecture, “Damage situation caused by the heavy rainfall beginning August 9, 2022 (11th Report),” 2022 (in Japanese).
- [22] B. Hong, B. J. Bonczak, A. Gupta, and C. E. Kontokosta, “Measuring inequality in community resilience to natural disasters using large-scale mobility data,” Nature Communications, Vol.12, Article No.1870, 2021.
- [23] Great East Japan Earthquake Life Reconstruction Survey Team, “Life reconstruction survey of the Great East Japan Earthquake five years after the disaster: 2016 survey results report,” 2018 (in Japanese).
- [24] S. Sato, “Primary study of a scale of attitude toward culture of living with disaster risk; Application analysis and verification toward a scale development,” J. of Social Safety Science, No.39, pp. 195-202, 2021 (in Japanese). https://doi.org/10.11314/jisss.39.195
- [25] K. Namikawa, N. Koyama, and T. Yamada, “Analysis of impact of catastrophic flooding on the local population and its cause,” Advances in River Engineering, Vol.28, pp. 385-390, 2022 (in Japanese). https://doi.org/10.11532/river.28.0_385
- [26] Okayama Prefecture, “Investigation report on the July 2018 heavy rain disaster,” 2019 (in Japanese).
- [27] Joso City Flood Response Investigation Committee, “Investigation report on the response to the 2015 Kinugawa river flood in Joso city,” 2016 (in Japanese).
- [28] Kurashiki City, “Reconstruction plan for the Mabi district,” 2024 (in Japanese).
- [29] Ministry of Land, Infrastructure, Transport and Tourism, Kanto Regional Development Bureau, Shimodate River Office, “Reframing the Kinu River Emergency Countermeasure Project and the Flood-Risk-Aware Society,” 2022 (in Japanese).
- [30] Joso City, “Joso City’s Reconstruction Plan: Five years of progress,” 2021 (in Japanese).
- [31] Ministry of Land, Infrastructure, Transport and Tourism, Tohoku Regional Development Bureau, Akita River and National Highway Office, “Flood-disaster countermeasure project for the lower Omono River Basin,” 2024 (in Japanese).
- [32] Cabinet of Japan, “Guidelines for the implementation of disaster case management,” 2024 (in Japanese).
This article is published under a Creative Commons Attribution-NoDerivatives 4.0 Internationa License.