Paper:
Survey and Analysis of Teachers’ Disaster Risk Reduction Literacy—Basic Knowledge to Improve Disaster Risk Reduction Education Programs—
Toshimitsu Nagata*,†, Reo Kimura**
 , and Shoji Ohtomo***
*Niigata Local Meteorological Office, Japan Meteorological Agency (JMA)
1-2-1 Misaki-cho, Chuo-ku, Niigata, Niigata 950-0954, Japan
†Corresponding author
**School of Human Science and Environment, University of Hyogo
Himeji, Japan
***College of Interhuman Symbiotic Studies, Kanto Gakuin University
Yokohama, Japan

According to the Ministry of Education, Culture, Sports, Science and Technology, safety education in Japanese schools comprises three domains—disaster safety, traffic safety, and daily-life safety—as defined in the School Health and Safety Act. This study focuses on disaster safety, a foundational issue that influences all three domains and involves large-scale impacts requiring educational intervention. It aims to clarify the structural characteristics of how teachers, who play a central role in school safety, cognitively evaluate diverse crisis events. Teachers who participated in school safety instructor training programs in Miyagi, Okayama, and Niigata Prefectures were surveyed regarding 20 crisis events. Four psychological constructs—perceived likelihood (Q1), perceived impact (Q2), crisis imagery (Q3), and self-efficacy (Q4)—were measured through corresponding questionnaire items, and a risk perception score (R score), calculated as Q1 × Q2, was included in the analysis. The analysis revealed a significant positive correlation between Q1 and Q2, indicating that teachers tend to evaluate the frequency of occurrence and expected degree of damage in an interrelated manner. A significant positive correlation was also observed between Q3 and Q4, suggesting that events that can be vividly imagined tend to enhance self-efficacy. Furthermore, a significant positive correlation between R score and Q4 indicated that both tended to be rated highly for large-scale disasters but relatively low for low-frequency hazards. Self-efficacy was found to be generally lower than risk perception, implying a potential gap between recognition and action. Notably, a “Quadrant IV group,” in which self-efficacy remained low despite reaching a moderate level of risk perception, was identified, and these crisis events were recognized as priority targets for educational intervention. These findings indicate that this analytical framework is effective for comprehensively understanding the psychological structure of disaster risk reduction (DRR) literacy. It can also be applied to assess learning outcomes for both teachers and students, providing foundational insights for improving the “recognition–judgment–action” learning process in DRR education.
1. Introduction
In recent years, Japan has experienced a series of diverse natural hazards, with their impacts becoming increasingly severe and widespread. Since the 2011 Great East Japan Earthquake, the nation has witnessed recurrent disasters such as typhoons, torrential rains, earthquakes, tsunamis, volcanic eruptions, and heavy snowstorms, leading to an increasing demand in educational settings to strengthen preparedness for such hazards. The White Paper on Disaster Management 2025, issued by the Cabinet Office, emphasizes, against this backdrop, the importance of building a society in which “one’s own life is protected by oneself,” by encouraging every citizen to perceive disasters as a personal matter and to take concrete protective actions 1.
School safety in Japan is defined under the School Health and Safety Act as comprising three domains: disaster safety, traffic safety, and daily-life safety. Furthermore, the Third Basic Plan for the Promotion of School Safety issued by the Ministry of Education, Culture, Sports, Science and Technology (MEXT) states that school safety should be understood comprehensively across these three domains, and that fostering students’ ability to anticipate danger, make judgments, and act appropriately is essential, with teachers positioned as the central actors responsible for this process 2.
Natural hazards represent a critical concern across these three domains, and understanding and responding to disaster safety is a core component that underpins school safety as a whole. Consequently, educators in schools must address risks across all three domains and provide appropriate guidance to students; among these domains, however, disaster safety (natural hazards) is distinguished by the scale and severity of its potential impacts. Once a natural hazard occurs, it not only poses a direct threat to students’ lives but also compromises safety during commutes and school operations through disruptions to transportation and damage to school facilities, and may further jeopardize the continuity of educational activities. Strengthening teachers’ awareness of and capacity to respond to natural hazards is therefore indispensable for maintaining and enhancing safety at the whole-school level.
Simultaneously, despite advancements in disaster prevention education across the nation since the Great East Japan Earthquake, many studies have repeatedly pointed out that “the acquisition of knowledge does not necessarily lead to improved judgment or action” 3. Psychological factors contributing to this gap include the relationship between perceived likelihood and perceived impact of hazards 4, the importance of concretely imagining damage in relation to oneself 5, and the presence or absence of confidence in one’s ability to act appropriately during a disaster (disaster-related self-efficacy) 6. Experimental studies have further demonstrated instances where individuals fail to adopt protective action despite having relevant knowledge, indicating that such knowledge–action gaps can increase behavioral risk 7. Nakazawa et al. established, based on nationwide survey data, that the way in which disaster scenarios are cognitively represented is significantly related to disaster preparedness behavior, and quantitatively demonstrated that crisis imagery contributes to behavioral intention 8. Moreover, previous studies have pointed out that teachers’ crisis recognition and decision-making abilities influence both the level of school safety and the effectiveness of disaster prevention education 9,10,11.
In response to these challenges, MEXT has published the Practical Guide to Disaster Prevention Education 12,13, which presents to schools a practical direction for education that emphasizes proactive actions based on risk prediction and judgment. In their previous studies, the authors have also developed disaster prevention education programs based on the ADDIE (Analysis, Design, Development, Implementation, Evaluation) model and verified their effectiveness through practical research 14,15. These findings collectively indicate that understanding disaster response capacity in educational settings requires a comprehensive perspective that integrates psychological factors such as risk perception, crisis imagery, and self-efficacy, rather than relying solely on knowledge and training.
In particular, a substantial body of research has accumulated regarding these psychological factors among students. Kobayashi and Tanaka 5 pointed out that vividly envisioning personal damage enhances evacuation intention, and Nakazawa et al. 8 proved, using nationwide survey data, that crisis imagery is significantly associated with behavioral intention. Experimental research 7 has also pointed to situations in which knowledge does not translate into action, and Sato and Fujioka 16 reported that disaster education programs can improve decision-making and self-efficacy.
By contrast, studies that systematically analyze these psychological factors among teachers—the central actors responsible for school safety—remain scarce. Toyosawa et al. 17 revealed significant disparities in teachers’ crisis recognition and initial response capabilities, and emphasized the need for training and educational support tailored to the realities of school practice. Against this background, empirically identifying the psychological factors that constitute teachers’ DRR literacy—particularly those related to initial response during disasters—and clarifying their structural characteristics are urgent tasks for both improving educational practice and forming a foundation for school safety policy.
2. Objective of This Study
Building on the issues outlined in the previous section, this study aims to analyze and clarify the structural characteristics of disaster risk reduction (DRR) literacy among teachers within a common analytical framework across diverse crisis events, with a particular focus on natural hazards. Specifically, four psychological constructs—perceived likelihood (P), perceived impact (C), crisis imagery, and self-efficacy—were measured using corresponding subjective rating items (Q1–Q4). Additionally, a risk perception score (\(\mathrm{P} \times \mathrm{C}\)) was calculated, and the interrelationships among these measures were statistically examined. This approach enabled a structural understanding of how teachers perceive and evaluate various crisis events.
Table 1. Principal disaster experiences and geographic characteristics of the three prefectures.

3. Theoretical Background and Analytical Framework for DRR Literacy
This section reviews previous research on evacuation decision-making and disaster response behavior to elucidate the theoretical foundations of the analyses in this study. It then introduces an analytical framework for evaluating the psychological factors that constitute teachers’ disaster risk reduction (DRR) literacy. Numerous studies have demonstrated that behavioral intentions during disasters are shaped not merely by the amount of knowledge one possesses but by psychological factors such as risk perception, crisis imagery, and self-efficacy.
Regarding risk perception, Yamaguchi et al. 18 revealed that biases in risk perception influence evacuation intentions. Ohtomo et al. 19, based on a survey of residents affected by heavy rainfall disasters, reported that feelings of crisis and damage anticipation lead to evacuation behavior, whereas knowledge alone cannot adequately explain behavioral intentions. Concerning crisis imagery, Kobayashi et al. 5 demonstrated that evacuation intentions become stronger when individuals can vividly imagine personal damage, and Nakazawa et al. 8 also reported a significant association between crisis imagery and behavioral intentions based on a nationwide survey.
Self-efficacy refers to a situation-specific psychological factor indicating the extent to which individuals believe they can carry out the actions required during a disaster. Motoyoshi 4 established that self-efficacy is a determinant of proactive behavior during disasters, and Kakimoto et al. 20, drawing on PMT, demonstrated that behavior does not occur when self-efficacy is low even if threat appraisal is high 21.
PMT is a prominent theoretical framework in behavioral science explaining how individuals evaluate threats and choose coping actions when confronted with hazardous events. Decision-making is organized around two components: threat appraisal and coping appraisal. Based on insights from previous studies and PMT, this study develops an operational framework for measuring DRR literacy. Specifically, perceived likelihood (P) and perceived impact (C)—which form the basis of behavioral intentions—were measured, and their product, the risk perception score (\(r = \mathrm{P} \times \mathrm{C}\)), was treated as a proximate indicator of threat appraisal. Additionally, by positioning “crisis imagery” and “self-efficacy” as measurement items, an analytical framework was established to quantitatively capture the multifaceted structure of DRR literacy.
4. Questionnaire Survey
A questionnaire survey was administered to teachers, and the results were subsequently analyzed. School safety is structured into three domains: disaster safety, traffic safety, and daily-life safety, as defined by MEXT. Based on this framework, the present study employed 20 crisis events spanning all three domains. This design enabled teachers to evaluate disaster-related risks in relation to everyday school safety risks and to understand how disaster safety is positioned within the broader context of school safety. This section delineates the survey methodology and presents an overview of the analysis, examining the characteristics of disaster literacy through the relative evaluation structure of each crisis event. Furthermore, the observed differences among the three domains were identified as important for future comparative analysis.
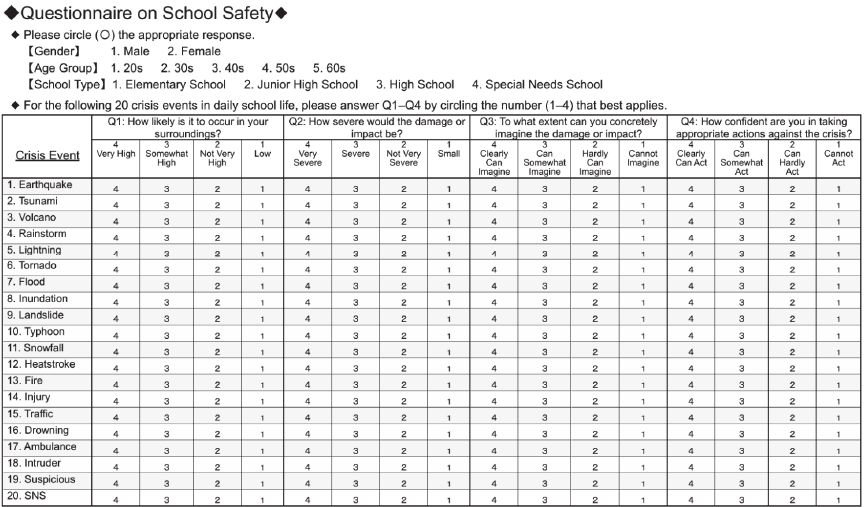
Fig. 1. Questionnaire items on school safety (20 crisis events).
4.1. Target of the Survey
The teachers surveyed in this study were those who consented to participate, and who worked in Miyagi, Okayama, and Niigata Prefectures, and served in roles involving safety education or school crisis management. Other school staff, such as clerical staff and school nurses, were not included as respondents.
The authors present the complete ethical considerations as follows. With the consent of the Prefectural Boards of Education, the survey was targeted only at the respondents who consent to participate in this study. Personally identifiable information was not collected, and the data were anonymized accordingly.
Each of the three prefectures targeted in this survey has different disaster experiences and specific geographic characteristics (Table 1). First, Miyagi Prefecture is a region that was affected by the 2011 Great East Japan Earthquake and also experienced widespread devastation from windstorms and flooding caused by Typhoon Hagibis (Typhoon No.19, 2019). The region consists of both coastal and inland areas and includes various categories of disasters, such as tsunamis and floods. Okayama Prefecture has experienced extensive windstorm and flood damage resulting from the 2018 Western Japan Heavy Rain and is designated as an area expected to sustain damage by the Nankai Trough Earthquake. The prefecture includes both plains and mountainous areas and is subject to different types of hazards, such as inland flooding, river flooding, and landslides. Niigata Prefecture, a region prone to heavy snowfall, is also vulnerable to tsunamis and liquefaction resulting from the 2024 Noto Peninsula Earthquake, and has laso experienced widespread windstorm and flood damage caused by the torrential rain in August 2022. The prefecture’s geographical composition includes regions characterized by heavy snowfall, coastal lowlands, and hilly/mountainous areas, each presenting various risks, such as earthquakes, windstorms, flooding, and snow damage.
Previous studies have pointed out the effects of psychological factors, such as perception bias in understanding the disaster risk information 18, perceived personal relevance of damage 5, and self-efficacy on disaster prevention awareness and risk perception, highlighting how local differences could influence these factors. Based on such knowledge, the differences in disaster experiences and the geographical conditions in each region are expcted to be reflected in the structure of DRR literacy. These descriptions of local disaster experiences and geographical characteristics are intended to provide contextual background for the survey areas and are not based on specific disaster statistics, nor are they intended for strict regional comparison. Therefore, this survey does not aim at nationwide generalization but to focus on regions with different disaster experiences and geographical conditions and clarifies their structural characteristics empirically.
4.2. Questionnaire Items
The questionnaire used in this study targeted crisis events across the three domains of school safety and measured four psychological constructs—perceived likelihood, perceived impact, crisis imagery, and self-efficacy—using corresponding subjective rating items (Q1–Q4) (Fig. 1). These constructs were considered necessary for achieving the objective of this study, namely to clarify the structure of teachers’ disaster risk reduction literacy; therefore, Q1–Q4 were adopted as evaluation items that directly capture each construct.
Q1 asks, “How likely is it to occur in your surroundings?” Q2 asks, “How severe would the damage or impact be?” Q3 asks, “To what extent can you concretely imagine the damage or impact?” and Q4 asks, “How confident are you in taking appropriate actions against the crisis?”
These indices were set based on previous studies. Q1 and Q2 are said to be indispensable for the formation of behavioral intention 22,23. The product of the two, the \(R\) score, serves as a standard index aligned with the threat-appraisal component of PMT 24,25. Q3 is considered a psychological factor that mediates between knowledge and action 4,5, and Q4 is a factor to determines the subjective behavior; its validity has been confirmed in the educational practices and the scale development 6,26.
Based on the above framework, this study focuses on crisis events involving natural disaster within the broader context of school safety incidents and defines the following 20 types of crisis events: Major Earthquake, Tsunami, Volcanic Eruption, Heavy Rain, Lightning Strike, Tornado, Flood, Inundation, Landslide, Typhoon, Heavy Snowfall, Extreme Heat, Fire, Injury, Traffic Accident, Water Accident, Medical Emergency (Ambulance), Intruder, Suspicious Person, and SNS Harm.
These items were developed with reference to the authors’ previous study 27 and were structured according to the three domains of school safety: disaster safety, traffic safety, and daily-life safety. For each crisis event, Q1–Q4 were rated on a four-point scale without a neutral midpoint. This four-point response format has also been employed in prior studies in the field of psychology 28,29.
4.3. Implementation of the Questionnaire Survey
The questionnaire survey was administered in the three prefectures—Miyagi, Okayama, and Niigata—between 2021 and 2025 (Table 1).
The questionnaire was distributed at registration during training sessions and collected from teachers who consented to participate. The numbers of valid answers were \(n=50\) in Miyagi Prefecture, \(n=42\) in Okayama Prefecture, and \(n=72\) in Niigata Prefecture. The responses were aggregated according to each crisis event, and for each prefecture, the mean values across the 20 crisis events were calculated for the analyses described below.
4.4. Procedure of Analysis
In this study, we analyzed responses to 20 crisis events obtained through a questionnaire survey. In all analyses, event-level mean scores (\(n =20\) per prefecture) served as the units of analysis, based on the four rating items (Q1–Q4). The analytical procedures consisted of four types of analyses, as described in Sections 4.4.1–4.4.4.
4.4.1. Calculation Method for the Risk Perception Score (R Score)
In this subsection, we calculated the risk perception score (\(R\) score) defined in this study and examined its characteristics. The \(R\) score was obtained as an average score for each crisis event based on responses from teachers in the three prefectures (Miyagi, Okayama, and Niigata), and the results were visualized using bar charts. This index allows quantitative comparison of perceived risk across events, enabling characteristics and trends in each prefecture to be identified. Using these results, the authors identify which disasters are strongly recognized and which are relatively disregarded, providing a basis for reviewing educational challenges. Therefore, the authors provide not only the ranking and the difference in values but also insights into how local experiences and geographical backgrounds affect literacy in DRR.
4.4.2. Distribution Characteristics of Risk Perception
In this subsection, we conducted a quadrant analysis using Q1 (perceived likelihood) as the horizontal axis and Q2 (perceived impact) as the vertical axis to examine the characteristics of risk perception. To visualize the structural characteristics of the responses to crisis events, we plotted the 20 events on scatterplots and classified them into four quadrants using the mean values of the horizontal and vertical axes as thresholds. We then conducted correlation and regression analyses, displaying the regression line, correlation coefficient (\(r\)), regression equation, and coefficient of determination (\(R^2\)) on the scatterplots. It should be noted that these correlation analyses were based on event-level mean values rather than the number of individual responses (95% confidence intervals were calculated using Fisher’s \(z\)-transformation, and two-tailed tests were applied).
The four quadrants are termed Quadrant I = high perceived likelihood and high perceived severity (the risk where the perceived likelihood and damage/impact are large), Quadrant II = low perceived likelihood and high perceived severity (the risk where the perceived likelihood is small but the damage/impact is large), Quadrant III = low perceived likelihood and low perceived severity (the risk where the perceived likelihood and damage/impact are small), and Quadrant IV = high perceived likelihood and low perceived severity (the risk where the perceived likelihood is large but the damage/impact is small).
By classifying the crisis events into four quadrants, the tendencies of the risk perception of each crisis event are confirmed. A crisis event located above the regression line indicates the tendency to estimate the damage/impact larger than the occurrence probability. Conversely, a crisis event located below the regression line indicates the tendency to estimate the damage/impact smaller than the occurrence probability. By mapping the crisis events into four quadrants, the authors examine the characteristics and the trends of the risk perception of each event, as well as the educational implications.
4.4.3. Relationship Between Crisis Imagery and Self-Efficacy
In this subsection, we conducted a quadrant analysis using Q3 (crisis imagery) as the horizontal axis and Q4 (self-efficacy) as the vertical axis to examine the relationship between crisis imagery and self-efficacy.
The four quadrants are termed Quadrant I = high imagery and high self-efficacy (can be clearly imagined, with high confidence in taking action), Quadrant II = low imagery and high self-efficacy (hard to imagine, but with high confidence in taking action), Quadrant III = low imagery and low self-efficacy (hard to imagine, with low confidence in taking action), and Quadrant IV = high imagery and low self-efficacy (can be clearly imagined, but with low confidence in taking action).
By classifying the crisis events into four quadrants, the tendencies of crisis imagery and self-efficacy are identified. A crisis event located above the regression line indicates the tendency to estimate the self-efficacy as larger than the crisis imagery. Conversely, a crisis event located below the regression line indicates the tendency to estimate the self-efficacy as smaller than the crisis imagery. By mapping the crisis events into four quadrants, the authors examine “the gap between imagery and confidence of action” and the educational problems.
4.4.4. Relationship Between Risk Perception and Self-Efficacy
In this subsection, we conducted a quadrant analysis using the \(R\) score (Q1 \(\times\) Q2) as the horizontal axis and Q4 (self-efficacy) as the vertical axis to examine the relationship between risk perception and self-efficacy.
The four quadrants of the scatter plot are termed as Quadrant I = high \(R\) score and high self-efficacy (risk perception is high and you think you could take action), Quadrant II = low \(R\) score and high self-efficacy (risk perception is low but you think you could take action), Quadrant III = low \(R\) score and low self-efficacy (risk perception is low and you think you could not take action), and Quadrant IV = high \(R\) score and low self-efficacy (risk perception is high but you think you could not take action).
By classifying the crisis events into four quadrants, the correlation between risk perception and self-efficacy is examined. A crisis event located above the regression line indicates the tendency to evaluate the self-efficacy higher than the risk perception. Conversely, a crisis event located below the regression line indicates the tendency to evaluate the self-efficacy lower than the risk perception. By mapping the crisis events into four quadrants, the authors examine “the gap structure” between the risk perception and self-efficacy, and the educational problems.
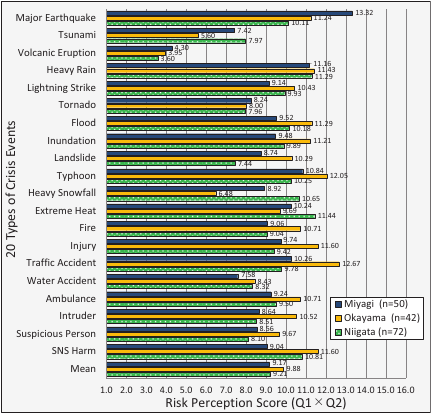
Fig. 2. Risk perception scores (\(R\) score) by prefecture.
5. Results of the Questionnaire Survey
5.1. Prefectural Trends in \(R\) score (Q1 \(\times\) Q2)
Figure 2 illustrates the data by prefecture, indicating 50 people in Miyagi Prefecture, 42 people in Okayama Prefecture, and 72 people in Niigata Prefecture, with the \(R\) score derived by multiplying Q1 and Q2 together (Q1 \(\times\) Q2: 1–16 scores). The average of all 20 events by prefecture is 9.17 in Miyagi Prefecture, 9.88 in Okayama Prefecture, and 9.21 in Niigata Prefecture. No significant differences were observed among the prefectures.
In Miyagi Prefecture, the maximum values are 13.32 for “Major Earthquake,” followed by 11.6 for “Heavy Rain,” 10.84 for “Typhoon,” and 10.24 for “Extreme Heat.” Conversely, 4.30 for “Volcanic Eruption” indicates an especially low value, and 7.42 for “Tsunami” remains at a relatively low level. The tendencies have a distinctive tendency in that “Major Earthquake” is stressed against the background of the experiences of the Great East Japan Earthquake; however, this does not correlate with high recognition in terms of “Tsunami.”
In Okayama Prefecture, 12.05 for “Typhoon,” 11.4 for “Heavy Rain,” and 11.29 for “Flood” exceed 11.24 for “Major Earthquake.” Reflecting the experiences of the 2018 Western Japan Heavy Rain, the events related to the flood disaster are highly evaluated. Conversely, 3.60 for “Volcanic Eruption” shows a very low value, and 5.60 for “Tsunami,” 6.48 for “Heavy Snowfall,” and 8.00 for “Tornado” stay at relatively low levels.
In Niigata Prefecture, 11.44 for “Extreme Heat,” 11.29 for “Heavy Rain,” 10.65 for “Heavy Snowfall,” and 10.25 for “Typhoon” show high values, reflecting the local characteristics of the heavy snowfall area and the disaster experience of the torrential rain in August 2022. Conversely, 3.60 for “Volcanic Eruption” shows a very low value, and 7.44 for “Landslide,” 7.96 for “Tornado,” and 7.97 for “Tsunami” stay at relatively low levels.
In the three prefectures, meteorological disasters such as typhoons, heavy rains, floods, inundations, and extreme heat were observed to be highly evaluated, whereas less frequent disasters such as volcanic eruptions, tsunamis, and tornadoes were considered less significant. In Miyagi Prefecture, the occurrence of a “Major Earthquake,” in Okayama Prefecture, a “Flood Disaster,” and in Niigata Prefecture, “Heavy Snowfall” are notably prominent, respectively. This indicates the possibility that the local disaster experiences and the geographical conditions, as outlined in Table 1, may influence perceptions.
The \(R\) score used in this study effectively captures the relative evaluation among the 20 events. However, because a high \(R\) score does not necessarily indicate the objective importance of a hazard for DRR, caution is needed in its interpretation. Accordingly, in the next section, the distribution characteristics are examined based on the scatterplots (four quadrants) of Q1 and Q2 to assess the structural characteristics by region.
5.2. Distribution of Q1 and Q2
5.2.1. Results and Discussion: Miyagi Prefecture
The survey subjects comprise 50 individuals. The unit of study consists of 20 events (\(n =20\)), with responses averaged for each crisis event. The threshold values are Q1 \(=2.91\) and Q2 \(=2.99\). A significant positive correlation (\(r=0.85\) [95% CI: 0.65–0.94], \(R^2=0.73\), \(p<0.001\)) is observed between Q1 and Q2. The regression equation is expressed as \(y = 0.6345x + 1.1411\).
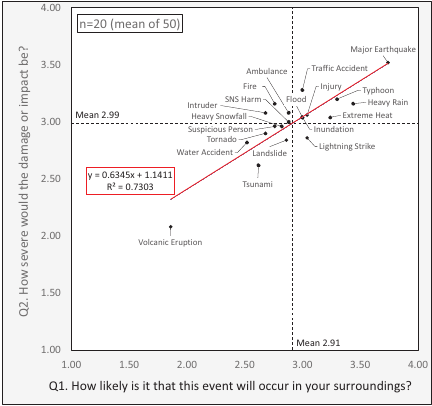
Fig. 3. Correlation between occurrence probability (Q1) and damage impact (Q2) in Miyagi.
Figure 3 illustrates the arrangement of the 20 items of crisis events into four quadrants. The crisis events, such as “Major Earthquake,” “Heavy Rain,” “Typhoon,” “Extreme Heat,” “Inundation,” and “Flood,” are classified into Quadrant I. The crisis events of “Volcanic Eruption,” “Tsunami,” “Tornado,” “Landslide,” and “Heavy Snowfall” are classified into Quadrant III. The crisis event “Lightning Strike” is classified into Quadrant IV.
In Miyagi Prefecture, “Major Earthquake” shows a very high value, which suggests that the experience of the Great East Japan Earthquake would be reflected. Against a background of the flood disaster caused by Typhoon Hagibis in 2019, the events related to the flood disaster, such as “Flood,” “Inundation,” and “Heavy Rain,” present relatively high values. Conversely, “Volcanic Eruption” and “Tsunami” stay at low values. In particular, “Tsunami,” is evaluated relatively low despite disaster experience and geographical conditions. Furthermore, “Lightning Strike,” “Extreme Heat,” and “Heavy Rain,” located below the regression line, indicate a tendency for the damage/impact to be evaluated as lower than the occurrence probability. However, in the case of “Major Earthquake” located above the regression line, the damage/impact and the occurrence probability are evaluated in balance.
5.2.2. Results and Discussion: Okayama Prefecture
The survey subjects comprise 42 people. The unit of study consists of 20 events (\(n =20\)), with responses averaged by the crisis event. The threshold values are Q1 \(=2.86\) and Q2 \(=3.30\). A significant positive correlation (\(r=0.85\) [95% CI: 0.65–0.94], \(R^2=0.72\), \(p<0.001\)) is observed between Q1 and Q2. The regression equation is expressed as \(y = 0.6361x + 1.4777\).
Figure 4 presents 20 items of crisis events arranged into four quadrants. Crisis events such as “Typhoon,” “Heavy Rain,” “Inundation,” “Flood,” “Landslide,” and “Major Earthquake” are classified into Quadrant I. Crisis events such as “Volcanic Eruption,” “Tsunami,” “Heavy Snowfall,” and “Tornado” are classified into Quadrant III. Crisis events such as “Lightning Strike” and “Extreme Heat” are classified into Quadrant IV.
In Okayama Prefecture, crisis events such as “Flood,” “Inundation,” and “Heavy Rain” have significantly high values, perhaps reflecting the impact of a large-scale disaster, the 2018 Western Japan Heavy Rain. Conversely, “Volcanic Eruption,” “Tsunami,” and “Tornado” stay at the low values. Specifically, regarding “Tsunami,” although the prefecture is included in the areas expected to be affected by the Nankai Trough Earthquake, the projected scale of damage is smaller compared with the Pacific coast, suggesting that the geographic conditions may influence public perception. Furthermore, in the case of “Major Earthquake” located above the regression line, the tendency is that the damage/impact would be evaluated as larger compared with the occurrence probability, whereas in the cases of “Extreme Heat,” “Lightning Strike,” and “Typhoon” located below the regression line, the tendency is that the damage/impact would be evaluated as smaller.
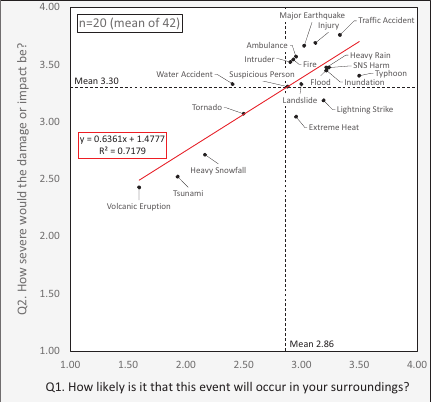
Fig. 4. Correlation between occurrence probability (Q1) and damage impact (Q2) in Okayama.
5.2.3. Results and Discussion: Niigata Prefecture
The survey subjects comprise 72 people. The unit of analysis consists of 20 events (\(n =20\)), with responses averaged by the crisis events. The threshold values are Q1 \(=2.89\) and Q2 \(=3.05\). A significant positive correlation (\(r=0.85\) [95% CI: 0.65–0.94], \(R^2=0.72\), \(p<0.001\)) was observed between Q1 and Q2. The regression equation is expressed as \(y = 0.4246x + 1.8213\).
Figure 5 presents 20 items of crisis events arranged into four quadrants. Crisis events such as “Extreme Heat,” “Heavy Rain,” “Heavy Snowfall,” “Typhoon,” “Major Earthquake,” “Flood,” “Inundation,” and “Lightning Strike” are classified into Quadrant I. The crisis events of “Volcanic Eruption,” “Landslide,” “Tsunami,” and “Tornado” are classified into Quadrant III.
In Niigata Prefecture, “Heavy Snowfall” shows a very high value, reflecting the local characteristics of the heavy snowfall area. Against a background of the disaster experience of the torrential rain in August 2022, the crisis events related to the flood disaster, such as “Heavy Rain” and “Flood,” also show high values. Furthermore, “Extreme Heat” is highly ranked, indicating the possibility that the extreme heat and heat stroke in recent years would influence the risk perception. Conversely, the prefecture has active volcanoes, but “Volcanic Eruption” shows a relatively low value. Furthermore, in the cases of “Major Earthquake,” “Flood,” and “Inundation” located above the regression line, there is a tendency that the damage/impact would be evaluated larger compared with the occurrence probability, whereas in the cases of “Lightning Strike” and “Heavy Snowfall” located below the regression line, there is a tendency that the damage/impact would be evaluated smaller.
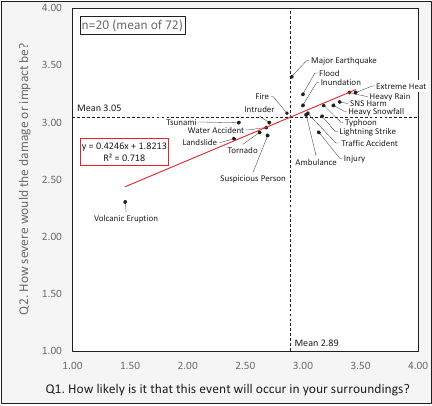
Fig. 5. Correlation between occurrence probability (Q1) and damage impact (Q2) in Niigata.
5.2.4. Common Trends in the Distribution of Risk Perception
From the analyses of Figs. 3–5, a significant positive correlation is observed between Q1 and Q2 in all the prefectures. This suggests that when the assessed occurrence probability increases, the extent of damage or impact also escalates.
In the distributions of the four quadrants, local characteristics are reflected. In Miyagi Prefecture, “Major Earthquake,” in Okayama Prefecture, flood disasters such as “Flood,” “Inundation,” and “Heavy Rain,” and in Niigata Prefecture, meteorological disasters such as “Heavy Snowfall,” “Extreme Heat,” and “Heavy Rain” are evaluated as high, respectively. Furthermore, it is confirmed that the focus of the recognition differs depending on each region. This indicates the possibility that the local disaster experience and the geographical condition would influence the risk perception.
Generally, a large-scale natural disaster, such as “Major Earthquake,” “Heavy Rain,” and “Typhoon,” shows high values, whereas infrequent disasters such as “Volcanic Eruption,” “Tsunami,” and “Tornado” generally stay at low values. Regarding a daily event like “Lightning Strike,” despite its high occurrence probability, the damage/impact is often assessed as relatively low. In the scatterplots, several crisis events were positioned above or below the regression line. These deviations may indicate discrepancies between how teachers evaluate perceived likelihood and perceived impact; however, the causes of such deviations cannot be identified solely from the data obtained in this study, and thus these patterns should be interpreted with caution.
From the above analyses, the evaluation combining Q1 and Q2 reveals a general correlation between the occurrence probability and the damage/impact, offering a framework to visualize the local characteristics and the underestimated crisis events. This strategy is confirmed to be effective in understanding the structure of risk perception.
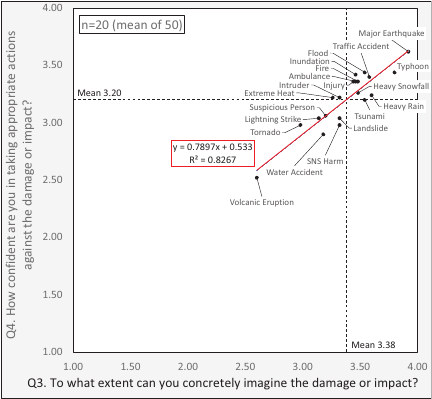
Fig. 6. Correlation between crisis imagery (Q3) and self-efficacy (Q4) in Miyagi.
5.3. Relationship Between Q3 and Q4
5.3.1. Results and Discussion: Miyagi Prefecture
The survey subjects comprise 50 people. The unit of study includes 20 events (\(n =20\)), with responses averaged for each crisis event. The threshold values are Q3 \(=3.38\) and Q4 \(=3.20\). A significant positive correlation (\(r=0.91\) [95% CI: 0.78–0.96], \(R^2=0.83\), \(p<0.001\)) is observed between Q3 and Q4. The regression equation is expressed as \(y = 0.7897x + 0.533\).
Figure 6 presents 20 items of crisis events arranged into four quadrants. Crisis events such as “Major Earthquake,” “Typhoon,” “Flood,” “Inundation,” “Heavy Rain,” “Heavy Snowfall,” and “Tsunami” are classified into Quadrant I. The crisis event of “Extreme Heat” is classified into Quadrant II; and the crisis events of “Volcanic Eruption,” “Tornado,” “Lightning Strike,” and “Landslide” are classified into Quadrant III.
In Miyagi Prefecture, “Major Earthquake” is evaluated especially highly for both crisis imagery and self-efficacy, followed by “Typhoon.” Conversely, “Volcanic Eruption” maintains low values for both indices. Furthermore, in the cases of “Flood” and “Inundation” located above the regression line, there is a tendency that the self-efficacy could be evaluated as higher compared with crisis imagery. On the contrary, focusing on “Tsunami” located below the regression line, there is a tendency for self-efficacy to be evaluated lower than crisis imagery. “Major Earthquake” is located on the regression line, and crisis imagery and self-efficacy are evaluated in balance.
5.3.2. Results and Discussion: Okayama Prefecture
The survey subjects comprise 42 people. The unit of analysis includes 20 events (\(n =20\)), with responses averaged by the crisis event. The threshold values are Q3 \(=3.08\) and Q4 \(=2.68\). A significant positive correlation (\(r=0.94\) [95% CI: 0.85–0.98], \(R^2=0.89\), \(p<0.001\)) is observed between Q3 and Q4. The regression equation is expressed as \(y = 0.8862x - 0.0565\).
Figure 7 presents 20 items of crisis events arranged into four quadrants. Crisis events such as “Major Earthquake,” “Inundation,” “Heavy Rain,” “Flood,” and “Typhoon” are classified into Quadrant I. The crisis events “Volcanic Eruption,” “Tornado,” “Tsunami,” “Extreme Heat,” “Heavy Snowfall,” and “Lightning Strike” are classified into Quadrant III; and the crisis event “Landslide” is classified into Quadrant IV.
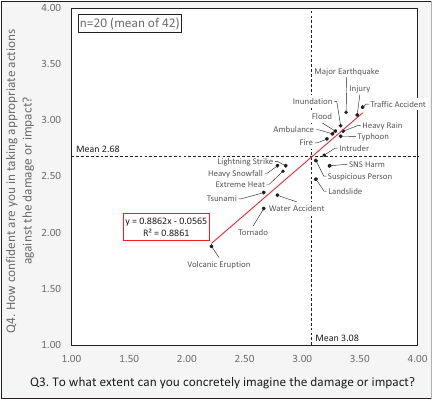
Fig. 7. Correlation between crisis imagery (Q3) and self-efficacy (Q4) in Okayama.
In Okayama Prefecture, in addition to “Major Earthquake,” crisis events related to flood disaster, such as “Flood,” “Inundation,” and “Heavy Rain,” show high values, which are thought to reflect the experience of the 2018 Western Japan Heavy Rain. Conversely, “Volcanic Eruption,” “Tornado,” and “Tsunami” maintain low values. Notably, regarding “Tsunami,” although the prefecture is included in the areas expected to be affected by the Nankai Trough Earthquake, a characteristic divergence is confirmed: crisis imagery is low, yet self-efficacy is high. Furthermore, in the case of “Major Earthquake” located above the regression line, there is a tendency that self-efficacy would be evaluated higher compared with crisis imagery. On the contrary, in the case of “Landslide” located below the regression line, there is a tendency that self-efficacy would be evaluated lower than crisis imagery.
5.3.3. Results and Discussion: Niigata Prefecture
The survey subjects comprise 72 people. The unit of analysis includes 20 events (\(n =20\)), with responses averaged by the crisis event. The threshold values are Q3 \(=3.03\) and Q4 \(=2.68\). A significant positive correlation (\(r=0.96\) [95% CI: 0.90–0.98], \(R^2=0.92\), \(p<0.001\)) was observed between Q3 and Q4. The regression equation is expressed as \(y = 0.9574x - 0.2135\).
Figure 8 illustrates 20 items of crisis events arranged into four quadrants. Crisis events such as “Heavy Snowfall,” “Extreme Heat,” “Heavy Rain,” “Major Earthquake,” “Typhoon,” and “Flood” are classified into Quadrant I. Crisis events such as “Volcanic
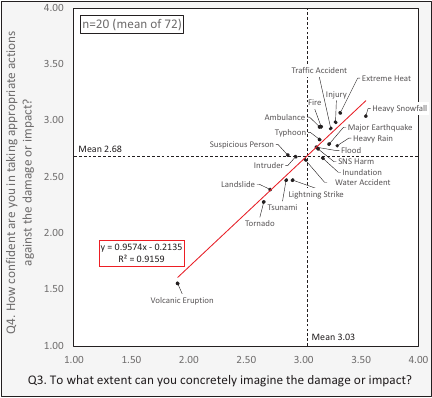
Fig. 8. Correlation between crisis imagery (Q3) and self-efficacy (Q4) in Niigata.
Eruption,” “Tornado,” “Landslide,” “Tsunami,” and “Lightning Strike” are classified into Quadrant III; and the crisis event “Inundation” is classified into Quadrant IV.
In Niigata Prefecture, “Heavy Snowfall” shows high values for both crisis imagery and self-efficacy, reflecting the local characteristics as a heavy snowfall area. “Extreme Heat” is also ranked high, which suggests that the extreme heat in recent years would influence recognition. Furthermore, the torrential rain in August 2022 and the 2024 Noto Peninsula Earthquake act as a background, and “Heavy Rain,” “Flood,” and “Major Earthquake” also show high values. On the contrary, “Volcanic Eruption,” “Tornado,” “Tsunami,” and “Landslide” show low values. Furthermore, in the cases of “Extreme Heat” and “Typhoon” located above the regression line, there is a tendency that self-efficacy would be evaluated higher compared to crisis imagery. However, in the case of “Heavy Rain,” “Inundation,” “Heavy Snowfall,” and “Major Earthquake” located below the regression line, there is a tendency that self-efficacy would be evaluated relatively low.
5.3.4. Common Trends in Crisis Imagery and Self-Efficacy
Analyses from Figs. 6–8 reveal a significant positive correlation in all three prefectures. This indicates that the more concretely the damage can be recalled, the higher the confidence in acting appropriately becomes.
The disaster experience and the geographical condition influence the evaluation of the specific events. The characteristics of each region differ as follows. In Miyagi Prefecture, in the case of “Tsunami,” self-efficacy is lower than crisis imagery. In Niigata Prefecture, “Heavy Snowfall” is regarded as a significant region-specific disaster. In Okayama Prefecture, the crisis events related to flood disaster show high values for both crisis imagery and self-efficacy. This indicates a uniform national framework in the correlation between crisis imagery and self-efficacy; however, local characteristics would influence the focus of recognition.
The above analysis clarifies that crisis imagery consistently enhances self-efficacy; however, the extent of the effect varies according to the event, with a notably diminished impetus for action in specific disasters.
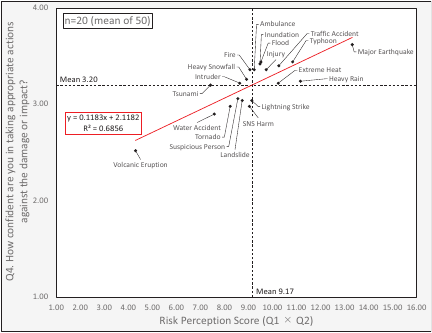
Fig. 9. Correlation between \(R\) score (Q1 \(\times\) Q2) and self-efficacy (Q4) in Miyagi.
5.4. Relationship Between \(R\) Score (Q1 \(\times\) Q2) and Q4
5.4.1. Results and Discussion: Miyagi Prefecture
The survey subjects comprise 50 individuals. The unit of analysis includes 20 events (\(n =20\)), with responses averaged for each crisis event. The threshold values are \(R\) score \(=9.12\) and Q4 \(= 3.20\). A significant positive correlation (\(r=0.83\) [95% CI: 0.61–0.93], \(R^2=0.69\), \(p<0.001\)) is observed between \(R\) score and Q4. The regression equation is expressed as \(y = 0.1183x + 2.1182\).
Figure 9 illustrates 20 items of crisis events arranged into four quadrants. Crisis events such as “Major Earthquake,” “Typhoon,” “Heavy Rain,” “Extreme Heat,” “Flood,” and “Inundation” are classified into Quadrant I. Crisis event such as “Heavy Snowfall” are classified into Quadrant II; and crisis events “Volcanic Eruption,” “Tsunami,” “Tornado,” “Landslide,” and “Lightning Strike” are classified into Quadrant III.
In Miyagi Prefecture, “Major Earthquake” shows high values for both risk perception and self-efficacy. However, “Volcanic Eruption” remains at low values for both indices. Furthermore, in the cases of “Flood” and “Inundation” located above the regression line, there is a tendency for self-efficacy to be evaluated higher compared with risk perception (\(R\) score). Conversely, in the cases of “Heavy Rain,” “Extreme Heat,” and “Lightning Strike” located below the regression line, there is a tendency for self-efficacy to be evaluated relatively low. Additionally, “Tsunami” shows a characteristic divergence: risk perception is low, whereas self-efficacy is relatively high.
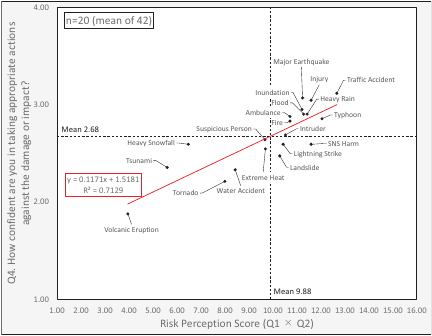
Fig. 10. Correlation between \(R\) score (Q1 \(\times\) Q2) and self-efficacy (Q4) in Okayama.
5.4.2. Results and Discussion: Okayama Prefecture
The survey subjects comprise 42 people. The unit of analysis includes 20 events (\(n =20\)), with responses averaged by the crisis event. The threshold values are \(R\) score \(=9.88\) and Q4 \(=2.68\). A significant positive correlation (\(r=0.84\) [95% CI: 0.63–0.94], \(R^2=0.71\), \(p<0.001\)) is observed between \(R\) score and Q4. The regression equation is expressed as \(y = 0.1171x - 1.5181\).
Figure 10 depicts 20 items of crisis events arranged into four quadrants. Crisis events such as “Major Earthquake,” “Typhoon,” “Heavy Rain,” “Inundation,” and “Flood” are classified into Quadrant I. Crisis events like “Volcanic Eruption,” “Tsunami,” “Heavy Snowfall,” “Tornado,” and “Extreme Heat” are classified into Quadrant III; and crisis events like “Landslide” and “Lightning Strike” are classified into Quadrant IV.
In Okayama Prefecture, in addition to the crisis events related to flooding (“Flood,” “Inundation,” “Heavy Rain,” and “Typhoon”), “Major Earthquake” shows a high value. Conversely, “Volcanic Eruption,” “Tsunami,” “Heavy Snowfall,” and “Tornado” stay at relatively low values. Furthermore, in the cases of “Major Earthquake,” “Inundation,” and “Flood” located above the regression line, there is a tendency for self-efficacy to be evaluated as high. However, in the cases of “Landslide,” “Lightning Strike,” and “Typhoon” located below the regression line, there is a tendency for self-efficacy to be evaluated as relatively low. Additionally, “Tsunami” and “Heavy Snowfall” show a characteristic divergence: risk perception is low, while self-efficacy is relatively high.
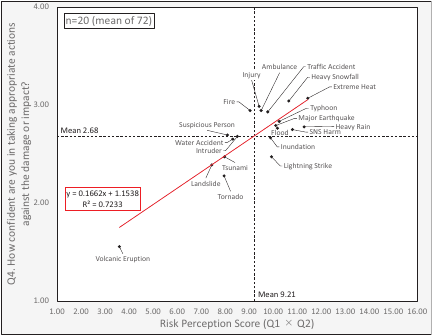
Fig. 11. Correlation between \(R\) score (Q1 \(\times\) Q2) and self-efficacy (Q4) in Niigata.
5.4.3. Results and Discussion: Niigata Prefecture
The survey subjects include 72 people. The units of analysis include 20 events (\(n =20\)), with responses averaged for each crisis event. The threshold values are \(R\) score \(=9.21\) and Q4 \(=2.68\). A significant positive correlation (\(r=0.85\) [95% CI: 0.65–0.94], \(R^2=0.72\), \(p<0.001\)) is observed between \(R\) score and Q4. The regression equation is expressed as \(y = 0.1662x - 1.1538\).
Figure 11 lists 20 items of crisis events arranged into four quadrants. Crisis events such as “Extreme Heat,” “Heavy Snowfall,” “Heavy Rain,” “Typhoon,” “Major Earthquake,” and “Flood” are classified into Quadrant I. Crisis events like “Volcanic Eruption,” “Landslide,” “Tornado,” and “Tsunami” are classified into Quadrant III; and crisis events like “Lightning Strike” and “Inundation” are classified into Quadrant IV.
In Niigata Prefecture, “Extreme Heat” and “Heavy Snowfall” show high values, reflecting local weather characteristics such as extreme heat and heavy snowfall in recent years. However, “Volcanic Eruption,” “Tornado,” “Landslide,” and “Tsunami” maintain low values. Furthermore, in the case of “Heavy Snowfall” located above the regression line, there is a tendency for self-efficacy to be evaluated relatively higher compared with risk perception. However, in the case of “Lightning Strike,” “Heavy Rain,” and “Inundation” located below the regression line, there is a tendency for self-efficacy to be evaluated relatively lower.
5.4.4. Common Trends in Risk Perception and Self-Efficacy
The analyses of Figs. 9–11 reveals a significant positive correlation in three prefectures. This indicates that the higher the risk perception of the crisis event becomes, the higher the confidence in “can act appropriately” becomes.
Focusing on the distribution of four quadrants, large-scale natural disasters like Major Earthquake, Typhoons, Heavy Rain, and Heavy Snowfall show high values for risk perception and self-efficacy and are concentrated in Quadrant I. However, in crisis events where the risk recognition reaches a certain level, but self-efficacy stays low, a discrepancy is observed between recognition and action. On the contrary, for “Volcanic Eruption,” the risk recognition is commonly low in three prefectures, and a similar tendency is observed for low self-efficacy.
The above analyses confirm a consistent positive correlation between risk perception and self-efficacy, while also identifying a discrepancy between recognition and action.
6. Conclusions and Future Directions
This study focuses on educators in Miyagi, Okayama, and Niigata Prefectures, employing a questionnaire with four items (Q1–Q4) to assess 20 types of crisis events related to school safety. The authors clarify the actual situation and the structural characteristics of DRR literacy by analyzing the \(R\) score, calculated by Q1 \(\times\) Q2. Consequently, the analysis confirms the following:
First, a significant positive correlation is observed between Q1 and Q2, indicating that teachers tend to “evaluate the damage connected with the frequency of occurrence.” Second, a significant positive correlation is also observed consistently between Q3 and Q4, confirming that the more concretely the damage from the crisis event is recalled, the higher the self-efficacy becomes. Third, the correlation between \(R\) score and Q4 is significantly elevated for large-scale disasters, whereas it remains low for many infrequent disasters. The common tendencies and the differences among the three prefectures also become apparent.
The local characteristics of Miyagi Prefecture indicate a very high value for “Major Earthquake,” although “Tsunami” remains at a relatively low level. The correlation with the earthquake experience is not always unequivocal. In Okayama Prefecture, “Flood,” “Inundation,” and “Heavy Rain” exhibit higher values than that of “Major Earthquake,” reflecting the experience of the 2018 Western Japan Heavy Rain. In Niigata Prefecture, “Heavy Snowfall” is evaluated high. In addition to being a heavy-snowfall area, recent disaster experiences, such as the torrential rain in August 2022 and the 2024 Noto Peninsula Earthquake may also serve as background factors. However, in Miyagi and Niigata Prefectures, where active volcanoes exist, there is a tendency for “Volcanic Eruption” to be evaluated low. The above results not only indicate the framework of the nationwide common risk perception but also highlight the differences in recognition based on local characteristics and experience.
Furthermore, there are some crisis events where self-efficacy remains low despite their frequent occurrence, indicating that the knowledge does not directly translate into action. Additionally, the regression analysis indicates that the intensity of the correlation between \(R\) score and Q4 differs across different prefectures. It is acknowledged that a high-risk perception does not substantially increase self-efficacy across the prefectures.
This knowledge suggests the following points as the basic problems in DRR education. First, in DRR education, “recognizing the significance of hazards regardless of their occurrence frequency” and “evaluating the risks hidden in the daily events appropriately” are important. Second, because the local characteristics and the disaster experience are reflected in the focus of the risk perception, incorporating local characteristics into educational practices is necessary. Third, an educational process is proposed in which self-efficacy would be enhanced, and the action-taking ability would be fostered by combining “learning to deepen the damage image” and “concrete action training and experience learning.” Furthermore, a simple principle of “the higher the risk is evaluated, the more it leads to an action” is not assumed; rather, there are some cases where recognition is not always connected with an action. This highlights the need for a learning process to address this discrepancy and promote subjective judgment and action.
The above knowledge can be understood theoretically in relation to the learning sequence “recognition–judgment–action.” This learning process has been developed by the authors in the previous studies, adopted in “The Practical Guide for Disaster Education” published by MEXT and emphasized in the DRR education program. The evaluation method used in this study is effective for understanding the framework of literacy on DRR and can be applied not only to assessing teachers but also evaluating students learning outcomes.
However, this study has several limitations that offer directions for future research. Because the survey target is limited to the teachers in three prefectures, careful consideration is necessary when extrapolating the findings to represent nationwide trends. This study is based on the correlation analysis but does not explicitly demonstrate a causal relationship. In addition to the multi-layered survey including students, parents, and managers, future research should clarify precisely the development of literacy related to DRR and address the discrepancy in “recognition–judgment–action” by introducing longitudinal evaluation and objective indices connected with the educational practices.
Acknowledgments
We would like to express our sincere gratitude to the Miyagi, Okayama, and Niigata Prefectural Boards of Education, as well as to the teachers at each school, for their cooperation in conducting the survey. We are also deeply grateful to all those who provided valuable advice on the analysis and interpretation of the findings. This study was supported by the Ministry of Education, Culture, Sports, Science and Technology (MEXT) of Japan, under its the Third Earthquake and Volcano Hazards Observation and Research Program (Earthquake and Volcano Hazard Reduction Research).
- [1] Cabinet Office, “White paper on disaster management 2025,” Cabinet Office, 2025.
- [2] Ministry of Education, Culture, Sports, Science and Technology, “The third basic plan for the promotion of school safety,” 2022.
- [3] M. Murakoshi, “Challenges in safety education and 21st century competencies,” J. of Curriculum Development in Education, Vol.5, pp. 123-133, 2017 (in Japanese).
- [4] T. Motoyoshi, “The effects of risk perception and self-related information on residents’ evacuation intention,” Japanese J. of Risk Analysis, Vol.31, No.1, pp. 41-48, 2021 (in Japanese). https://doi.org/10.11447/jjra.SRA-0345
- [5] H. Kobayashi and A. Tanaka, “Effects of disaster structural understanding on residents’ behavioral intention against disaster—Case of Kanto Tohoku heavy rainfall disaster (2015)—,” J. of Disaster Information Studies, Vol.15, No.2, pp. 137-147, 2017 (in Japanese). https://doi.org/10.24709/jasdis.15.2_137
- [6] H. Hamano, “Examination of factors promoting self-help behavior during disasters among hemodialysis patients,” J. of Japan Society of Nursing Research, Vol.46, No.5, pp. 825-837, 2024 (in Japanese). https://doi.org/10.15065/jjsnr.20230220209
- [7] K. Tanaka, K. Umeno, M. Ikeda, and M. Hori, “Experimental studies on perceived danger of unsafe evacuation behavior seen in knowledge-to-action gap,” Cognitive Studies, Vol.22, No.3, pp. 356-367, 2015 (in Japanese). https://doi.org/10.11225/jcss.22.356
- [8] K. Nakazawa, S. Ohtomo, R. Kimura, T. Nagata, and M. Ikeda, “Relationship between disaster scenarios and disaster management behavior,” J. Disaster Res., Vol.19, No.1, pp. 182-191, 2024. https://doi.org/10.20965/jdr.2024.p0182
- [9] R. Kimura and M. Ikeda, “Features and issues of disaster management education practices,” J. Disaster Res., Vol.19, No.1, pp. 19-29, 2024. https://doi.org/10.20965/jdr.2024.p0019
- [10] N. Okada and K. Yamori, “Evaluation of 4 frameworks in school disaster education: Aiming ‘cross-curriculum’ for disaster prevention education,” J. of Japan Society for Natural Disaster Science, Vol.38, No.2, pp. 241-256, 2019 (in Japanese).
- [11] R. Uchida, “Risk analysis of school accidents: Focusing on the actual and perceived incidence of accidents,” J. of Educational Sociology, Vol.86, pp. 201-221, 2010 (in Japanese). https://doi.org/10.11151/eds.86.201
- [12] Ministry of Education, Culture, Sports, Science and Technology, “Practical guide for disaster education: Elementary school edition (chap. 3),” pp. 22-59, 2023 (in Japanese).
- [13] Ministry of Education, Culture, Sports, Science and Technology, “Practical guide for disaster education: Junior and senior high school edition (chap. 4),” pp. 32-91, 2024 (in Japanese).
- [14] T. Nagata and R. Kimura, “Case study research in disaster management education to develop ‘a zest for life’ of children using earthquake early warning system,” J. Social Safety Science, No.21, pp. 81-88, 2013. https://doi.org/10.11314/jisss.21.81
- [15] T. Nagata, T. Yi, R. Kimura, and M. Ikeda, “Development of the volcanic disaster risk reduction education program using the ICT tool ‘YOU@RISK volcanic disaster edition’–Practical verification at a junior high school in the Mt. Nasu Area –,” J. Disaster Res., Vol.19, No.5, pp. 793-807, 2024. https://doi.org/10.20965/jdr.2024.p0793
- [16] S. Sato and T. Fujioka, “A science teaching material for fostering the ability to select actions in a natural disaster: Hazard assessment and appropriate evacuation for disasters caused by heavy rain,” J. of Research in Science Education, Vol.61, No.2, pp. 287-297, 2020 (in Japanese). https://doi.org/10.11639/sjst.20011
- [17] J. Toyosawa, T. Motoyoshi, H. Takehashi, and R. Noda, “Effects of disaster education on risk prediction and coping behaviors,” The Japanese J. of Educational Psychology, Vol.67, No.1, pp. 54-67, 2019 (in Japanese). https://doi.org/10.5926/jjep.67.54
- [18] K. Yamaguchi, H. Tatano, and N. Okada, “Information provision and risk perception on fatal disaster risk in a monocentric city,” Infrastructure Planning Review, Vol.17, pp. 327-336, 2000 (in Japanese). https://doi.org/10.2208/journalip.17.327
- [19] S. Ohtomo, R. Kimura, Y. Kawata, and K. Tamura, “Determinants of residents’ evacuation behavior in 2018 Western Japan Torrential Rain,” J. Disaster Res., Vol.15, No.7, pp. 1011-1027, 2020. https://doi.org/10.20965/jdr.2020.p1011
- [20] R. Kakimoto, Y. Ueno, and M. Yoshida, “The study of disaster risk perception paradox based on protection motivation theory,” J. of Japan Society of Civil Engineers, Vol.72, No.5, pp. I_51-I_63, 2016 (in Japanese). https://doi.org/10.2208/jscejipm.72.I_51
- [21] R. W. Rogers, “A protection motivation theory of fear appeals and attitude change,” The J. of Psychology, Vol.91, No.1, pp. 93-114, 1975. https://doi.org/10.1080/00223980.1975.9915803
- [22] T. Kinoshita, “Structure of risk perception and international comparison,” J. Soc. Safety Eng., Vol.41, No.6, pp. 356-363, 2002 (in Japanese).
- [23] F. Kawami, H. Hayashi, and S. Tachiki, “Nonlinear interactions of disaster literacy and damage perception on risk avoidance behavior,” J. Soc. Safety Sci., No.29, pp. 135-142, 2016 (in Japanese).
- [24] R. Kakimoto, Y. Ueno, and M. Yoshida, “Verification of locality of mitigation actions towards resolution of disaster risk perception paradox,” J. of Japan Society of Civil Engineers, Vol.73, No.5, pp. I_57-I_68, 2017 (in Japanese). https://doi.org/10.2208/jscejipm.73.I_57
- [25] S. Hirota, “Differences in risk perception by group and temporal expression of disaster probability,” Jpn. J. Soc. Psychol., Vol.30, No.2, pp. 121-131, 2014 (in Japanese).
- [26] T. Motoyoshi, “Development of a disaster self-efficacy scale,” J. Societal Safety Sci., Vol.9, pp. 103-117, 2019 (in Japanese).
- [27] T. Nagata and R. Kimura, “Multi-hazard DRR education program development to enhance children’s zest for life,” J. Disaster Res., Vol.12, No.1, pp. 17-41, 2017. https://doi.org/10.20965/jdr.2017.p0017
- [28] S. Masuda and T. Sakagami, “Midpoint response in social research: Causes, consequences, and prevention,” Jpn. Psychol. Rev., Vol.57, No.4, pp. 472-494, 2014 (in Japanese).
- [29] K. Amai, “Influence of emotional-support expectation on support evaluation in adolescence,” Jpn. J. Psychol., Vol.92, No.2, pp. 140-150, 2021 (in Japanese).
This article is published under a Creative Commons Attribution-NoDerivatives 4.0 Internationa License.