
Research Paper:
Run Prevention vs. Run Creation: A Dynamic Panel Analysis of Performance Persistence in Major League Baseball
Chao-Chin Liu*
 , Che-Jen Chuang**
, Xuan-Min Zhu*
, and Yung-Chuan Tsai***,†
*School of Physical Education, Fujian Polytechnic Normal University
No.1 Campus New Village, Longjiang Street, Fuqing, Fujian 350300, China
**Department of Food & Beverage Management, Lee-Ming Institute of Technology
No.22 Section 3, Tailin Road, Taishan District, New Taipei 24305, Taiwan
***Department of Sport and Leisure Management, Meiho University
No.23 Pingguang Road, Neipu Township, Pingtung County 912, Taiwan
†Corresponding author

This study investigates how core Major League Baseball team indicators—offensive output, run suppression, defensive performance, and prior-season competitive records—correlate with seasonal winning rates. Based on 2015–2024 panel data of all 30 league teams, this research employs two-way fixed-effects models with lagged winning percentage variables. Empirical results show that runs scored per game, on-base plus slugging percentage, and fielding percentage positively predict win rates, whereas earned run average, runs allowed per game, and per-game errors present negative associations. The significant positive lagged coefficient verifies sustained team competitive performance over time. All identified statistical associations are conditional rather than causal, as key game metrics and winning records are simultaneously generated from regular-season contests. Besides, runs allowed per game cannot fully isolate pure pitching performance, and raw regression coefficients are insufficient to rank the importance of different competitive factors. This paper constructs an integrated team-season analytical framework for sports empirical research; however, its numerical results and practical guiding value require further systematic validation to guarantee robustness.
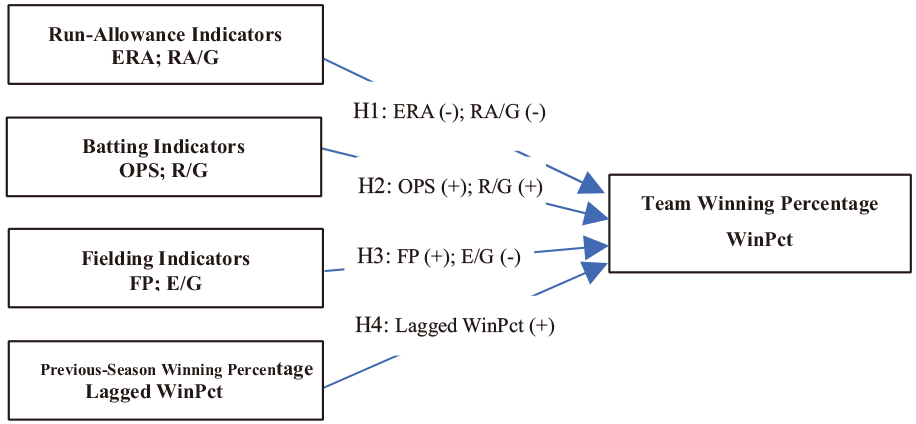
MLB performance persistence framework
1. Introduction
Research on team performance has long occupied a prominent position in professional sports and sports economics. In Major League Baseball (MLB), competitive achievement is widely recognized as a collective outcome of a team’s performance in batting, pitching, and fielding. This perspective is deeply intertwined with the sports production function framework that frames team success as the outcome of various performance inputs converted into competitive results 1. Previous studies have consistently demonstrated a close correlation between the gap between runs scored and allowed and the team’s winning percentage. Specifically, the Pythagorean expectation model reveals a relatively consistent association between run differentials and team success 2,3. Although composite indicators based on run data possess strong explanatory power, they offer limited insight into the specific ways in which batting, pitching, and fielding contribute to a team’s overall performance.
Modern sabermetric methodologies enable scholars to assess offensive production, pitching effectiveness, and defensive contributions in baseball. However, conventional statistical indicators are limited in fully isolating these distinct on-field capabilities 3. Lewis’s seminal work Moneyball 4 demonstrated how data-driven analytical approaches have gradually transformed professional baseball roster planning and institutional decision-making processes. A growing body of follow-up studies has further enriched and diversified the quantitative methodologies applied to athletic performance evaluations in baseball research 5,6. Nevertheless, the perceived predictive values of hitting efficiency, run suppression, and defensive performance are highly contingent on the choice of statistical measures, research timeframes, and empirical strategies adopted in the analysis. A franchise’s on-field performance is also shaped by its long-term organizational resource accumulation and historical competitive track records 7. Adopting a longitudinal research design provides a viable solution for investigating such performance patterns while effectively differentiating contemporaneous statistical correlations from persistent performance trends across multiple competition seasons.
To address the aforementioned research gaps, this study constructs a team-level panel dataset encompassing all 30 MLB franchises for the period 2015–2024. This study employs a two-way fixed-effects model to identify the conditional correlational relationships among offensive performance, run concession rates, defensive quality, and team seasonal win rates. A dynamic specification incorporating lagged winning outcomes is also adopted to capture the persistence of a team’s competitive performance. Notably, the corresponding estimation algorithms, valid sample coverage, and numerical outputs must be rigorously verified before interpreting the results. The inclusion of team and year fixed effects controls for time-invariant team heterogeneity and universal seasonal factors that impact all league teams equally 8,9. Nevertheless, these fixed-effect terms cannot capture dynamic shifts in team operational and organizational statuses, nor can they fully resolve estimation biases stemming from time-varying unobserved confounding variables.
This study develops a cohesive team-season analytical framework that integrates offensive, pitching, and defensive metrics while accounting for the continuity of athletic performance in MLB games 1,3,7. This study provides an interpretable econometric benchmark for data-driven sports analysis. Practitioners can link fluctuations in actual game performance statistics with conditional model predictions and test the robustness of analytical results across different model settings. This analytical method is a useful supplement to advanced predictive analytical tools rather than proposing an innovative computational intelligence algorithm. In addition, the empirical analysis in this study is not intended to determine the optimal scheme for sports team resource distribution.
Accordingly, this study targets three core research inquiries to guide the empirical analysis. First, it investigates the statistical associations between offensive, pitching, and defensive metrics and MLB teams’ seasonal win rates. Second, it examines whether a team’s winning record from the previous season has predictive correlations with its current year’s on-field performance. Third, the analysis verifies the robustness of the above relationships by testing their sensitivity to fixed-effect configurations and the inclusion of interrelated statistical variables. This set of research questions bridges traditional sports production evaluation with transparent team performance assessment systems, laying a foundational basis for practical analytical references and auxiliary decision-making in professional baseball.
2. Literature Review
2.1. Scoring Models and Sport Production Function
In sports economics and sabermetric research, the run differential has long been regarded as one of the most effective metrics to explain team success 3. From the perspective of sports production functions, team performance can be interpreted as the product of various competitive inputs converted into quantifiable outcomes 1. In baseball, this process typically manifests in the relationship between the runs scored and those allowed. Guided by this logic, James 2 developed the Pythagorean expectation model, which illustrates that a team’s winning percentage is closely tied to the balance between offensive and defensive efficiency. This model has emerged as a fundamental methodology in modern baseball analytics.
Despite their strong explanatory power, scoring-based models have certain limitations. Most notably, comprehensive metrics, such as run differential, fail to isolate the individual associations of hitting, pitching, and fielding. While these models are useful for predicting a team’s overall success, they provide little insight into how different competitive dimensions relate to team performance 3. Therefore, subsequent research has increasingly strived to move beyond comprehensive indicators, instead decomposing team performance into multiple dimensions to enable a more detailed exploration of the mechanisms underlying competitive success.
2.2. Decomposing Performance: Batting, Pitching, and Fielding
Analytical baseball research typically categorizes the on-field performance into three core dimensions: hitting, pitching, and defense. However, classical statistical metrics struggle to fully disentangle the individual contributions of each component to team outcomes 3,6. Specifically, earned run average (ERA) quantifies the earned runs surrendered by pitchers across nine innings, while runs allowed per game (RA/G) captures the total run concessions in each contest, encompassing defensive performance and other external factors in run prevention. Even the widely used ERA metric is not isolated from external interference, because it is affected by defensive proficiency, stadium environmental characteristics, and the competitive caliber of opposing teams. Therefore, the stronger statistical correlations observed for pitching and defensive indicators cannot serve as valid evidence to conclude that pitching performance is inherently more stable or strategically valuable than offensive output in MLB competitions.
Traditional statistical measures have notable limitations in evaluating defensive performance in baseball. Metrics such as fielding percentage (FP) and per-game error counts only quantify officially recorded mistakes and successfully completed defensive play. However, these basic indicators fail to account for key defensive capabilities, including field coverage range and uncredited stop plays, which effectively block opposing hit attempts. Consequently, their correlations with team win rates reflect only a narrow portion of the overall defensive value 5. Therefore, researchers must interpret the empirical findings cautiously, particularly when considering the inherent overlap between pitching results and on-field defensive quality when analyzing game outcomes.
In summary, decomposing team performance into three core dimensions—hitting, pitching, and fielding—has become a key analytical approach in contemporary baseball research. This framework enables researchers to move beyond simplistic composite indicators, facilitating a deeper investigation into the specific mechanisms by which different performance factors shape competitive outcomes.
Recent studies have questioned the validity of the simplistic hierarchical rankings of baseball performance factors. Lee and Lee 10 adopted spatial panel models to address cross-team interactive effects in MLB’s win-generation mechanism, proving that seasonal team wins cannot be regarded as independent observational outputs. In another study, Rockerbie 11 applied a translog production function to investigate the substitutive relationships among hitting, pitching, and defensive capabilities, avoiding the common pitfall of judging factor substitution merely through coefficient magnitude comparisons. In addition, Cairney et al. 12 demonstrated that the relative explanatory power of offensive and defensive metrics varied across different developmental stages of baseball history. Collectively, these prior findings support the adoption of a comprehensive panel analytical framework while reminding researchers not to generalize a single empirical ranking as a universal rule for team performance production.
2.3. Performance Persistence and Dynamic Effects
Beyond the decomposition of performance, scholars in sports economics have placed growing emphasis on the dynamic nature of team performance. Previous research has indicated that long-term success is not purely random; rather, it is shaped by factors such as institutional arrangements, resource distribution, and organizational capabilities 7. From this perspective, team performance often displays a certain level of cross-seasonal persistence—meaning that a team’s current performance is influenced not only by its present performance status but also by the cumulative impact of past achievements.
This issue is particularly critical when analyzing the long-term development of professional sports. Studies relying solely on cross-sectional or single-season data may overlook the enduring effects of past performance, thereby failing to identify the mechanisms underlying the formation of sustainable competitive advantage 7. From an organizational perspective, sustained success may reflect a team’s capacity to continuously invest in player development, coaching systems, scouting initiatives, and management structures, which gradually strengthen its long-term competitive standing 13.
These factors underscore that team performance should not be treated as a purely static phenomenon. Instead, integrating temporal dynamics into empirical analysis is essential to understand how competitive advantage in professional baseball evolves and persists over time.
2.4. Research Gap and Analytical Framework
The literature on baseball analytics has explored how seasonal wins are generated, broken on-field performance down into discrete components, and tracked performance trends over extended timeframes. Recent empirical studies have also accounted for the interdependencies between league teams and the substitutable nature of different athletic inputs during performance evaluation 10,11. Building on these established studies, this study adopts a more focused research scope. It targets standard, widely accepted offensive, pitching, and defensive statistics across the 2015–2024 MLB seasons, with a core aim to analyze how their conditional correlations with team winning outcomes differ between static and dynamic empirical model settings.
Team-season panel data designs are effective in mitigating bias stemming from time-invariant team heterogeneity and universal seasonal fluctuations across the league, although such adjustment mechanisms cannot support causal inferences 8. Statistical inference is further complicated by repeated observations of individual franchises and the inherent interactive relationships between competing teams 10. Combining fixed-effect estimation with dynamic model structures allows this study to probe the temporal persistence of team performance while acknowledging the analytical constraints brought about by the relatively short panel timeframe adopted in this research.
To address these limitations, this study proposes an integrated analytical framework that combines the sports production function, performance decomposition, and dynamic panel analysis 1,7. This framework enables the simultaneous evaluation of batting, pitching, and fielding within a unified model while also facilitating a more direct examination of the persistence of team performance across seasons.
2.5. Hypotheses
Building on the sports production function and sabermetric literature, this study formulates directional hypotheses about conditional associations with winning percentage 1,3,6. The batting indicators, runs scored per game (R/G) and on-base plus slugging percentage (OPS), are expected to have positive coefficients, whereas ERA and RA/G are expected to have negative coefficients. Comparisons between indicators require consistent standardization and formal tests, and raw coefficients measured on different scales cannot establish their relative importance.
FP is hypothesized to correlate positively with team win rates, whereas per-game error volume is expected to exhibit a negative correlation with seasonal winning results. A positive regression coefficient for the lagged winning percentage aligns with sustained team performance across consecutive seasons 7. Notably, these persistent competitive trends do not stem directly from prior seasonal wins. Instead, they are likely attributable to long-term resource accumulation and various unmeasured contextual factors that shape a franchise’s consistent on-field performance.
Based on these theoretical arguments, the following hypotheses are formulated (Fig. 1):
-
H1:
ERA and RA/G are negatively associated with team winning percentage, conditional on other performance indicators and fixed effects.
-
H2:
OPS and R/G are positively associated with team winning percentage, conditional on other performance indicators and fixed effects.
-
H3:
FP is positively associated, and errors per game (E/G) is negatively associated, with team winning percentage, conditional on other indicators and fixed effects.
-
H4:
Lagged winning percentage is positively associated with the current winning percentage, conditional on current performance indicators and fixed effects.
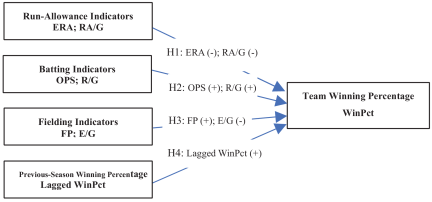
Fig. 1. Conceptual framework and research hypotheses. Note: Arrows indicate hypothesized associations, not causal effects; signs show expected directions conditional on other predictors and team and year fixed effects. RA/G includes fielding outcomes; ERA does not isolate pitching skill.
This empirical analysis tests the directional hypotheses in detail. Comparing relative predictive strengths across different athletic performance dimensions requires standardized comparative indicators and a systematic assessment of sampling uncertainty. Simply contrasting the raw regression coefficient magnitudes is an inappropriate and unreliable method for determining the relative importance of various performance inputs.
3. Method
3.1. Data
This work draws upon yearly‑aggregated team‑level statistics covering all 30 MLB franchises throughout regular‑season play spanning 2015 to 2024. This yielded a balanced panel comprising 300 team-season observations. Each individual team season served as the analytical unit, with all post-season game outcomes omitted from the sample.
Raw figures were gathered from open-access MLB statistical webpages. As per project documentation, data-gathering work commenced on or approximately May 1, 2026. The primary data resources include MLB’s publicly accessible team batting (https://www.mlb.com/stats/team), pitching (https://www.mlb.com/stats/team/pitching), and fielding (https://www.mlb.com/stats/team/fielding). Data retrieval applied season filters for the 2015–2024 range, retaining only regular season aggregate statistics at the team level for every downloaded dataset.
The extracted statistical variables covered core game metrics, including seasonal wins and losses, total contested games, runs produced and conceded, on-base percentage, slugging percentage, total pitching innings, earned runs, fielding putouts, assists, and defensive errors. All collected batting, pitching, defensive, and team performance data were sorted by franchise and competition season and then integrated into a unified panel using team IDs and corresponding years as matching keys. To eliminate merging discrepancies stemming from varying abbreviation formats and seasonal naming variations, all team labels were standardized across the entire study period. The integrated dataset underwent rigorous quality checks, including the removal of duplicate team-season entries, inspection of missing values in the core analytical variables, and verification of consistent league team coverage per season. The final curated sample contained valid observations for all 30 MLB teams over a ten-year study window.
All ratio metrics directly sourced from MLB official pages were preserved with their original data precision. For indicators derived from raw statistical components, computational calculations were completed prior to any rounding, with numerical rounding conducted solely for final result presentation. For accuracy in the innings-pitched ratio computations, the standard baseball fractional inning notation was converted to total outs before variable calculation. Specifically, decimal increments of 0.1 and 0.2 in official inning records were interpreted as one out and two outs, respectively, instead of standard decimal divisions, which adhered to the official MLB statistical computation protocols.
This balanced panel structure enabled the analysis of both cross-sectional disparities among league teams and longitudinal performance changes in individual franchises over the past decade. Such a data architecture is well-suited for empirical models that account for unchanging intrinsic team traits and universal seasonal factors affecting the entire league 8,9. While the full dataset comprised 300 team-season observational records, the effective sample size varied across model specifications. The inclusion of lagged performance variables and targeted sample filtering criteria may reduce the number of valid observations, with exact sample sizes clearly documented in the corresponding empirical results tables.
To validate the accuracy of the descriptive statistical outputs, the study re-extracted and cross-verified the 2015–2024 MLB team statistical data from the league’s public database on September 15, 2026. This secondary data reconstruction generated all the descriptive values presented in Table 2 in Section 4.1. However, the newly compiled team season dataset has not been fully aligned with the original sample adopted for core regression analyses in this research.
3.2. Variables
This study adopted the team winning percentage (WinPct) as the core dependent variable. Calculated as the ratio of total team wins to the sum of seasonal wins and losses, this metric is presented in proportional form and serves as a direct reflection of a franchise’s regular-season competitive performance each year. It represents a team’s regular-season competitive outcome in a given season (Table 1).
All predictive variables were grouped into three core categories—offensive output, run concession, and defensive performance—based on their functional roles in baseball game production 1,3 (Table 1). This study used R/G and OPS to quantify team batting capabilities. ERA was utilized to gauge the earned runs surrendered by pitchers every nine innings of play. Meanwhile, RA/G captures the overall effectiveness of a team’s run-suppression efforts; since it integrates both pitching and defensive outcomes, it cannot be viewed as a standalone indicator purely measuring pitching proficiency. For defensive evaluation, FP and E/G were applied to quantify successful defensive plays and recorded defensive mistakes, respectively.
Metrics within each functional group are statistically correlated and fail to offer fully independent evaluations of raw athletic skills. Most notably, ERA and RA/G share overlapping information regarding team run concession performance, whereas FP and E/G both rely partially on official error records for computation. Therefore, all the estimated coefficients in the model were interpreted as conditional correlations, which were quantified after controlling for the influences of other explanatory variables.
| Variable | Definition |
| WinPct | Wins divided by wins plus losses. |
| OPS | On-base percentage plus slugging percentage. |
| ERA | Nine times earned runs allowed, divided by innings pitched. |
| RA/G | Total runs allowed divided by games played. |
| R/G | Total runs scored divided by games played. |
| FP | Putouts plus assists, divided by putouts plus assists plus errors. |
| E/G | Total errors divided by games played. |
| Lagged WinPct | The same team’s WinPct in the preceding season. |
Classifying these statistical indicators into distinct groups serves solely as a structural framework for streamlined model estimation and result interpretation, rather than generating composite variables that represent holistic batting, pitching, or defensive performance. Each paired indicator within the same category adopts a unique measurement scale and exhibits statistical interdependence. As such, researchers cannot derive overall category-level effects through a simplistic coefficient summation or direct magnitude ranking. A rigorous comparison of the relative predictive contributions across different performance domains necessitates standardized estimation results along with clear aggregation strategies and formal hypothesis-testing protocols.
3.3. Model Specification
The baseline analysis uses a two-way fixed-effects model to estimate conditional associations between current-season team performance indicators and winning percentage, accounting for time-invariant team characteristics and conditions common to each season. The baseline specification is:
Here, \(i\) indexes teams and \(t\) indexes seasons. \(\text{WinPc}\text{t}_{i,t}\) denotes team \(i\)’s winning percentage in season \(t\). The terms \(\alpha_{i}\) and \(\lambda_{t}\) denote team and year fixed effects, respectively. The vector \(X_{i,t}\) contains six current-season indicators—R/G, OPS, ERA, RA/G, FP, and E/G—and \(\beta\) is the corresponding coefficient vector. Finally, \(\varepsilon_{i,t}\) is the error term.
The dynamic fixed effects specification adds the same team’s preceding-season winning percentage:
Here, \(\text{WinPc}\text{t}_{i,t-1}\) denotes the same team’s winning percentage in the preceding season, and \(\rho\) captures its conditional association with current-season winning percentage. A positive estimate would be consistent with performance persistence, but would not establish causal carryover. Serially correlated disturbances and omitted time-varying team characteristics may also contribute to the observed association. Estimating a fixed-effects model with a lagged dependent variable can introduce dynamic panel bias when the time dimension is short 14. Accordingly, this specification alone does not resolve endogeneity concerns or establish a causal relationship between past and current performance.
The system generalized method of moments (system GMM) is an independent estimation technique that demands transparent documentation of instrumental variables, valid moment constraints, stepwise estimation procedures, and comprehensive specification diagnostics 15,16,17. Notably, fixed-effects models augmented with lagged winning percentage terms are analytically distinct and should never be mislabeled as system GMM specifications. Prior to interpreting the dynamic coefficient outputs, researchers must verify valid sample coverage and confirm the sourcing of all lagged observational data.
Multiple sequential observations of individual franchises render robust covariance estimations critical for reliable statistical inferences. Team-level clustered standard errors allow statistical inference to account for heteroskedasticity and within-team residual correlation, although inference remains sensitive to the limited number of team clusters. Accordingly, cluster adjustment implementation must be verified explicitly through estimation outputs instead of the default assumption. Additionally, multicollinearity concerns arise from overlapping variable structures; ERA and RA/G reflect team run-conceding tendencies, whereas FP and E/G share foundational error-based statistical inputs. Thus, this study recommends examining pairwise correlation coefficients and variance inflation factor values across the analytical sample to detect multicollinearity risks 8,18. All regression outputs in this study were interpreted as conditional statistical associations rather than definitive causal relationships or hierarchical rankings of different athletic performance dimensions.
4. Empirical Results
4.1. Descriptive Statistics
Table 2 reports descriptive statistics for 300 team-season observations covering all 30 MLB teams during the 2015–2024 regular seasons. The mean winning percentage is approximately 0.500, consistent with the league-wide balance of wins and losses. Winning percentage ranges from 0.253 to 0.717, and R/G ranges from 3.130 to 5.846. These ranges summarize variation across the pooled team-season observations; they do not distinguish within-team from between-team or year-to-year variation. The numbers of observations used in individual regression models are reported separately.
| Variable | \(N\) | Mean |
Std. deviation |
Min. | Max. |
| WinPct | 300 | 0.500 | 0.082 | 0.253 | 0.717 |
| R/G | 300 | 4.512 | 0.482 | 3.130 | 5.846 |
| OPS | 300 | 0.731 | 0.039 | 0.618 | 0.847 |
| ERA | 300 | 4.222 | 0.561 | 2.800 | 5.840 |
| RA/G | 300 | 4.512 | 0.556 | 3.167 | 6.056 |
| FP | 300 | 0.984 | 0.003 | 0.976 | 0.991 |
| E/G | 300 | 0.562 | 0.094 | 0.333 | 0.840 |
Note: Statistics are based on 300 team-season observations covering all 30 MLB teams during the 2015–2024 regular season. WinPct, R/G, RA/G, and E/G were calculated from their underlying counts, whereas OPS, ERA, and FP were recorded with the precision reported in the MLB data. The standard deviations are sample standard deviations.
4.2. Fixed Effects Regression Results
Table 3 presents the fixed effects estimation outcomes replicated from the original empirical analysis. The documented within \(R^2\) value stands at 0.71, a goodness-of-fit metric that captures explanatory power for within-team performance fluctuations after absorbing time-invariant team and seasonal fixed effects. Importantly, this fit statistic does not validate causal identification across model variables. The estimated intercept term is reported as 0.502. Nevertheless, this numerical value is sensitive to fixed-effect normalization approaches and cannot be used to support the claim that MLB teams tend to converge toward a 0.500-win rate over time.
The regression outputs yield positive coefficients for R/G (0.084) and OPS (0.215), alongside negative estimates for ERA (\(-\)0.297) and RA/G (\(-\)0.112). For defensive metrics, FP carries a positive coefficient (0.063) while E/G produces a negative value (\(-\)0.041). All coefficient directions align with the study’s pre-defined theoretical expectations. These numerical results represent partial correlations conditioned on all remaining explanatory variables and fixed-effect controls. Direct comparison of raw coefficient magnitudes is inappropriate for ranking variable importance, given the inconsistent measurement scales and inherent informational overlap across indicators. Most critically, the RA/G metric encapsulates the total run concession outcomes instead of exclusively reflecting pitching quality.
Specialized validation is required before interpreting the substantive magnitude of the ERA coefficient. Researchers must crosscheck its measurement scale, rule out potential decimal or reporting errors, and confirm whether any predictors have undergone standardization by referencing the original dataset, model setup, and complete estimation logs. Therefore, this study avoided converting ERA fluctuations into corresponding predicted changes in team win rates or total seasonal wins. Even with full result verification, such numerical conversions would only illustrate algebraic shifts in model-fitted values under preset analytical assumptions, rather than proving causal impacts or generating reliable predictive forecasts. Any translation of statistical estimates into win totals must adopt the actual game count of each individual team season instead of applying a universal 162-game schedule assumption for all observations.
Interpretations of statistical significance are contingent on the specific covariance estimator used to generate the standard error values. All reported standard errors and significance test results require validation against the original variance-covariance framework or re-estimation via a formally documented team-clustered covariance approach to ensure robustness. A comprehensive assessment of indicator overlaps and standardized variable comparisons further requires pairwise correlation analysis, variable-specific variance inflation factor scores, and descriptive standard deviation data. Until these systematic validation procedures are completed, all numerical estimates listed in Table 3 should be regarded as preliminary documented outputs rather than independently verified empirical conclusions.
| Variable |
Reported coefficient |
Reported standard error |
| R/G | 0.084 | 0.011 |
| OPS | 0.215 | 0.048 |
| ERA | \(-\)0.297 | 0.021 |
| RA/G | \(-\)0.112 | 0.015 |
| FP | 0.063 | 0.028 |
| E/G | \(-\)0.041 | 0.017 |
| Intercept | 0.502 | 0.019 |
Note: Values, including within \(R^2=0.71\), reproduce the original report and remain unverified. ERA scale and standard error methods require confirmation against the data and model output. Therefore, the test statistics and significance symbols are omitted.
4.3. Performance Indicator Patterns and Comparison Scope
The results were interpreted at the level of individual indicators rather than as the estimated effects of composite batting, pitching, or fielding variables. Table 4 summarizes the indicators associated with each directional hypothesis. The previously reported dimension-level figures (\(-\)0.62, \(+\)0.46, and \(+\)0.18) are omitted because their standardization and aggregation procedures cannot currently be verified.
| Analytical group | Indicators | Hypothesized directions | Dimension-level comparison |
|
Run allowance |
ERA; RA/G |
ERA (\(-\)); RA/G (\(-\)) |
Not estimated |
| Batting | OPS; R/G |
OPS (\(+\)); R/G (\(+\)) |
Not estimated |
| Fielding | FP; E/G |
FP (\(+\)); E/G (\(-\)) |
Not estimated |
Note: Groups organize indicators but are not estimated composite variables. RA/G reflects the overall run allowance, including field-related outcomes. No ranking or statistical contrast is reported between the groups.
For the coefficients estimated in their original units, standardization multiplies each coefficient by its predictor’s standard deviation and divides the result by the standard deviation of winning percentage. In a fixed-effects model, the analysis must specify whether both standard deviations are calculated from pooled observations or from variables adjusted for team and year effects. These two approaches have different interpretations and should not be mixed. Standardization does not resolve collinearity between related indicators.
The standardized coefficients of the two indicators cannot be simply added to obtain a group-level effect. Such an effect would require a prespecified composite with a stated direction and weighting rule, followed by a model re-estimation. Alternatively, a comparison based on a jointly defined change in the original predictors would require a prespecified linear contrast and its variance–covariance matrix; uncertainty could then be evaluated using an appropriate Wald test or bootstrap procedure. No such analyses are reported here.
The signs of the originally reported individual coefficients are consistent with the revised directional hypotheses H1–H3. They suggest that higher batting indicators and lower run allowance indicators are accompanied by a higher winning percentage, conditional on the other variables in the model. They do not establish the relative importance of the three groups, the value of a run scored relative to a prevented run, or the substitution among performance inputs. Statistical conclusions regarding the individual coefficients remain subject to verification of the estimation output and covariance specification described in Section 4.2.
4.4. Dynamic Specification and Sensitivity Checks
Models (1)–(4) document the specifications described in the original analysis. Model (2) excludes OPS, Model (3) excludes ERA while retaining the baseline RA/G measure, and Model (4) omits the year-fixed effects. The originally reported coefficients are retained in Table 5 solely to identify the numerical results requiring an audit. Similar reported signs across columns cannot presently establish robust associations or reliable statistical significance; the analytical data, variable scales, model outputs, and covariance estimators have not been jointly verified.
The intended Model (5) adds the same team’s preceding season winning percentage. Its originally reported numerical results, including a lagged WinPct coefficient of 0.42, all other coefficients and standard errors, the intercept, and within \(R^2\), are withheld from Table 5. Determining the effective observation count alone would not validate those estimates. The regression data and code must establish whether Model (5) was estimated as dynamic fixed effects or by another method, how the lag was matched by team and year, which observations entered the estimation, and how the statistical uncertainty was calculated.
| Variable |
(1) Baseline two-way FE |
(2) Excluding OPS |
(3) Excluding ERA |
(4) Team FE only |
(5) Lagged-outcome model |
| R/G | 0.084 (0.011) | 0.121 (0.013) | 0.079 (0.012) | 0.081 (0.012) | — |
| OPS | 0.215 (0.048) | — | 0.208 (0.051) | 0.210 (0.049) | — |
| ERA | \(-\)0.297 (0.021) | \(-\)0.301 (0.022) | — | \(-\)0.289 (0.022) | — |
| RA/G | \(-\)0.112 (0.015) | \(-\)0.118 (0.016) | \(-\)0.126 (0.017) | \(-\)0.109 (0.016) | — |
| FP | 0.063 (0.028) | 0.058 (0.029) | 0.061 (0.028) | 0.060 (0.029) | — |
| E/G | \(-\)0.041 (0.017) | \(-\)0.039 (0.018) | \(-\)0.043 (0.017) | \(-\)0.040 (0.018) | — |
| Lagged WinPct | — | — | — | — | — |
| Intercept | 0.502 | 0.488 | 0.495 | 0.498 | — |
| Observations | \(300^1\) | \(300^1\) | \(300^1\) | \(300^1\) | — |
| Team fixed effects | Yes | Yes | Yes | Yes | To be verified |
| Year fixed effects | Yes | Yes | Yes | No | To be verified |
| Within \(R^2\) | 0.71 | 0.69 | 0.72 | 0.68 | — |
Note: Columns (1)–(4) reproduce the unverified original values; their standard errors and observation counts require confirmation. In these columns, dashes indicate the excluded variables. In Model (5), the dashes indicate the results withheld pending verification of the estimator, lag construction, sample, and output. Significance symbols have been omitted.
If the lagged variables are strictly constructed based on the 2015–2024 panel dataset, every team lacks valid prior season observational data for the 2015 season. In the absence of additional sample filtering rules, this data limitation would result in a valid sample of 270 team-season observations, calculated as 30 teams across nine eligible seasons. To retain the 2015 sample entries within the lagged regression framework, complete and verified 2014 team winning percentage data as well as accurate cross-season data matching records are mandatory. These figures serve only as conditional sample size calculations and do not confirm that Model (5) adopted either the 270-observation or the full 300-observation sample for the estimation.
Prior to formally incorporating Model (5) outputs into the results table, researchers must either re-run the complete model estimation or align the empirical settings precisely with the original recorded outputs. The systematic verification process must cover multiple key dimensions: the measurement scale of ERA variables, all applied variable transformations, model-specific sample screening criteria, regression coefficients and standard errors, variance-covariance estimation methods, statistical degrees of freedom, and overall model fit statistics. Furthermore, analytical content, including team-level clustered statistical inference, 2020 seasonal robustness checks, and system GMM estimation, alongside its diagnostic tests, should only be presented when relevant operations are fully implemented and properly documented. Prior to completing these validation steps, Model (5) outputs are insufficient to test the statistical validity of the fourth research hypothesis (H4) or support any causal assertion regarding persistent team competitive performance.
5. Discussion
The signs of the originally reported baseline coefficients are consistent with the directional expectations in H1–H3. These patterns remain provisional pending verification of the estimation results and statistical inference. H4 cannot currently be evaluated because the dynamic estimates remain unverified. These hypotheses concern conditional associations in team-season panel data rather than causal relationships or the relative importance of offensive production, run prevention, and fielding performance.
In terms of the first hypothesis (H1), the negative coefficients of ERA and RA/G corroborate the functional importance of run suppression capabilities in determining baseball team competitiveness 1. While ERA quantifies earned runs conceded by pitchers across nine innings, and RA/G tracks total runs surrendered per contest, neither metric can fully separate pure pitching proficiency from situational game factors. Notably, RA/G values are directly affected by on-field defensive performance. Owing to the substantial informational overlap between the two run-concession indicators, their respective coefficient estimates cannot be decoupled to independently reflect the pitching and defensive contributions. In this regard, the current model specification captures only the statistical patterns of run concession rather than untangling the fundamental interactive relationships of on-field production factors.
For the second hypothesis (H2), the positive estimation results for OPS and R/G align with existing scholarly conclusions that offensive productivity drives team competitive success 6. OPS integrates on-base ability and slugging performance, whereas R/G serves as a direct indicator of a team’s scoring efficiency. Both offensive metrics are measured synchronously with seasonal win rates, with scoring behaviors inherently intertwined with the match outcomes that generate a team win. As such, these estimated values only reflect the synchronous covariation between offensive indicators and winning performance under the control of other variables, without distinguishing the differential influential magnitude of distinct offensive metrics. Rockerbie’s translog production model 11 formally quantifies the substitution relationships among hitting, pitching, and defense, further proving that factor substitutability cannot be judged simply based on the raw coefficient magnitudes from this study’s regression outputs.
Regarding the third hypothesis (H3), the positive coefficient of FP and the negative coefficient of per-game errors match the expected correlation between recorded defensive performance and team winning status. FP aggregates the completion rate of standard defensive opportunities, whereas per-game error counts quantify defensive mistakes across contests. Nevertheless, both indicators fail to capture the full spectrum of defensive values, such as wide-range field coverage and uncredited defensive stops. Additionally, defensive performance indirectly shapes team run concession levels, which have already been incorporated into other model variables. Accordingly, the estimated defense coefficients merely represent the conditional correlations of these limited statistical measures rather than a comprehensive quantification of the total defense contribution value.
The fourth hypothesis (H4) explores whether a franchise’s prior-year winning record carries conditional statistical relevance to its current season’s competitive performance. While the original regression yields a positive lagged coefficient, this result remains unverified and thus cannot support statistical testing of H4. Long-term institutional factors, including franchise resource reserves and player training systems, are potential drivers of sustained team performance and warrant further exploration 13. However, these elements are not incorporated into the current empirical framework. Even if the lagged variable estimates are fully validated in subsequent checks, the fixed-effects model outputs alone cannot confirm causal performance path dependence, nor can they serve as evidence for system GMM model implementation.
Recent research has further qualified how these team-level patterns should be generalized. Lee and Lee 10 modeled cross-team dependence in MLB win production, a relationship not estimated in the present fixed-effects specifications. Cairney et al. 12 found that the relative contributions of offensive and defensive indicators varied across historical eras. Together with Rockerbie 11, these studies support the examination of performance indicators within a broader production framework, while cautioning against treating a single panel’s coefficient pattern as a universal hierarchy.
The uncertainty-of-outcome hypothesis centers on how competitive unpredictability influences spectator engagement and sports viewership attractiveness 19. This theoretical perspective is distinct from the performance persistence hypothesis investigated in this study and must not be confused. Because the team-level seasonal winning percentage cannot capture audience consumption behaviors or spectator feedback metrics, the two research constructs address entirely different research domains. Accordingly, the theoretical contributions of this study are targeted and context-specific. This study integrates offensive, run-conceding, defensive, and lagged performance metrics within a unified panel modeling framework while clearly defining the scope of valid statistical associations obtained from this empirical setup. It deliberately separates unexplored research topics, including comparative athletic production effects and spectator behavioral responses, as independent research directions for future scholarly inquiries.
6. Conclusion and Recommendations
6.1. Conclusion
This study analyzed offensive, run-conceding, and defensive statistical indicators based on a 2015–2024 team season panel dataset of MLB franchises. The baseline static regression results generated positive coefficient values for R/G, OPS, and FP, along with negative estimates for ERA, RA/G, and E/G. Such directional trends align with the updated theoretical expectations for H1–H3, although full validation relies on systematic checks of the regression dataset, variable measurement scales, and statistical inference procedures. A dynamic specification incorporating lagged winning outcomes is adopted to test the fourth hypothesis (H4); however, the original estimated outputs remain unconfirmed until the estimation approach, lag variable construction rules, valid sample range, and complete model results are fully verified. Therefore, this study refrains from drawing definitive empirical judgments regarding H4 at this stage.
Notably, the analytical outcomes cannot support causal inferences or identify statistically significant disparities across the different athletic performance categories. ERA and RA/G are highly correlated metrics that reflect team run-conceding performance, with RA/G being unable to isolate pure pitching effectiveness from other game factors. In addition, the unverified dimensional estimation results cannot serve as a credible basis for ranking the relative importance of offensive production, run suppression, or defensive performance. This study establishes a comprehensive analytical framework to explore the statistical correlations within team season panel data. Nevertheless, all numerical research findings are conditional on the subsequent validation of the original analytical dataset, variable coefficient scales, standard error calculations, and dynamic model operationalization processes.
6.2. Recommendations
The analytical framework developed in this study enables baseball management teams to comprehensively evaluate offensive productivity, overall run concession situations, and standardized defensive performance instead of relying solely on individual isolated statistical indicators. For practical decision-making applications, practitioners must adopt fully documented and validated datasets, report estimation results along with statistical uncertainty, and explicitly clarify the informational overlap among different performance metrics. The regression results presented in this research do not provide empirical evidence to support a universal investment strategy that prioritizes pitching resources, nor can they quantify the practical returns of specific team decisions, including talent scouting, coaching arrangements, and injury risk management.
In addition, developing reliable predictive tools for team decision-making requires the exclusive adoption of accessible data prior to decision implementation. As the proposed model incorporates contemporaneous seasonal statistics observed simultaneously with winning records, the derived correlational results are not applicable to preseason performance forecasting. Follow-up predictive research can adopt authentic preseason variables and lagged historical data as model inputs, conduct out-of-sample verification based on chronological season division, and compare the model performance against basic benchmark algorithms. All empirical validations and the development of data dashboards and simulated scenario analysis tools are future research directions rather than the verified achievements of the current study.
6.3. Limitations
This study’s empirical design relies exclusively on regular-season aggregated team-level statistics, which prevents it from unpacking individual player-level mechanisms or accounting for time-varying organizational factors. These unmeasured contextual variables include team payroll fluctuations, roster rotation frequency, player injury status, coaching adjustments, and talent scouting quality. The adopted two-way fixed effects structure absorbs only the time-constant team heterogeneity and league-wide seasonal trends, leaving dynamic institutional changes unaddressed. Further empirical limitations stem from inherent metric flaws; ERA and RA/G exhibit substantial informational overlap in measuring run concessions, whereas FP and E/G reflect only partial, officially recorded defensive behaviors rather than complete on-field defensive values. Additionally, all offensive, pitching, and defensive predictors were measured concurrently with seasonal winning rates as they were derived from identical game samples. This synchronous measurement restricts the study’s capacity for causal inference and forward-looking predictive interpretation.
Multiple data consistency and empirical inference limitations remain unresolved in this analysis. The supplementary team-season dataset reconstructed on September 15, 2026, to generate Table 2 descriptive statistics has not been fully cross-calibrated against the original sample employed for the core regression estimation. The dynamic model with a lagged winning percentage also requires a comprehensive validation of its effective sample size and estimation approach. Specifically, retaining the 2015 seasonal observations in the lagged specification necessitates verifiable documentation and accurate matching of each team’s 2014 winning percentage data. Moreover, the abbreviated 2020 competition season may introduce outliers that distort the cross-season comparative results; however, targeted robustness checks, such as excluding the 2020 sample or conducting other seasonal sensitivity tests, have not been implemented. Reliable significance testing also requires formal confirmation of the covariance estimation method because team-level clustered standard error adjustment has not been formally verified or documented in the empirical workflow. Repeated observations of the same franchise may involve within-team error correlation, making the choice of covariance estimator important for valid statistical inferences 20.
Crucially, fixed-effects models augmented with lagged winning percentage variables are methodologically distinct from system GMM estimation. This study neither verifies nor reports the valid instrumental variable design, moment constraints, or specialized diagnostic tests required for system GMM implementation. In dynamic fixed effects models, the inclusion of a lagged dependent variable can introduce estimation bias when the time dimension is short 14. Short-panel estimation bias and unaccounted serial correlation, along with omitted time-variant team characteristics, may distort the accuracy of the dynamic coefficient estimates. Furthermore, cross-franchise interactive correlations 10 and temporal heterogeneity in sports production relationships across different baseball periods 12 limit the generalizability of the findings to other research contexts. Collectively, these methodological and data constraints temper the validity of the statistical significance judgments, causal explanatory claims, and practical resource allocation recommendations drawn from the empirical results.
Acknowledgments
AI tools (specifically, Gemini 3 and ChatGPT-4o) were used solely for English language editing and polishing. All research designs, analyses, and conclusions were independently performed and verified by the authors.
- [1] G. W. Scully, “Pay and performance in Major League Baseball,” The American Economic Review, Vol.64, No.6, pp. 915-930, 1974.
- [2] B. James, “Bill James’ Baseball Abstract,” Ballantine Books, 1985.
- [3] T. M. Tango, M. Lichtman, and A. Dolphin, “The book: Playing the percentages in baseball,” Potomac Books, 2007.
- [4] M. Lewis, “Moneyball: The art of winning an unfair game,” W. W. Norton & Company, 2003.
- [5] B. S. Baumer and A. Zimbalist, “The sabermetric revolution: Assessing the growth of analytics in baseball,” University of Pennsylvania Press, 2014.
- [6] J. Albert and B. S. Baumer, “Analyzing baseball data with R (2nd ed.),” FL: Chapman & Hall/CRC, 2018.
- [7] S. Szymanski, “The economic design of sporting contests,” J. of Economic Literature, Vol.41, No.4, pp. 1137-1187, 2003. https://doi.org/10.1257/002205103771800004
- [8] J. M. Wooldridge, “Econometric analysis of cross section and panel data (2nd ed.),” The MIT Press, 2010.
- [9] B. H. Baltagi, “Econometric analysis of panel data (6th ed.),” Springer, 2021.
- [10] J. Lee and Y. H. Lee, “Development of a Win Production Function and Evaluation of Cross-Sectional Dependence,” J. of Sports Economics, Vol.22, No.4, pp. 412-431, 2021. https://doi.org/10.1177/1527002520983438
- [11] D. W. Rockerbie, “Team Production and Factor Substitution in Major League Baseball,” Int. J. of Empirical Economics, Vol.04, No.03, Article No.2550006, 2025. https://doi.org/10.1142/S2810943025500064
- [12] J. Cairney, S. Townsend, D. M. Y. Brown, J. D. Graham, V. Richard, and M. Y. W. Kwan, “The golden ratio in baseball: the influence of historical eras on winning percentages in major league baseball,” Frontiers in Sports and Active Living, Vol.5, 2023. https://doi.org/10.3389/fspor.2023.1273327
- [13] J. Barney, “Firm resources and sustained competitive advantage,” J. of Management, Vol.17, No.1, pp. 99-120, 1991. https://doi.org/10.1177/014920639101700108
- [14] S. Nickell, “Biases in dynamic models with fixed effects,” Econometrica, Vol.49, No.6, pp. 1417-1426, 1981. https://doi.org/10.2307/1911408
- [15] M. Arellano and S. Bond, “Some tests of specification for panel data: Monte Carlo evidence and an application to employment equations,” The Review of Economic Studies, Vol.58, No.2, pp. 277-297, 1991. https://doi.org/10.2307/2297968
- [16] R. Blundell and S. Bond, “Initial conditions and moment restrictions in dynamic panel data models,” J. of Econometrics, Vol.87, No.1, pp. 115-143, 1998. https://doi.org/10.1016/S0304-4076(98)00009-8
- [17] M. Arellano and O. Bover, “Another look at the instrumental variable estimation of error-components models,” J. of Econometrics, Vol.68, No.1, pp. 29-51, 1995. https://doi.org/10.1016/0304-4076(94)01642-D
- [18] J. F. Hair, W. C. Black, B. J. Babin, and R. E. Anderson, “Multivariate data analysis (7th ed.),” Pearson, 2010.
- [19] S. Rottenberg, “The baseball players’ labor market,” J. of Political Economy, Vol.64, No.3, pp. 242-258, 1956. https://doi.org/10.1086/257790
- [20] A. C. Cameron and D. L. Miller, “A practitioner’s guide to cluster-robust inference,” J. of Human Resources, Vol.50, No.2, pp. 317-372, 2015. https://doi.org/10.3368/jhr.50.2.317
This article is published under a Creative Commons Attribution-NoDerivatives 4.0 Internationa License.