
Research Paper:
Attention Mechanism Guided Content-Aware No-Reference Image Quality Assessment
Guohong Zhou*,†
 and Longsheng Wei**
*Shanxi Key Laboratory of Ophthalmology, Shanxi Eye Hospital
No.100 Fudong Street, Xinghualing District, Taiyuan, Shanxi 030002, China
†Corresponding author
**School of Artificial Intelligence and Automation, China University of Geosciences
No.388 Lumo Road, Hongshan District, Wuhan, Hubei 430074, China

No-reference image quality assessment (NR-IQA) quantifies image distortion. It plays an important role in computer vision. Distorted images vary greatly in content. Many existing methods tend to fuse content information with quality prediction. However, they often overlook human visual perception. To address this issue, we propose an attention-guided content-aware NR-IQA method. It combines meta-learning with image content understanding. The approach uses refined deep semantic features for quality evaluation. First, we train a meta-model on a baseline network. This improves sensitivity to diverse distortions. Second, we insert an attention module into the meta-model. This captures global information and highlights important regions. We also fuse multi-level semantic features. This enables a comprehensive description of both local and global distortions. Finally, we reduce feature dimensions and learn weights to predict the quality score. Extensive experiments show that our method achieves results closer to human perception. It effectively focuses on regions of interest during feature extraction.
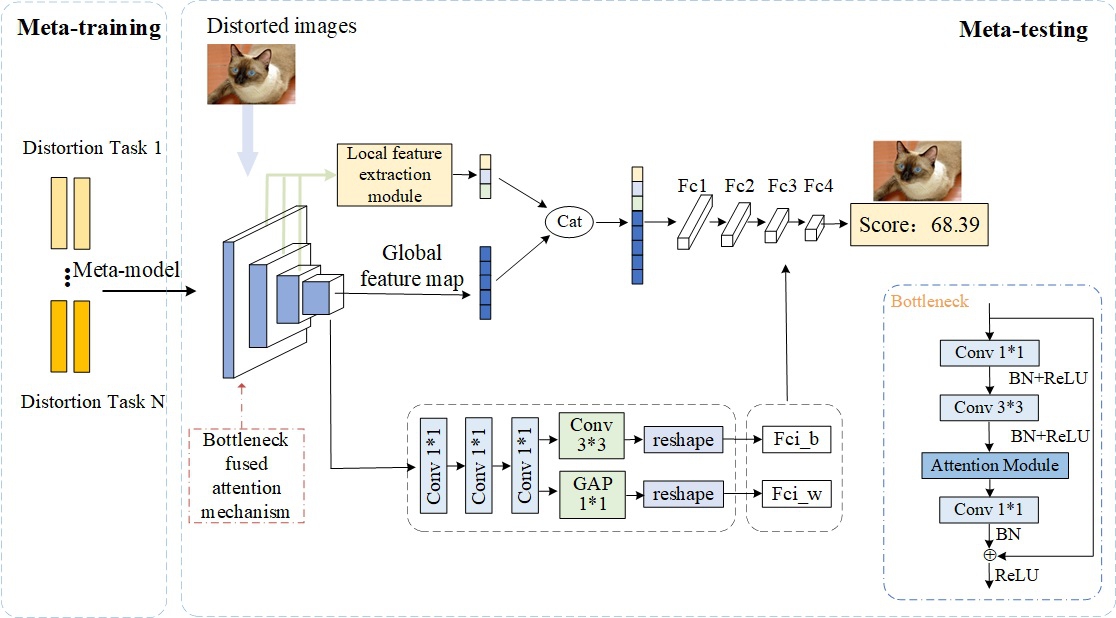
The framework diagram of the paper
1. Introduction
Recently, the development of smart devices and social media platforms has accelerated dramatically, and user generated content (UGC) is growing exponentially. Unprofessionally produced UGC images often have authentic distortion, which has been a challenging problem in image quality assessment (IQA) 1. Since humans are the main users of images, the most accurate assessment method is the subjective IQA method based on the human visual system (HVS) 2. However, the subjective IQA is laborious, time-consuming, and inconvenient to use, so it is important to construct a reasonable and close to HVS for objective IQA. According to the role of reference image in quality assessment, objective IQA methods are usually divided into three categories: full-reference (FR), reduced-reference (RR), and no-reference (NR). Most of the FR-IQA and RR-IQA methods can achieve satisfactory results because the images or image features are used as references. However, in real application scenarios, NR-IQA methods have grown to the mainstream research direction because valid reference images or image features are often not available.
Since deep learning networks can realize not only the mapping of image features to quality scores, but also the extraction of image features for end-to-end evaluation process, IQA methods of deep learning have attracted the attention of many scholars, and various deep convolutional neural networks (DCNN)-based evaluation models have emerged.
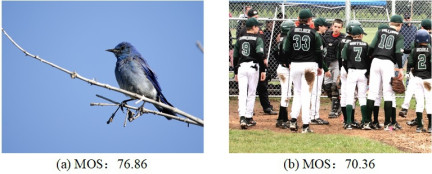
Fig. 1. Effect of different image contents to MOS.
The DCNN-based approaches learn the mapping of image features to perceptual quality scores, focusing on extracting distortion information from images, while lacking image content information. The HVS top-down perception model suggests that humans first comprehend images before assessing their quality 3. It is argued in the existing literatures that when humans score images, images with a greater proportion of flat areas tend to be of better quality 4, and the effect of image content on mean opinion score (MOS) values is shown in Fig. 1. As can be seen in Fig. 1, the left image is more blurry than the right image, but the left image has a higher MOS value. This is mainly influenced by the contrast sensitivity, where the human eye can ignore visual stimuli that exceed a specific perceptible threshold; for example, the presence of the vast blue-sky background in the left image is more pleasant than the complex crowd image.
To address these issues, we propose solutions in terms of the diversity of content of distorted images, the complexity of distortion as well as the uneven distribution of human visual attention to distorted images. We take full account of the perceptual mechanisms of HVS to assess image quality based on an understanding of image content. In this paper, we propose an attention mechanism guided content-aware NR-IQA approach to address the challenges present in naturally distorted images. In summary, our main contributions can be summarized as follows:
-
(1)
To be better conform with the human perception process, deep semantic information is extracted from images. We adaptively adjust the rules of learning perceptual quality according to the content of the image after learning the content features of the image. At the same time, we extract the multi-level features of the image and fully describe the details to accurately capture the global and local distortion.
-
(2)
Due to the complexity of distortion types and the limitations of the annotation data, a meta-learning strategy is introduced to enhance the overall network’s ability to extract distortion-sensitive features. The meta-learning method is used to learn the distortion information in the images and enhance the accuracy of the network for quality score prediction.
-
(3)
By simulating the selective spatial attention and contrast sensitivity of HVS, the polarized self-attention module (including spatial and channel attention) of the image quality model is introduced. The attention module captures global distortion and local distortion, assisting the network’s understanding of image content and improving the network’s performance in perceiving distortion types.
2. Related Work
2.1. NR-IQA Methods for Synthetic Distortion
Artificial synthetic distortion commonly includes Gaussian noise, motion blur, and JPEG compression distortion; i.e., image quality is degraded by adding various degradation factors artificially. Traditional methods for synthetic distortion are generally divided into those based on natural scene statistics (NSS) and those based on feature learning. These methods first extract hand-designed features from the image and then apply a shallow regression model to regress these features into a predicted quality score. NSS-based methods combine space- or frequency-domain features of the image for quality assessment 5. Feature-based learning methods, such as CORNIA 6, automatically learn quality-aware features from data. Although such blind image quality evaluation methods based on manual feature extraction can be good at predicting image quality scores for specific distortion types, manual features are often difficult to design, and shallow regression models. This makes it difficult to cope with complex distortion information in the real world, resulting in a lack of prediction accuracy.
With the popularity of deep learning, image quality evaluation methods for deep learning have been introduced successively 7. Thanks to the shared parameters of multi-task learning, the risk of model overfitting can be reduced, but it cannot be applied to real distorted images. To alleviate the difficulties in training the network due to the small training dataset in the NR-IQA task, Wu et al. 8 proposed a lightweight quality evaluation method to extract the hierarchical features of images, which greatly reduces the parameter complexity of the network while ensuring prediction accuracy. However, it cannot be applied to real distorted images because there is no reference image for real distorted images to train the generator.
Although many of the NR-IQA methods described above have made great advances in the performance of synthetic distortion databases, they cannot be applied to real distorted images. They are not truly general NR-IQA methods and still present challenges when dealing with large-scale data.
2.2. NR-IQA Methods for Authentic Distortion
Approaches for deep learning have made great breakthroughs in the quality evaluation of true distortion. To consider true distortion on top of processing synthetic distorted images, a deep bilinear CNN for quality prediction was proposed by Zhang et al. 9, and an end-to-end solution was achieved for quality assessment of synthetic and true distorted images. Su et al. 3 proposed an adaptive hyper network to cope with true distortion, dividing the quality assessment process into three steps: content understanding, perceptual rule, and quality prediction. Zhu et al. 10 used meta-learning to learn a prior model applied to image quality to improve the accuracy of predictions. Based on this, Zhu et al. 11 further proposed MetaIQA+ to select representative synthetic distortion tasks for the meta-training process through a task selection strategy, effectively reducing the requirement for training data and significantly improving the generalization capability of the model.
In summary, most of the literatures use residual networks with traditional convolution focusing mostly on distorted information about local relationships and failing to capture the global relevance features of images. We build on existing methods to take full account of the perceptual mechanism of HVS and focus on the impact of image semantics on perceptual quality. We also adaptively construct the connection between local regions and the global space in the network model, and initialize the parameters of the model through meta-learning method to improve model generalization capability.
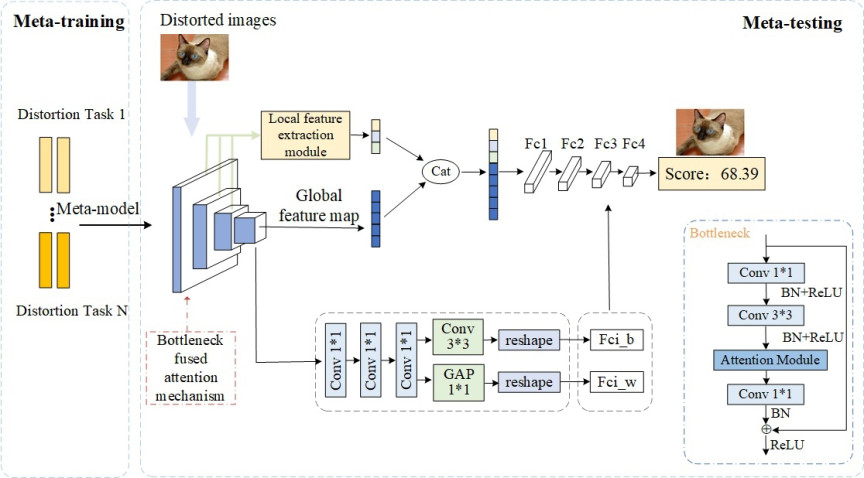
Fig. 2. Framework diagram of the content-aware IQA method guided by attentional mechanism.
3. Proposed Method
To consider both the rich content information and distortion information of distorted images, an attention mechanism-guided content-aware image quality evaluation method is proposed in this paper. As shown in Fig. 2, our method mainly includes two stages: meta-training and meta-testing, in which the quality evaluation process is divided into three parts: meta-model construction based on the attention mechanism, semantic feature extraction, and adaptive quality prediction.
In the meta-training stage, ResNet50 is selected as the base network. With an input image \(x\), the quality score obtained by training the meta-model is expressed as:
In the meta-testing stage, the model is fine-tuned according to the target datasets and the polarized self-attention (PSA) module is introduced for extracting image features. Firstly, the distorted image is input into the model to get the feature vector \(X\in R^{C\times H\times W}\), where \(C\) is the number of channels, \(H\) and \(W\) are the height and width of the features, respectively. Then, the weighted combinations of features are learned along two dimensions: channel-specific and channel-specific weights. The obtained attention map \(Z\) and \(X\) have the same size and dimension \(C\times H\times W\).
Since the content in the image is multi-scale and spatially variable, to avoid the loss of detailed information of the image with the deep network, the feature map \(Z\) and the local features of Layers 1–3 layers in the model are fused to obtain a multi-level feature map. Using the feature \(Z\) containing the semantic information of the content, the weights and biases of the target network are adaptively adjusted to perform quality prediction by four fully connected layers. The final quality prediction process can be expressed as:
3.1. Meta-Model Based on Attention Mechanism
In IQA scenarios, image regions with objects of interest or relevant to quality assessment tasks usually receive more attention than other regions, so the attention mechanism can effectively enhance the performance of assessment methods and solve the problems of traditional standard convolution. The attention mechanism introduced in this paper can effectively utilize global information and give different attention to focus on pixel-level semantic information to obtain more accurate feature information. We introduce a pixel-level spatial attention mechanism and a channel attention mechanism PSA based on the meta-model, which are added after the first \(3\times3\) convolutional layer of the model network bottleneck.
For robustness and computational efficiency, commonly used networks such as residual networks, the attention module in this paper has not been greatly compressed in both spatial and channel dimension, keeping the size of \([H, W]\) in the spatial dimension and using the size of \(C\)/2 in the channel dimension.
In the channel attention calculation, the feature maps are converted into \(V\) of size \(C/2\times H\times W\) and \(Q\) of size \(1\times H\times W\) by \(1\times 1\) convolution, where the channel of \(Q\)s completely compressed while the channel dimension of \(V\)s still kept at a relatively high level. \(X_{ch}^1\) and \(X_{ch}^2\) are obtained by shape reshaping \(V\) and \(Q\). Since the channel dimension of \(X_{ch}^2\) is compressed, softmax is used to enhance its information. Then matrix multiplication is performed to obtain \(X_{ch}\), denoted as:
When evaluating the image quality, viewers usually pay different attention to different image regions. Similar to channel branching, in the spatial attention mechanism, the feature maps are converted into \(V\) and \(Q\) of size \(C/2\times H\times W\) by \(1\times 1\) convolution. For feature \(Q\), the spatial dimension is compressed using global pooling, which is converted to a size of \(1\times1\), while the spatial dimension of \(V\) features is kept at a relatively large level. After reshaping \(X_{sp}^1\) and \(X_{sp}^2\) are obtained, since the spatial dimension of \(X_{sp}^2\) is compressed, similarly its information is augmented by softmax. \(X_{sp}\) is obtained by matrix multiplication, denoted as:
Then use reshaping to get \(X_{sp}^*\) continue using sigmoid to get the spatial weights, which can be calculated as:
Inspired by early psycho-visual experiments that the critical frequency of contrast sensitivity may be influenced by spatial attention, the spatial and channel weights were multiplied with the original feature maps in their respective dimensions, and the results of the two branches were fused to obtain the final feature maps as follows:
Our attention module fully exploits the modeling capability of the self-attentive mechanism and achieves a more effective long-range modeling with guaranteed computational efficiency. At the same time, the softmax–sigmoid combination makes full use of the high-resolution information stored in the attention module branch.
3.2. Semantic Feature Extraction
For human visual system, the top-down visual perception mechanism has verified that human can comprehend the content of an image before perceiving the quality of the image. However, many current NR-IQA methods ignore the extraction of image content information and lead to a gap with human visual perception. To simulate the working mechanism of HVS, Li et al. 4 fused the quality evaluation task with the semantic recognition task by using a pre-trained image classification network to extract the semantic information in the image, where the features of the last convolutional layer are used to fit the quality score.
In this paper, we combine low-level detail information and deep semantic information to take advantage of the complementary feature strengths between different convolutional layers, which facilitates the network to capture distortion information of distorted images. To extract richer content-aware features, we extract multi-level features from the convolutional layers: Layer 1 (\(256\times56\times56\)), Layer 2 (\(512\times28\times28\)), and convolutional Layer 3 (\(1024\times14\times14\)) in ResNet50 instead of using only the deep semantic features of the last convolutional layer. The local feature extraction module is illustrated in Fig. 3.
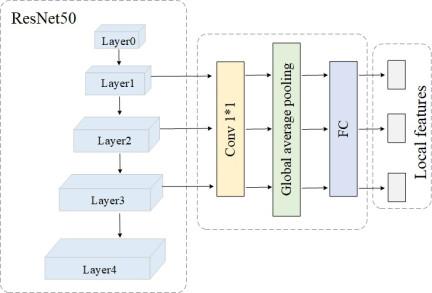
Fig. 3. Local feature extraction module.
To reduce the network parameters for fast computation, \(1\times1\) convolution is applied in the local feature extraction branch to reduce the dimensionality. Moreover, the global average pooling operation is performed to reduce the dimension while retaining more picture information for feature fusion. Finally, the refined multi-level features are mapped into vectors by a fully connected layer. With the introduction of multilevel features, the network can now be defined as follows:
3.3. Adaptive Quality Prediction
After combining multi-level features and attention mechanisms, the final quality prediction model can be expressed as:
4. Experiments
In this section, the experimental setup and the experimental results on the public datasets are presented. The experimental setup includes dataset selection, implementation details, and evaluation metrics.
4.1. Implementation Details
The overall training process of our proposed network consists of the following two steps: (1) during the meta-training phase, the residual networks RestNet50 is trained using the specific distortion NR-IQA tasks constructed from synthetic distortion datasets; (2) during the meta-testing phase, the content-aware network based on the attention mechanism is trained on each dataset. During network training, the network parameters were uniformly trained 16 times using an Adam optimizer with the weight decay rate of 5e\(^{-4}\) and learning rate of 2e\(^{-5}\). Evaluation metrics were used to measure the predicted results using Spearman’s rank order correlation coefficient (SROCC) and Pearson linear correlation coefficient (PLCC).
This paper uses six public datasets: TID2013 12, Kadid-10k 13, LIVE 14, CSIQ 15, LIVEC 16, and KonIQ-10k 17 datasets. We use meta-learning for training and testing. Meta-learning involves two levels of validation: one is intra-task validation, i.e., query set, whose loss is used to calculate meta-gradients, which directly participate in the update of outer parameters; the other is inter-task validation, i.e., meta-validation set, to prevent meta-overfitting. When selecting a model for performance testing, we stop early on the validation set. In the experiment, the training set contained 16,749 images, and the validation set contained 3,140 images.
The input images are randomly sampled and horizontally flipped into 25 image blocks of size \(224\times224\) pixels, during training, and the scores of the image blocks sampled in each image are averaged to obtain the final prediction scores during testing. Since the datasets used are all small sample datasets, selecting the appropriate batch-size when adjusting the model parameters can improve the training efficiency and accuracy, so the batch-size of each dataset is adjusted while other parameters are determined: batch-size is 72 for the KonIQ-10k dataset, 96 for the LIVEC dataset, and 72 for the LIVE and CSIQ datasets. Finally, the predicted quality scores and labeled scores are trained by minimizing \(L\) loss function between them, and the calculation process is as follows:
In this paper, the number of parameters is 21.3M and the computational cost is 3.2G.
4.2. Performance Evaluation on the Overall Datasets
In this paper, “accuracy" refers to the ability of an objective evaluation algorithm to predict subjective perceptions. Specifically, it is quantified as follows: PLCC (high) indicates accurate prediction (accuracy), and SROCC (high) indicates correct ranking (monotonicity).
To evaluate the prediction accuracy of our model, eleven representative IQA methods were selected for experimental comparison, including the manual feature extraction-based methods 5,6,18, the deep learning-based synthetic distortion IQA methods 7,8,19, and the deep learning-based authentic distortion IQA methods 3,4,9,10,11. The reported results are listed in Table 1.
| SROCC | PLCC | |||||||||
| LIVEC | KonIQ-10k | CSIQ | LIVE | Average | LIVEC | KonIQ-10k | CSIQ | LIVE | Average | |
| BRISQUE 5 | 0.605 | 0.483 | 0.751 | 0.938 | 0.694 | 0.617 | 0.543 | 0.829 | 0.941 | 0.733 |
| ILNIQE 18 | 0.589 | 0.511 | 0.898 | 0.812 | 0.703 | 0.586 | 0.531 | 0.808 | 0.865 | 0.698 |
| HOSA 6 | 0.650 | 0.684 | 0.761 | 0.947 | 0.761 | 0.678 | 0.716 | 0.834 | 0.947 | 0.794 |
| BIECON 7 | 0.608 | 0.534 | 0.819 | 0.961 | 0.731 | 0.609 | 0.567 | 0.823 | 0.964 | 0.741 |
| WaDIQaM 19 | 0.671 | 0.739 | 0.955 | 0.954 | 0.830 | 0.680 | 0.760 | \(\mathbf{0.973}\) | 0.963 | 0.844 |
| CaHDC 8 | 0.734 | 0.819 | 0.903 | 0.965 | 0.855 | 0.738 | 0.834 | 0.914 | 0.964 | 0.863 |
| SFA 4 | 0.819 | 0.815 | 0.796 | 0.890 | 0.830 | 0.834 | 0.840 | 0.820 | 0.895 | 0.847 |
| DBCNN 9 | 0.851 | 0.875 | 0.956 | 0.968 | 0.913 | 0.869 | 0.882 | 0.959 | 0.971 | 0.920 |
| HyperIQA 3 | 0.859 | 0.906 | 0.923 | 0.962 | 0.913 | 0.882 | 0.917 | 0.942 | 0.966 | 0.927 |
| MetaIQ 10 | 0.802 | 0.850 | – | – | 0.826 | 0.835 | 0.877 | – | – | 0.856 |
| MetaIQA+ 11 | 0.852 | 0.909 | – | – | 0.881 | 0.852 | 0.909 | – | – | 0.881 |
| Ours | \(\mathbf{0.884}\) | \(\mathbf{0.917}\) | \(\mathbf{0.965}\) | \(\mathbf{0.975}\) | \(\mathbf{0.935}\) | \(\mathbf{0.895}\) | \(\mathbf{0.930}\) | 0.967 | \(\mathbf{0.974}\) | \(\mathbf{0.942}\) |
As can be seen from the data in Table 1, the best results are highlighted in bold, our proposed method achieves SROCC results of 0.884, 0.917, 0.965, 0.975 and PLCC results of 0.895, 0.930, 0.967, 0.974 on the datasets LIVEC, Koniq-10k, CSIQ, and LIVE, respectively. Meanwhile, our method achieves optimal prediction accuracy for all except the CSIQ dataset, and also achieves suboptimal prediction accuracy on CSIQ after DBCNN. For the average prediction results of the four datasets, our method improves 2.41% for SROCC and 2.39% for PLCC, respectively, over the DBCNN method.
Next, we discuss the experimental results in the following three aspects.
First, the prediction accuracy of our model is better than such methods on most of the datasets compared to the three hand-extracted feature-based methods. The experimental results show that our model can learn more information than the hand-extracted feature-based methods.
Second, our model achieves optimal results for SROCC on all four datasets compared to the synthetic IQA models based on deep learning. In contrast, our method also shows greater potential and excellent prediction accuracy on synthetic datasets, with PLCC results on CSIQ second only to the WaDIQaM method. Our method outperforms the SROCC results of WaDIQaM by about 1.05% on CSIQ and by about 2.20% on LIVE. For the PLCC results, our method outperforms WaDIQaM-NR by about 1.14% on LIVE.
Finally, our model achieves optimal prediction results for both synthetic and authentic distortion compared to the authentic IQA method based on deep learning. Compared with the method SFA, which extracts deep semantic features using convolutional networks, our model achieves significantly better results on KonIQ-10k and LIVEC. Compared with the HyperIQA method for the same content perception, it is verified that the proposed attention mechanism could further refine the features to match the perceptual properties of the human eye. Our method outperforms its SROCC by about 2.91% and PLCC by 1.47% on LIVEC, SROCC by about 1.21% and PLCC by 1.41% on Koniq-10k, SROCC by about 4.55% and PLCC by 2.65% on CSIQ, SROCC by about 1.35% and PLCC by 0.83% on LIVE, and 0.83% PLCC on LIVE.
Overall, the proposed method achieves comprehensive optimal prediction accuracy thanks to three aspects:
-
(1)
The pre-trained meta-model on the synthetic dataset is able to learn more distortion-related knowledge and adapt well to untrained distortions.
-
(2)
The proposed local feature extraction module incorporates the attention mechanism into multi-level features.
-
(3)
The deep semantic features refined by the attention mechanism achieve content-aware distorted image quality prediction.
4.3. Performance Evaluation on Single Distortion Datasets
To verify the prediction accuracy of the proposed method for different distortion types, experiments are conducted in this section on synthetic distortion datasets LIVE and CSIQ. To carry out the experimental procedure, the models of all methods are trained using all the distortion types and tested on the specific distortion types.
Table 2 presents the SROCC results of each method on the LIVE and CSIQ datasets. It can be seen from the left of Table 2, our method achieves the highest prediction accuracy on JP2K, WN, GB, and FF four distortion types, achieving SROCC results of 0.965, 0.988, 0.978, and 0.957, respectively. The prediction results for JPEG distortion type are second only to DBCNN.
| LIVE | CSIQ | ||||||||||
| JPEG | JP2K | WN | GB | FF | JPEG | JP2K | WN | GB | PN | CC | |
| BRISQUE 5 | 0.965 | 0.929 | 0.982 | 0.964 | 0.828 | 0.806 | 0.840 | 0.723 | 0.820 | 0.378 | 0.804 |
| ILNIQE 18 | 0.941 | 0.894 | 0.981 | 0.915 | 0.833 | 0.899 | 0.906 | 0.850 | 0.858 | 0.874 | 0.501 |
| HOSA 6 | 0.954 | 0.935 | 0.975 | 0.954 | 0.954 | 0.733 | 0.818 | 0.604 | 0.841 | 0.500 | 0.716 |
| WaDIQaM 19 | 0.953 | 0.942 | 0.982 | 0.938 | 0.923 | 0.853 | 0.947 | \(\mathbf{0.974}\) | \(\mathbf{0.979}\) | 0.882 | 0.923 |
| CaHDC 8 | 0.963 | 0.948 | 0.977 | 0.953 | 0.907 | 0.908 | 0.931 | 0.906 | 0.923 | 0.881 | 0.872 |
| DBCNN 9 | \(\mathbf{0.972}\) | 0.955 | 0.980 | 0.935 | 0.930 | 0.940 | 0.953 | 0.948 | 0.947 | 0.940 | 0.870 |
| HyperIQA 3 | 0.961 | 0.949 | 0.982 | 0.926 | 0.934 | 0.934 | 0.960 | 0.927 | 0.915 | 0.931 | 0.874 |
| Ours | 0.969 | \(\mathbf{0.965}\) | \(\mathbf{0.988}\) | \(\mathbf{0.978}\) | \(\mathbf{0.957}\) | \(\mathbf{0.980}\) | \(\mathbf{0.973}\) | 0.966 | 0.954 | \(\mathbf{0.969}\) | \(\mathbf{0.950}\) |
It can be clearly noticed from the left of Table 2, our method obtains the best results on JPEG, JP2K, PN, and CC. Specifically, our model outperforms WaDIQaM on JPEG by about 14.89%, JP2K by about 2.75%, PN by about 9.86%, and CC by about 2.93%.
In general, our method outperforms other methods in 8 out of 11 distortion types, mainly because the image content information combined with the attention mechanism is more helpful for learning the perceptual quality, while the meta-learning further improves the generalization performance of the model for various distortion types.
4.4. Ablation Studies
In this section, ablation studies are conducted to verify the effectiveness of each key component of the proposed method. In this paper, the LIVE and LIVEC datasets are selected for the ablation experiments, and the experimental results are presented in Table 3. We use the pre-trained ResNet50 as the baseline model and analyze the impact of each component by SROCC and PLCC metrics. First, Meta, a meta-training component, is added to the baseline model so that the model acquires prior knowledge of distortion trained on synthetic distortion datasets, which to some extent compensates for the pre-trained classification network’s insensitivity to image distortion. Secondly, a meta-testing part is added to the baseline model to extract multi-level features and the image content perception process MTContent, so that the model acquires content perception rules. Then, the attention mechanism PSA is added on top of it to simulate the attention distribution of human eyes when observing images. Finally, the final results are obtained by combining all modules through a meta-learning framework. As can be seen in Table 3, the SROCC and PLCC metrics show a large improvement on the two datasets, which proves the effectiveness of our proposed model.
| Methods | LIVE | LIVEC | |||
| SROCC | PLCC | SROCC | PLCC | ||
| ResNet50 | 0.929 | 0.928 | 0.825 | 0.851 | |
| ResNet50+Meta | 0.969 | 0.968 | 0.838 | 0.854 | |
| ResNet50+MTContent | 0.962 | 0.966 | 0.859 | 0.882 | |
| ResNet50+MTContent+PSA | 0.967 | 0.969 | 0.868 | 0.892 | |
| Ours | \(\mathbf{0.975}\) | \(\mathbf{0.974}\) | \(\mathbf{0.884}\) | \(\mathbf{0.895}\) | |
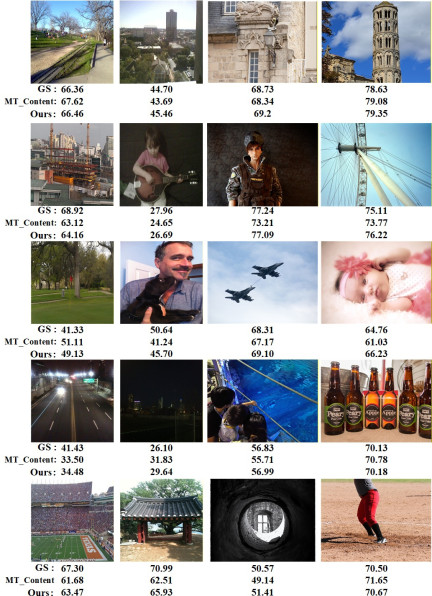
Fig. 4. Prediction accuracy.
Taking the images in the LIVEC and KonIQ datasets as examples, the subjective quality scores of the 20 distorted images and the corresponding quality scores predicted by our model are given in this paper. As presented in Fig. 4, the first row is the subjective quality score, the second row is the predicted score with the MTContent module added, and the third row is the predicted score of our model. It can be seen that the multi-level features in the added MTContent module mimic the information generated by the human eye in evaluating an image, and the combination of deep semantic information can eliminate to a certain extent the impact of image content changes and local distortion on quality prediction, and retain more detailed features that are more sensitive to human eye vision, thus achieving reliable prediction results. In addition, after adding the meta-learning process and attention mechanism, the predicted values of our model for most distorted images are basically consistent with the subjective quality scores, which further validates the robustness of the model in this paper to different distortions and the accuracy of predicting image quality.
5. Conclusion
In this work, we propose an attention mechanism-guided content-aware NR-IQA method, which explores the dependencies between different regions as well as different channel features from the process of perceiving image quality in the HVS, and simulates selective spatial attention and contrast sensitivity in IQA. Facing the huge image content variation of existing distorted images, the impact of local distortion is addressed by extracting multi-level semantic features of fused attention mechanism to refine deep semantic information. For the problem of distortion complexity, a pre-trained metamodel is used to learn rich prior knowledge for quickly adapting to various distortion types and effectively extracting perceptually sensitive features. Finally, adaptive prediction of image quality is achieved based on the extracted content features, which further improves the prediction accuracy of the overall model. The presented experimental results on publicly available datasets show that our average SROCC and PLCC values are superior to both the overall dataset and the single distortion dataset, verifying that the proposed model can achieve satisfactory results in terms of prediction accuracy as well as generalizability.
This paper demonstrated the effectiveness of attention mechanism-guided content-aware method in solving IQA problems. However, in many scenarios, such as medical images and fingerprint images, the collection of images and the assessment of quality scores remain limited. Future work will consider combining metric-based meta-learning methods.
Acknowledgments
This work was supported by the Open Research Funds of the Shanxi Province Key Laboratory of Ophthalmology (Grant No.202104010910013), and the National Natural Science Foundation of China (Grant No.61603357).
- [1] L. Zhou, C. Liu, A. Yadav, S. Azam, and A. Karim, “An image quality assessment method based on edge extraction and singular value for blurriness,” Machine Vision and Applications, Vol.35, No.3, Article No.37, 2024. https://doi.org/10.1007/s00138-024-01522-6
- [2] J. Ryu, “A visual saliency-based neural network architecture for no-reference image quality assessment,” Applied Sciences, Vol.12, No.19, Article No.9567, 2022. https://doi.org/10.3390/app12199567
- [3] S. Su, Q. Yan, Y. Zhu, C. Zhang, X. Ge, J. Sun, and Y. Zhang, “Blindly assess image quality in the wild guided by a self-adaptive hyper network,” 2020 IEEE/CVF Conf. on Computer Vision and Pattern Recognition (CVPR), pp. 3664-3673, 2020. https://doi.org/10.1109/cvpr42600.2020.00372
- [4] D. Li, T. Jiang, W. Lin, and M. Jiang, “Which has better visual quality: The clear blue sky or a blurry animal?,” IEEE Trans. on Multimedia, Vol.21, No.5, pp. 1221-1234, 2019. https://doi.org/10.1109/tmm.2018.2875354
- [5] A. Mittal, A. K. Moorthy, and A. C. Bovik, “No-reference image quality assessment in the spatial domain,” IEEE Trans. on Image Processing, Vol.21, No.12, pp. 4695-4708, 2012. https://doi.org/10.1109/tip.2012.2214050
- [6] J. Xu, P. Ye, Q. Li, H. Du, Y. Liu, and D. Doermann, “Blind image quality assessment based on high order statistics aggregation,” IEEE Trans. on Image Processing, Vol.25, No.9, pp. 4444-4457, 2016. https://doi.org/10.1109/tip.2016.2585880
- [7] J. Kim and S. Lee, “Fully deep blind image quality predictor,” IEEE J. of Selected Topics in Signal Processing, Vol.11, No.1, pp. 206-220, 2017. https://doi.org/10.1109/jstsp.2016.2639328
- [8] J. Wu, J. Ma, F. Liang, W. Dong, G. Shi, and W. Lin, “End-to-end blind image quality prediction with cascaded deep neural network,” IEEE Trans. on Image Processing, Vol.29, pp. 7414-7426, 2020. https://doi.org/10.1109/tip.2020.3002478
- [9] W. Zhang, K. Ma, J. Yan, D. Deng, and Z. Wang, “Blind image quality assessment using a deep bilinear convolutional neural network,” IEEE Trans. on Circuits and Systems for Video Technology, Vol.30, No.1, pp. 36-47, 2020. https://doi.org/10.1109/tcsvt.2018.2886771
- [10] H. Zhu, L. Li, J. Wu, W. Dong, and G. Shi, “MetaIQA: Deep meta-learning for no-reference image quality assessment,” 2020 IEEE/CVF Conf. on Computer Vision and Pattern Recognition (CVPR), pp. 14131-14140, 2020. https://doi.org/10.1109/cvpr42600.2020.01415
- [11] H. Zhu, L. Li, J. Wu, W. Dong, and G. Shi, “Generalizable no-reference image quality assessment via deep meta-learning,” IEEE Trans. on Circuits and Systems for Video Technology, Vol.32, No.3, pp. 1048-1060, 2022. https://doi.org/10.1109/tcsvt.2021.3073410
- [12] N. Ponomarenko, L. Jin, O. Ieremeiev, V. Lukin, K. Egiazarian, J. Astola, B. Vozel, K. Chehdi, M. Carli, F. Battisti, and C.-C. J. Kuo, “Image database tid2013: Peculiarities, results and perspectives,” Signal Processing: Image Communication, Vol.30, pp. 57-77, 2015. https://doi.org/10.1016/j.image.2014.10.009
- [13] H. Lin, V. Hosu, and D. Saupe, “KADID-10k: A large-scale artificially distorted iqa database,” 2019 Eleventh Int. Conf. on Quality of Multimedia Experience (QoMEX), 2019. https://doi.org/10.1109/qomex.2019.8743252
- [14] H. Sheikh, M. Sabir, and A. Bovik, “A statistical evaluation of recent full reference image quality assessment algorithms,” IEEE Trans. on Image Processing, Vol.15, No.11, pp. 3440-3451, 2006. https://doi.org/10.1109/tip.2006.881959
- [15] D. M. Chandler, “Most apparent distortion: Full-reference image quality assessment and the role of strategy,” J. of Electronic Imaging, Vol.19, No.1, Article No.011006, 2010. https://doi.org/10.1117/1.3267105
- [16] D. Ghadiyaram and A. C. Bovik, “Massive online crowdsourced study of subjective and objective picture quality,” IEEE Trans. on Image Processing, Vol.25, No.1, pp. 372-387, 2016. https://doi.org/10.1109/tip.2015.2500021
- [17] V. Hosu, H. Lin, T. Sziranyi, and D. Saupe, “KonIQ-10k: An ecologically valid database for deep learning of blind image quality assessment,” IEEE Trans. on Image Processing, Vol.29, pp. 4041-4056, 2020. https://doi.org/10.1109/tip.2020.2967829
- [18] L. Zhang, L. Zhang, and A. C. Bovik, “A feature-enriched completely blind image quality evaluator,” IEEE Trans. on Image Processing, Vol.24, No.8, pp. 2579-2591, 2015. https://doi.org/10.1109/tip.2015.2426416
- [19] S. Bosse, D. Maniry, K.-R. Muller, T. Wiegand, and W. Samek, “Deep neural networks for no-reference and full-reference image quality assessment,” IEEE Trans. on Image Processing, Vol.27, No.1, pp. 206-219, 2018. https://doi.org/10.1109/tip.2017.2760518
This article is published under a Creative Commons Attribution-NoDerivatives 4.0 Internationa License.