
Research Paper:
Assessing Effects of RCEP Implementation on China’s Intra-Regional Trade: An Analysis from Both Aggregate and Structural Perspectives
Qi Xiong*, Wenhui Zhang**,†, and Jingyi Yang**

*Research Center for Quantitative Economics, Huaqiao University
No.668 Jimei Avenue, Jimei District, Xiamen 361021, China
**Institute for Quantitative Economics and Statistics, Huaqiao University
No.668 Jimei Avenue, Jimei District, Xiamen 361021, China
†Corresponding author

This study examines the impact of the Regional Comprehensive Economic Partnership (RCEP) on China’s intra-regional trade using the synthetic control method. By combining aggregate trade analysis with structural decomposition, we find that RCEP implementation has significantly strengthened China’s trade integration with member economies, with heterogeneous effects across trade margins. These findings suggest that regional trade agreements can promote trade expansion not only through volume growth but also through structural adjustment, offering policy-relevant insights for regional economic integration.
1. Introduction
Since its official signing in 2020, the Regional Comprehensive Economic Partnership (RCEP) has significantly impacted Asian trade and economic cooperation. RCEP comprises ten member states of the Association of Southeast Asian Nations (ASEAN): Brunei, Cambodia, Indonesia, Laos, Malaysia, Myanmar, the Philippines, Singapore, Thailand, and Vietnam, and their five free trade agreement partners: Australia, China, Japan, New Zealand, and South Korea. RCEP has the potential to promote trade integration in East Asia and the Asia-Pacific region, foster regional and global cooperation, and contribute to global economic development. Considering the unpredictability of US trade policies, efforts to enhance deeper integration within Asia have gained increasing political support. From an economic perspective, a large regional agreement like RCEP is expected to harmonize and streamline the rules within dispersed agreements, thereby mitigating the well-known “noodle bowl” effect 1. As a major regional initiative in Asia, RCEP aims to integrate and simplify regional agreement networks. As regional economic integration accelerates, research on RCEP has become a focal point in academic circles. Early studies primarily focused on assessing the potential impact of RCEP on economic growth, trade flows, investment, and employment among member countries. With the official implementation of RCEP, an increasing number of studies have examined its actual impacts and mechanisms.
These studies found that reductions in tariffs and nontariff barriers significantly enhance trade fluidity among member countries 2,3,4. However, some scholars have warned that RCEP could lead to excessive dependence on foreign trade, thereby increasing the risk for member countries 5. Additionally, the dynamic effects of regional economic cooperation and restructuring are key areas of research. RCEP has been shown to significantly improve the economic welfare of member countries within the region by creating trade opportunities and increasing production efficiency 6. Moreover, the specific terms of RCEP have a notable impact on trade and investment among member countries, and the design of these terms significantly influences trade flows 7,8. Further studies indicate that RCEP contributes to deepening production networks and supply chain integration within the region, thereby enhancing the economic competitiveness of member countries 9. Additionally, the implementation of RCEP will promote the deepening of regional production networks and help elevate positions of member countries in global value chains 10. In empirical research, early literature often employed the gravity model to evaluate the impact of RCEP on trade flows. Studies suggest that RCEP is expected to significantly increase bilateral trade volumes between member countries 11. Other research supports this view, indicating that regional trade agreements significantly enhance trade flows between member countries 12. An input–output analysis shows that RCEP helps optimize the allocation of regional industrial chains, improving production efficiency and economic welfare 13. Quantitative analysis of agreement texts has also begun to show its unique value in assessing the impact of RCEP 14. The synthetic control method (SCM), an effective quasi-experimental design method, has been increasingly applied in recent years to evaluate the impacts of policies and interventions. This method has proven effective in policy evaluation by constructing a more precise control group 15,16. While prior SCM-based studies convincingly demonstrate the effectiveness of this method for evaluating aggregate trade policy effects 17,18,19, this study advances the approach along several dimensions. Specifically, we employ monthly data to enable higher-frequency dynamic analysis, extend SCM to product-level decompositions to capture heterogeneous and compositional effects, and implement multiple robustness and placebo tests to strengthen causal inference. In addition, we embed SCM estimates within a structural framework that distinguishes between extensive and intensive margins, thereby enhancing interpretability and external validity. Collectively, these extensions represent a methodological upgrade to existing studies that assess the trade effects of RCEP.
It is noteworthy that although RCEP is centered on ASEAN, it emphasizes China’s leadership role. The impact of RCEP on China and its potential opportunities have received widespread attention from scholars. Studies indicate that signing RCEP has a positive effect on China’s exports and overall income and will stimulate the economy of most Chinese provinces, especially coastal regions 20,21. In the field of foreign investment, Karahan and Çolak 22 constructed a model of foreign direct investment (FDI) flows and concluded that the signing of RCEP will increase FDI inflows into China, particularly from ASEAN countries.
In summary, although existing research has extensively explored the multidimensional impacts of RCEP from both theoretical and empirical perspectives, most studies focus on the overall trade volume effects, often using annual data for analysis. There is a lack of research specifically targeting the impact of segmented product categories of a single country on exports, especially studies that employ the SCM method for post-event examination. Regarding country-specific research, given the significant impact of RCEP on member countries, especially China, a comprehensive and in-depth study of its effects on trade and welfare is necessary. However, several unexplored issues remain in the research on the relationship between RCEP and China, with some studies still at the qualitative analysis stage. Therefore, this study comprehensively examines the impact of RCEP on China’s economic and industrial structures. Specifically, this study uses the SCM method to study the impact of the implementation of RCEP on import and export trade flows between China and RCEP member countries. This research will extend to different product sectors in China, providing new evidence for understanding the comprehensive impact of RCEP on a single country. Compared to current research in this field, the main contributions of this study can be summarized as follows:
-
a)
Data Granularity: This study uses monthly data from 2015 to 2024, which better reflect dynamic changes in export trade than annual data.
-
b)
Segmented Product Classification: This study not only focuses on manufacturing products but also covers all product categories in the three major industrial sectors, providing a more comprehensive analysis of the trade structure.
-
c)
Methodological Improvements: Based on the regression synthesis method, this study introduced a placebo test, enhancing the robustness of the results through pseudo-intervention and pseudo-intervention time tests.
-
d)
Intra- and Inter-Regional Comparison: This study uses 30 countries/regions outside RCEP as a control group to construct a more comprehensive comparative framework, which helps in identifying the true effects of RCEP more clearly.
2. Materials and Methods
2.1. Overview of the SCM
SCM is a powerful statistical technique used for causal inference in situations where traditional randomized control trials are infeasible. It is widely used in policy evaluation, economic studies, and environmental assessments. This allows researchers to assess the impact of policy changes, economic shifts, and environmental interventions in settings where experimental designs are impractical. It constructs a counterfactual outcome for the treated unit by optimally weighting a set of control units such that the weighted combination closely matches the preintervention characteristics of the treated unit. Formally, SCM determines a vector of nonnegative weights that minimizes the distance between the treated unit and its synthetic counterpart in terms of pretreatment outcomes and relevant predictors. This data-driven weighting scheme reduces subjectivity in control selection and is particularly suitable for policy evaluation with a single treated unit and a limited number of comparable controls. In this study, SCM enables us to estimate the counterfactual path of China’s intra-regional trade in the absence of RCEP implementation. The key identifying assumption of SCM is that, without policy intervention, the treated unit would continue to follow the same trajectory as its synthetic counterpart constructed from the donor pool. This study’s application of SCM provides a rigorous analysis of the impact of RCEP on China’s trade dynamics, offering insights into the benefits of regional trade agreements and contributing valuable empirical evidence for policymakers. The findings emphasize the role of RCEP in enhancing China’s export capabilities while highlighting the complexities of its impact on imports and providing a comprehensive understanding of the implications of trade agreements.
2.2. Data Sources and Description
Using data on the total import and export trade volumes between China and other countries or regions from the CEIC Global Economic Database, we aggregated the monthly import and export trade volumes between China and other countries or regions from January 2015 to May 2024. All trade values used in this study were measured in nominal terms and expressed in US dollars, consistent with the original data source. Nominal trade values were used in the baseline analysis to remain consistent with official trade statistics and existing SCM-based trade studies. Robustness checks using the deflated values yielded similar results. Countries or regions were then ranked from largest to smallest in terms of trade volume, and the top 30 countries and regions for both exports and imports were selected as the control group for this study. The selection of the top 30 trading partners was guided by two considerations. First, these partners account for more than 85% of China’s total external trade over the pretreatment period, ensuring sufficient representativeness of China’s major trade relationships. Second, SCM requires a reasonably large donor pool to construct a synthetic counterpart with a good pretreatment fit; using fewer countries may compromise matching quality, while including substantially more countries may introduce noise from marginal trade relationships. It is important to note that in the specific regressions, the effects of the implementation of RCEP on external market demand and China’s economic driving force were examined separately for exports and imports. Therefore, the countries or regions included in the export and import control groups may differ.
3. Identifying Aggregate Changes Due to RCEP Implementation
3.1. Baseline Regression
3.1.1. Exports
The export trade volume was estimated using SCM, with the intervention group comprising RCEP countries, excluding China (abbreviated as RCEP-14). The control group included the top 30 countries and regions in terms of China’s export trade volume, ranked from largest to smallest as follows: the United States, Hong Kong Special Administrative Region of China, Germany, India, the Netherlands, the United Kingdom, the Russian Federation, Taiwan of China, Mexico, Brazil, the United Arab Emirates, Canada, Italy, France, Spain, Saudi Arabia, Poland, Türkiye, Belgium, Bangladesh, Pakistan, South Africa, Chile, Nigeria, Kazakhstan, Egypt, the Czech Republic, Iran, Israel, and Iraq.
As shown in Fig. 1, before the official implementation of RCEP in January 2022, the trend in the actual export trade volume closely followed that of the synthetic values, with the two curves almost completely overlapping. The eff values fluctuated around zero (Fig. 2), indicating that the counterfactual outcomes generated by the SCM were effective. Therefore, the difference in trade volume between actual and synthetic exports to RCEP-14 countries after the intervention can be attributed to the effects of RCEP implementation.
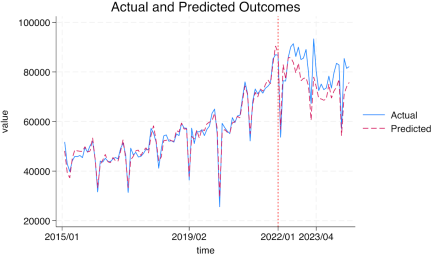
Source: Original data are from CEIC, and the results were calculated by the author using Stata 18.
Fig. 1. Comparison of China’s actual exports to RCEP-14 and counterfactual exports.
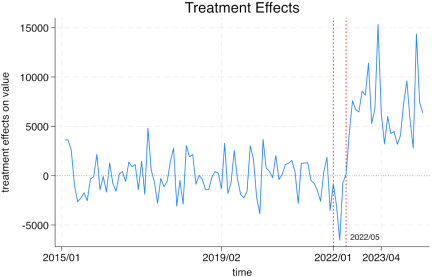
Source: Original data from CEIC; results calculated by the author using Stata 18. Note: The eff curve represents the treatment effect, which is calculated as the difference between the actual and predicted values in Fig. 1. The intervention group consisted of RCEP-14 countries, whereas the control group comprised the top 30 countries/regions in terms of China’s export trade volume, as selected earlier. Intervention refers to the implementation of RCEP. An eff value above zero indicates a positive effect of the intervention; otherwise, it indicates a negative effect.
Fig. 2. Treatment effects on China’s exports to RCEP-14.
After RCEP came into effect, the trends began to diverge, with actual and synthetic export trade volumes showing a clear separation. Specifically, from the implementation of RCEP from January 2022 to May 2022, the eff value was negative, indicating a negative gap between actual and synthetic export trade volumes. During this time, China’s actual export trade volume to RCEP-14 countries was low. This may be attributed to Shanghai—one of China’s most significant ports of entry and exit—implementing static management and other pandemic control measures from March to May 2022 owing to COVID-19, significantly impacting China’s import and export trade. However, after June 1, 2022, when Shanghai fully resumed work, production, and normal economic activities, the eff curve began to rise significantly above the zero line, indicating a positive and widening gap between actual and synthetic export trade volumes. This suggests that RCEP’s implementation has boosted China’s exports to RCEP-14 countries, with the effect growing over time (Fig. 2).
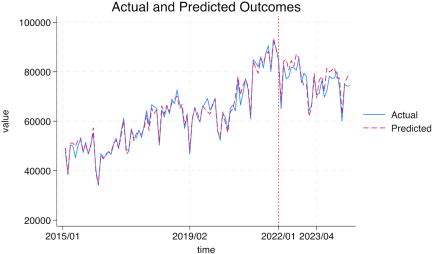
Source: Original data from CEIC; results calculated by the author using Stata 18.
Fig. 3. Comparison of China’s actual imports from RCEP-14 and counterfactual imports.
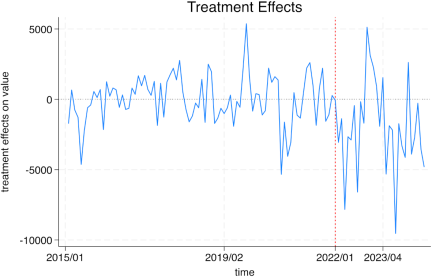
Source: Original data from CEIC; results calculated by the author using Stata 18.
Fig. 4. Treatment effects on China’s imports from RCEP-14.
3.1.2. Imports
The import trade volume was estimated using SCM, with the intervention group comprising RCEP-14 countries. The control group includes the top 30 countries and regions in terms of China’s import trade volume, ranked from largest to smallest: Taiwan of China, the United States, Germany, Brazil, the Russian Federation, Saudi Arabia, Switzerland, France, Chile, Canada, South Africa, Iraq, Italy, the United Arab Emirates, Oman, the United Kingdom, Angola, India, Peru, Mexico, Kuwait, Ireland, the Netherlands, Iran, Qatar, Hong Kong Special Administrative Region of China, Kazakhstan, Spain, Sweden, and the Democratic Republic of the Congo.
As shown in Fig. 3, before January 2022, the trends in actual and synthetic import trade volumes were generally consistent, indicating a good model fit. However, after the implementation of RCEP, the trends began to diverge, with a separation between the actual and synthetic import trade volumes. The treatment effect was negative (Fig. 4), indicating that the actual import value was less than the synthetic import value and that the implementation of RCEP had a negative impact on the total import trade volume between China and RCEP-14 countries.
3.2. Placebo Test I: Pseudo-Intervention Countries
To assess the robustness of the baseline regression conclusions from Section 3.1, we employ a placebo test by altering the intervention group. Specifically, the top 30 countries/regions outside RCEP-14 in terms of trade volume were selected, and each was assumed to be an RCEP member. Subsequently, each was used as the intervention group, and SCM was applied to construct its corresponding counterfactual state. The trends of changes in import and export trade volumes after January 2022 are compared between the constructed intervention group and the actual trade volume to determine whether there is a significant divergence between the actual and synthetic values.
Because the countries or regions in this pseudo-intervention group are not actually part of RCEP, they should theoretically not be affected by RCEP implementation. Therefore, their actual and counterfactual trade volumes should not differ significantly after January 2022. If a significant difference is observed, it could suggest that the baseline regression conclusions in Section 3.1 are not robust and may be due to unobserved or unobservable factors. When applying SCM, the synthetic trade volume is a convex combination of the trade volumes of the remaining control group countries or regions. This may lead to certain countries or regions with extreme values not being successfully synthesized or the synthetic effect being poor and unable to fit the trend of actual trade volume changes. In either case, the results obtained using SCM would become unreliable. Thus, this study only selected countries or regions with a prepolicy shock (RCEP implementation) that fit most similarly to RCEP-14, that is, those with a ratio of root mean square prediction error to that of RCEP-14 within 2.
Source: Original data from CEIC; results calculated by the author using Stata 18.
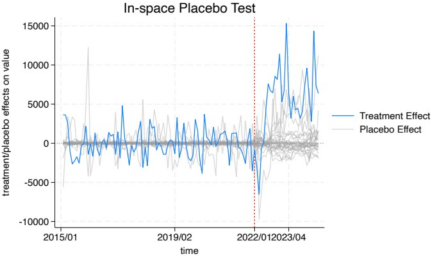
Fig. 5. Placebo test: error distribution in export trade volume fit.
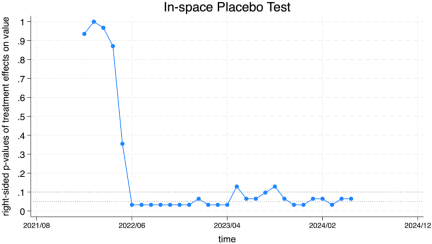
The blue line in Fig. 5 represents the treatment effect on China’s exports to RCEP-14, whereas the gray lines represent the placebo effect on China’s exports to other countries or regions. For countries or regions outside RCEP-14, the eff values fluctuate around zero, indicating a good fit for SCM. Moreover, after the implementation of RCEP, the positive treatment effect for RCEP-14 was the largest and was significantly higher than that of other countries or regions. According to the right-hand \(p\)-value test results, the p-values are not significant in the initial periods following RCEP implementation (Fig. 6), possibly due to the impact of the pandemic. However, from June 2022 onwards, the \(p\)-values for most periods become significant, suggesting that despite high monthly volatility, the baseline regression conclusions can be considered robust.
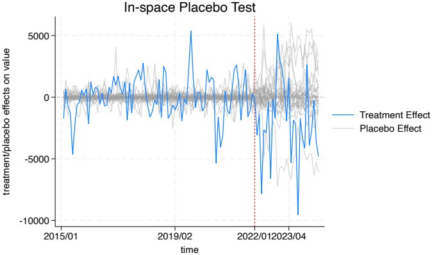
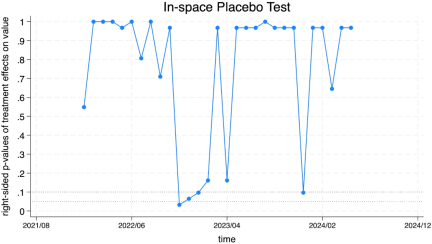
For import trade effects, Fig. 7 shows that for both RCEP-14 and countries or regions outside RCEP, the eff values hover around zero. Additionally, the right-hand \(p\)-value test results (Fig. 8) indicate that the baseline regression conclusions for import trade volumes lack robustness.
Source: Original data from CEIC; results calculated by the author using Stata 18.
Fig. 6. Placebo test for export trade effects: right-hand \(p\)-value test.
Source: Original data from CEIC; results calculated by the author using Stata 18.
Fig. 7. Placebo test: error distribution in import trade volume fit.
3.3. Placebo Test II: Pseudo-Intervention Timing
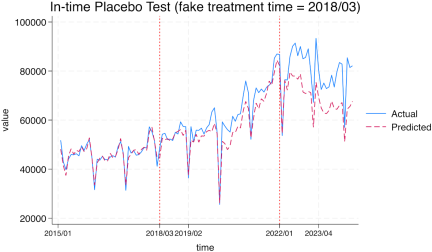
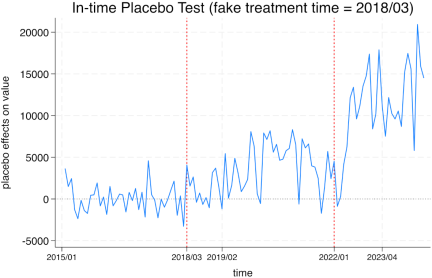
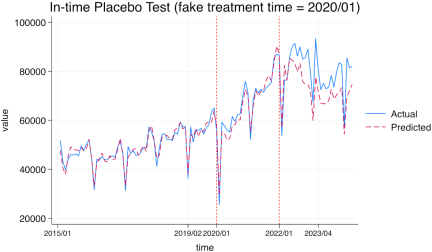
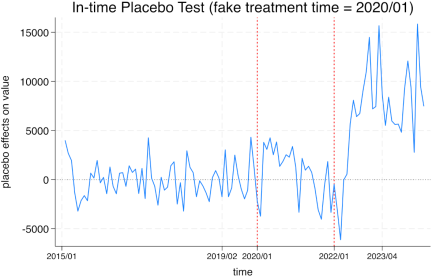
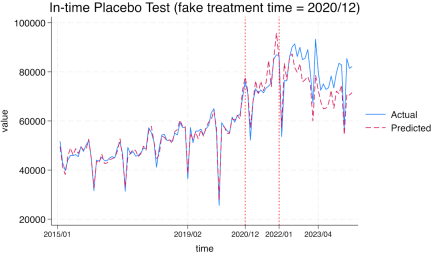
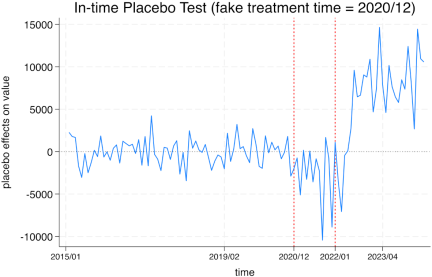
To ensure the robustness of the baseline regression conclusions, this section tests the reliability of the research results by altering the timing of policy implementation. Based on previous findings, the effect of RCEP implementation on China’s import trade volume with RCEP-14 was not significant; thus, this section focuses solely on its impact on export trade volume. By selecting a pseudo-policy shock period that precedes the actual policy implementation (i.e., RCEP coming into effect), if the synthetic export trade volume closely matches the actual values, this would indicate the robustness of our model’s results. The specific method involved validating several time points before RCEP took effect (three significant time points were selected: March 2018, during the escalation of the US–China trade friction; January 2020, at the onset of the COVID-19 pandemic; and December 2020, when RCEP was signed but not yet effective). SCM was applied to fit and estimate the time points. In these “false” years, the event of RCEP implementation did not occur, so theoretically, there should be no significant difference between the synthetic and actual export trade volumes of China to RCEP-14 (i.e., the eff values should fluctuate around zero). Otherwise, it may indicate the presence of other factors affecting China’s export trade with RCEP-14.
To improve readability, only key results are presented in the main text, and supplementary figures (especially the placebo tests) are reported in Appendix A. The three pseudo-intervention time points were March 2018, January 2020, and December 2020. During the period from these pseudo-times to the actual RCEP effect in January 2022, the fit between the synthetic and actual export trade volumes of China to RCEP-14 was quite good (Figs. 12–17 in Appendix A). A noticeable divergence occurred only after January 2022, confirming the robustness of the baseline regression conclusions for export trade volumes.
Source: Original data from CEIC; results calculated by the author using Stata 18.
Fig. 8. Placebo test for import trade effects: right-hand \(p\)-value test.
3.4. Exclusion of Intra-Regional Trade Frictions: Removal of Japan, South Korea, and Australia
Before 2017, there were frequent high-level visits between the Chinese and Australian governments. However, Australia’s opposition to China’s actions regarding the South China Sea disputes, human rights issues in Xinjiang, and concerns over China’s influence in Oceania through proxy agents and infrastructure projects have led to several legislative measures aimed at containment. As a result, the harmonious trade relationship between China and Australia began to deteriorate in 2020, influenced by fluctuations in diplomatic relations and geopolitical factors such as the US–Australia alliance. Similarly, the trade friction and industrial structure competition between China and Japan / South Korea have been significant. Japan and South Korea imposed high tariffs on agricultural products, with Japan imposing tariffs of 12.66% and 17.75% on food and vegetables, respectively, while South Korea imposed even higher tariffs of 14.40% and 112.36% on similar products. These protectionist policies have limited the market openings for agricultural products among China, Japan, and South Korea. Furthermore, as China rapidly develops in fields such as cultural entertainment and e-sports, Japan and South Korea face increasing competition in these industries. Geopolitical factors have also intensified trade tensions among China, Japan, and South Korea, with US strategic adjustments in the Asia-Pacific region significantly impacting economic and trade relations and increasing the complexity and uncertainty of intra-regional economic cooperation 23.
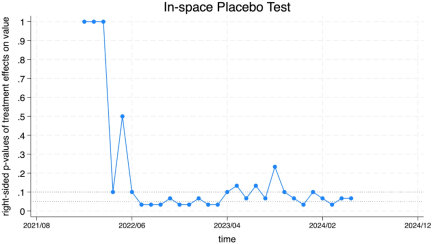
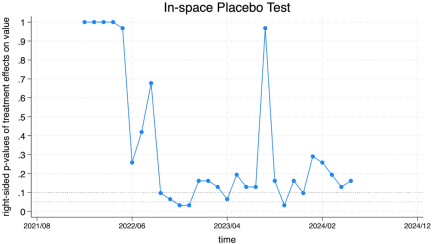
Considering these issues, this section examines the robustness of the results by excluding Japan, South Korea, and Australia, which experienced adverse impacts. This involved removing these three countries from the intervention group (RCEP-14), leaving RCEP-11 as the intervention group. According to the right-hand \(p\)-value test, the initial periods following RCEP implementation exhibit insignificant \(p\)-values, possibly due to the effects of the pandemic. However, most \(p\)-values become significant after June 2022 (Fig. 9), indicating that despite considerable monthly volatility, the baseline regression conclusions remain robust. In contrast, the \(p\)-value test for import trade volume reveals that the baseline regression conclusions are not robust, suggesting that RCEP implementation has not significantly impacted intra-regional import trade in China (Fig. 10).
Source: Original data from CEIC; results calculated by the author using Stata 18.
Fig. 9. Right-hand \(p\)-value test for exports after excluding Japan, South Korea, and Australia.
Source: Original data from CEIC; results calculated by the author using Stata 18.
Fig. 10. Right-hand \(p\)-value test for imports after excluding Japan, South Korea, and Australia.
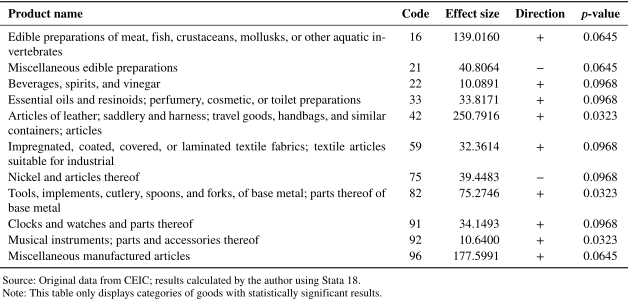
Table 1. Baseline regression results for exports of 98 international trade goods classified by HS2 code.
3.5. Summary
This section employs SCM to estimate both export and import trade volumes. The results from the baseline regressions and robustness analyses indicate that, while RCEP brings significant export benefits to China, its impact on imports is not substantial. Specifically, the implementation of RCEP significantly increased China’s exports to other member countries within the region. This finding suggests that RCEP effectively enhanced the competitiveness of Chinese goods in regional markets through measures such as reducing tariffs and nontariff barriers, simplifying customs procedures, and improving market access conditions. Broader regional economic integration has provided Chinese enterprises with more export opportunities, especially in high-value-added and technology-intensive industries. Additionally, the integration and optimization of supply chains within the region have further boosted the production efficiency and cost-effectiveness of Chinese exports.
Despite the notable performance of RCEP in promoting Chinese exports, its influence on imports remains insignificant. This phenomenon can be attributed to several reasons. First, the import substitution effect may have partially offset the impact of tariff reductions. Within the RCEP framework, Chinese companies have accelerated industrial upgrading and technological advancement by leveraging more convenient investment and technological cooperation opportunities in the region, achieving significant success in localized production, and reducing dependence on imported goods. Second, China’s import demand for certain key industries may not have changed significantly because of RCEP. Import demand in these industries may be influenced more by domestic economic policies, industrial structure adjustments, and global market dynamics than directly by regional trade agreements. Moreover, during the RCEP implementation period, adjustments to global supply chains and macroeconomic factors (such as fluctuations in the RMB exchange rate) may have had complex effects on China’s imports. Although regional economic integration offers more export opportunities to China, changes in domestic market demand, industrial policy adjustments, and global market uncertainties may be important factors that contribute to the lack of significant changes in imports.
4. Identifying Structural Changes Due to RCEP Implementation
4.1. Baseline Regression Based on HS2 Classification
4.1.1. Exports
SCM was applied to estimate the effects on exports for 98 categories of international trade goods classified by the HS2 code, with the effective date set to January 2022. The control group for export trade consisted of the top 30 countries/regions with which China had significant export trade, excluding RCEP member countries. The results are summarized in Table 1. The three categories of goods with the largest treatment effects are as follows:
-
a)
Articles of leather; saddlery and harness; travel goods, handbags, and similar containers; articles, with an effect size of 250.7916.
-
b)
Miscellaneous manufactured articles, with an effect size of 177.5991.
-
c)
Edible preparations of meat, fish, crustaceans, mollusks, or other aquatic invertebrates, with an effect size of 139.0160.
The effects for these three categories were all positive, and the baseline regression results were statistically significant at the 5%, 10%, and 10% levels, respectively.
For “articles of leather; saddlery and harness; travel goods, handbags, and similar containers; articles,” several factors contribute to the observed effects. First, these goods typically have high added value and brand influence. RCEP lowered tariffs and simplified customs procedures, facilitating easier market entry for these products within the region. Additionally, rising economic levels among RCEP member countries have led to increased consumer demand for high-quality leather products and travel goods. The rise of the middle class in the region has also driven the consumption of such items.
For “edible preparations of meat, fish, crustaceans, mollusks, or other aquatic invertebrates,” the diversity of these products allows them to meet various market demands flexibly. The implementation of RCEP has harmonized rules of origin and technical standards, reduced trade barriers, and promoted the circulation of miscellaneous goods, making it easier for them to enter member markets. China has a competitive edge in the production and design innovation of miscellaneous articles, and RCEP has provided more opportunities for technological cooperation and enhanced product competitiveness. Regarding “edible preparations of meat, fish, crustaceans, mollusks, or other aquatic invertebrates,” the demand for these items is driven by several factors. In many RCEP member countries, diets include significant quantities of meat and seafood. Consumption demand has increased along with economic growth and rising living standards, thus offering export opportunities for China. Furthermore, RCEP has fostered the integration of regional supply chains, allowing China to utilize raw materials more efficiently, lower production costs, and increase the international competitiveness of its products. China’s advantages in processing, cold-chain logistics, and other areas make its products particularly attractive to the meat and seafood sectors.
The negative effects observed for “miscellaneous edible preparations” and “nickel and articles thereof” following the implementation of RCEP may be attributed to a combination of technical barriers, market competition, and industrial policies. Specifically, differences in food safety and hygiene standards among RCEP member countries could present additional technical barriers to China’s export of miscellaneous food products. Additionally, competition among RCEP members has intensified under the RCEP framework, with Southeast Asian countries having strong localized production capabilities in miscellaneous food products. These countries offer more competitively priced alternatives, thereby exerting pressure on Chinese exports.
Nickel is an essential metal for industrial use, and its market price and demand are significantly influenced by global economic cycles. During the period when RCEP came into effect, there may have been a decline in global market demand or price fluctuations, thus impacting exports. Moreover, countries within the RCEP bloc such as Indonesia have natural advantages in nickel resource extraction and processing. As these countries enhanced their production capabilities, Chinese nickel products faced heightened competition. Although RCEP has promoted regional economic integration, it has also introduced market challenges and structural adjustment pressures for certain products, potentially leading to short-term negative impacts on exports.
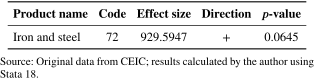
Table 2. Baseline regression results for imports of 98 international trade goods classified by HS2 code.
4.1.2. Imports
Similar to the export trade regression analysis, SCM was applied to estimate import trade using the HS2 classification for 98 categories of international trade goods. The effective date chosen for the analysis was January 2022, with the control group comprising the top 30 countries/regions (excluding RCEP members) with which China conducts import trade. Table 2 presents the product categories that exhibited significant results. The analysis reveals that only the category of “iron and steel” (HS2 classification code 72) demonstrates a significant treatment effect, with a value of 929.5947 in the positive direction.
This finding suggests that China has not yet utilized the RCEP region as a primary source of raw materials, and there is no evident trend of coordinated industrial progress within the region, particularly in ASEAN countries. From the perspective of supply chain security, China has consistently emphasized safety. Since the 18th National Congress of the Communist Party of China, Xi 24 has repeatedly highlighted the importance of ensuring the security and stability of industrial and supply chains, stating, “We must place greater emphasis on enhancing the resilience and competitiveness of the industrial chain, focusing on building an independent, controllable, safe, and efficient industrial and supply chain.” This approach aims to avoid overconcentration in a single region and mitigate the negative impacts of regional instability or policy shifts towards China, thereby diversifying import sources and spreading risk globally.
RCEP provides an opportunity to optimize the supply chain of the steel industry. In recent years, with the rapid development of sectors such as automobiles and high-end equipment manufacturing in China, there has been a steady import of medium-to-high-end products such as coated plates, cold-rolled sheets, hot-rolled sheets, electrical steel, and seamless steel pipes. Currently, among RCEP member countries, South Korea and Japan remain key sources of China’s steel imports. The RCEP agreement reduces the costs of importing high-end steel products from these countries and promotes the import of certain high-end steel products. Additionally, with the implementation of zero tariffs on most products in the RCEP region, manufacturing costs in member countries will decrease, benefiting from the import of Chinese electromechanical products and an indirect increase in steel imports.
It is noteworthy that, as seen in Section 4.1.1, RCEP has not significantly promoted Chinese steel exports to RCEP-14 countries. Li 25 offers a short- and long-term perspective; in the short term, RCEP’s implementation lowers the trade costs of steel and promotes exports to RCEP members through export tax rebate policies. However, in the long term, as RCEP countries, particularly ASEAN countries, increase their steel capacity and output, coupled with labor cost advantages, China’s steel competitiveness may weaken, making export growth less significant. Over time, as these countries develop their steel industries, the demand for Chinese steel may gradually diminish. Nevertheless, RCEP is not merely a trade agreement; it also facilitates regional technical exchange and cooperation. China can leverage technological exchanges with Japan and South Korea to import advanced equipment. Although this may create competitive pressure on certain high-end steel products in China in the short term, it will drive domestic steel industry upgrades in the long term. Thus, while RCEP may not significantly boost Chinese steel exports to RCEP members in the short term, it is expected to enhance the competitiveness of China’s steel industry in the long term through technological advancements. Overall, the impact of RCEP on China’s regional steel exports results from a combination of factors, and its positive effects may weaken, leading to insignificant growth.
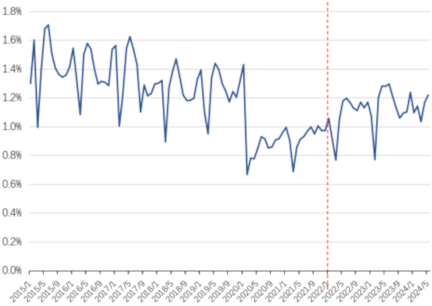
Source: Original data from CEIC.
Fig. 11. Trend of China’s typical export categories as a proportion of total export trade.
4.2. Placebo Test for Typical Export Categories
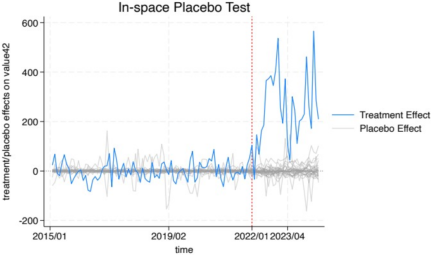
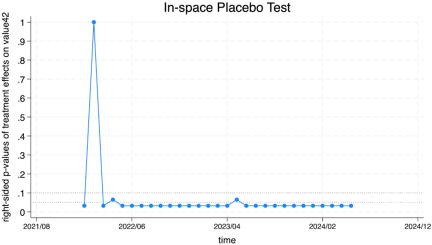
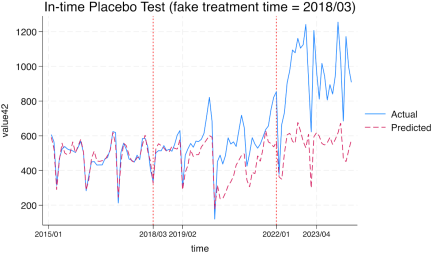
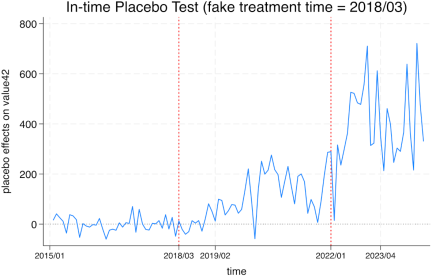
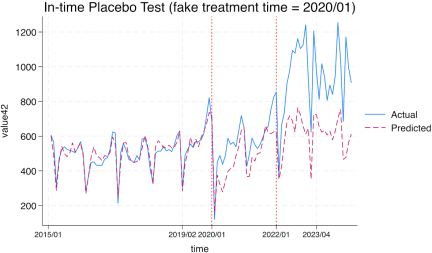
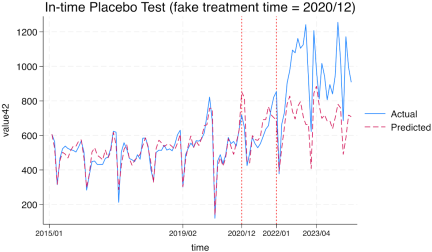
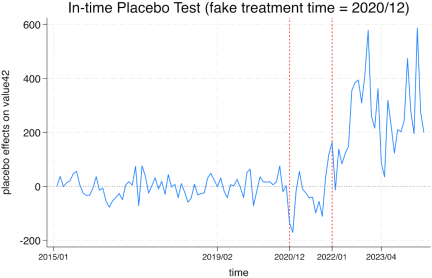
Based on the results from Table 1, the category with the most significant effect was selected for a case study of typical export categories, specifically the HS2 classification code 42: “articles of leather; saddlery and harness; travel goods, handbags, and similar containers; articles.” First, a placebo test was conducted by altering the intervention group based on the same assumptions as in Section 3.2. A series of placebo tests confirmed that the baseline regression results are robust (Figs. 18 and 19 in Appendix A). Next, the reliability of the research results was further validated by changing the policy implementation date, consistent with the assumption in Section 3.3 (Figs. 20–25 in Appendix A), confirming that the baseline regression results are robust. It is noteworthy that some discrepancies exist between the actual and synthetic trade volumes of typical export categories under the impact of the US–China trade frictions and the COVID-19 outbreak. However, these discrepancies are negligible compared with the difference after RCEP officially came into effect in January 2022. Furthermore, this study uses monthly data, which theoretically exhibit greater volatility than annual data. Therefore, we can consider robustness approximate, as confirmed by the tests.
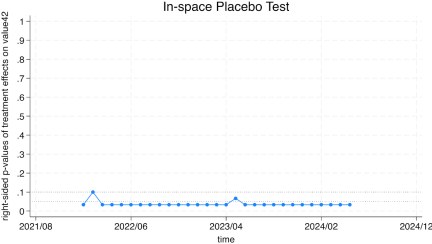
Finally, by removing the three countries (Japan, South Korea, and Australia) that exert a reverse impact, we tested the robustness of the results following the assumption in Section 3.4 (Fig. 26 in Appendix A), and the baseline regression results remain robust.
Figure 11 indicates that after RCEP took effect, the regional export volume of HS2 classification code 42, “articles of leather; saddlery and harness; travel goods, handbags and similar containers; articles,” exhibited a steady upward trend. This indicates an increase in demand for these goods in the RCEP regional market. This increase in demand may prompt related enterprises to extend their industrial chains by adding production stages or expanding upstream and downstream to meet the market demand. Through these mechanisms, trade trends of goods can significantly affect the extension and upgrading of industrial chains, thereby affecting the economic development of countries and regions. For example, an increase in China’s leather goods exports may encourage domestic industries to expand across multiple stages from raw material procurement to design, manufacturing, and brand management.
4.3. Placebo Test for Typical Import Categories
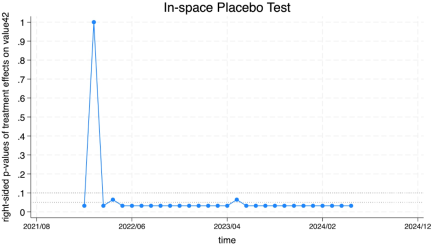
Based on the results from Table 2, the category with the most significant effect was selected for a case study of typical import categories, specifically the HS2 classification code 72: “iron and steel.” First, a placebo test was conducted by altering the intervention group, with the same assumption as in Section 3.2 (Figs. 27 and 28 in Appendix A), and the results are robust at the 5% level.
Next, the reliability of the research results was further validated by changing the policy implementation date, consistent with the assumptions in Section 3.3 (Figs. 29–34 in Appendix A). There are noticeable differences between the counterfactual scenario of China’s import trade volume with RCEP-14 countries and its actual value across the three fictional time points and the RCEP implementation time. This discrepancy suggests that other factors may have influenced the steel import trade, indicating that the results are not robust.
Finally, by removing the three countries (Japan, South Korea, and Australia) that exert a reverse impact, we tested the robustness of the results following the assumption in Section 3.4 (Fig. 35 in Appendix A), and the results are robust at the 5% level.
4.4. Summary
This study uses the HS2 commodity classification to perform a synthetic regression estimation of the export and import volumes of 98 international trade goods. Both the baseline regression results and robustness analyses demonstrate that RCEP can significantly boost the export revenues of certain categories of goods for China, whereas its impact on imports is not as pronounced.
On the one hand, RCEP significantly enhances the export revenues of specific product categories, reflecting the effectiveness of regional economic integration in reducing trade barriers and improving market access. Specifically, for goods classified under HS2 code 42 (Articles of Leather; Saddlery and Harness; Travel Goods, Handbags and Similar Containers; Articles), RCEP has a notable positive impact. These goods often involve high added value and brand effects. The implementation of RCEP through tariff concessions, facilitation of rules of origin, and strengthening of intellectual property protection provides broader markets and a more stable trade environment for relevant Chinese industries.
On the other hand, the heterogeneous impact of RCEP on goods exports reveals differences in competitiveness and demand elasticity of various products in the international market. Some categories of goods experience strong market demand within the region. China has strong production and export capabilities in these areas, resulting in significant export gains under the RCEP framework. However, for the other goods categories, global market competition and strong domestic substitution capabilities may prevent similar export gains. Moreover, while RCEP promotes exports, it also provides more opportunities for technological cooperation and investment for domestic enterprises, enhancing domestic production capabilities and reducing dependence on imported goods, potentially weakening the impact of RCEP on imports. Additionally, state policy protection and support for certain key industries might offset the effect of RCEP on import trade to some extent. Specifically, the adjustment of the domestic industrial structure and accelerated technological advancement have enhanced local production competitiveness, thereby reducing the demand for certain imported goods.
5. Conclusions and Prospects
This study provides empirical evidence of the effects of RCEP implementation on China’s intra-regional trade from both aggregate and structural perspectives. Using SCM, we demonstrate that RCEP has contributed to a sustained increase in China’s intra-regional trade and generated heterogeneous effects across trade margins and product categories. Rather than reiterating the descriptive results, the following discussion synthesizes the main findings and focuses on their economic interpretations and policy implications.
By considering industry and product heterogeneity, these insights provide critical references for companies in formulating export strategies, encouraging them to optimize products and adjust structures based on market demand and their advantages. The export growth of high-value-added goods under RCEP indicates that RCEP has substantial potential to deepen value-chain trade among member countries, particularly in the manufacturing sector. Conversely, the import demand for certain key industries in China may not have changed significantly owing to RCEP. This demand is likely to be influenced more by domestic economic policies, industrial structure adjustments, and global market dynamics, rather than directly by regional trade agreements. From a policy perspective, the results suggest that RCEP implementation has heterogeneous effects across industries, indicating the need for targeted industrial support policies. Policymakers may prioritize facilitating participation of small and medium-sized enterprises in regional value chains by reducing informational and compliance costs. At the firm level, enterprises are encouraged to adjust their sourcing strategies and invest in upgrading product quality to better leverage preferential trade arrangements under RCEP. In the short run, RCEP implementation appears to primarily affect trade volumes by intensifying existing trade relationships, whereas long-term effects are more likely to occur through structural adjustments, including product upgrading and reallocation across sectors. Policy measures should combine immediate trade facilitation with long-term support for industrial upgrades.
In future policymaking, the Chinese government should focus on leveraging the market access opportunities presented by RCEP to drive domestic industrial upgrading and structural optimization, thereby enhancing China’s overall competitiveness in international trade. In this context, China’s role in promoting global cooperation and maintaining a multilateral trade system becomes increasingly important. Future research could further explore the specific mechanisms and long-term effects of these impacts to comprehensively understand and track RCEP’s potential to drive China’s economic development and promote regional economic integration. Furthermore, while this study focuses on China as the treated unit, its findings may not be directly generalizable to economies with substantially different trade structures or institutional settings. Future research could extend this framework to other RCEP members or employ firm-level data to further explore micro-level adjustment mechanisms induced by regional trade agreements.
Appendix A. Supplementary Figures
Figures 12–35 show the supplementary figures regarding the placebo tests to improve readability of the main text.
Source: Original data from CEIC; results calculated by the author using Stata 18.
Fig. 12. Placebo test: comparison of actual and synthetic export trade volume (US–China trade friction escalation).
Source: Original data from CEIC; results calculated by the author using Stata 18.
Fig. 13. Placebo test: treatment effect on export trade volume (US–China trade friction escalation).
Source: Original data from CEIC; results calculated by the author using Stata 18.
Fig. 14. Placebo test: comparison of actual and synthetic export trade volume (COVID-19 pandemic outbreak).
Source: Original data from CEIC; results calculated by the author using Stata 18.
Fig. 15. Placebo test: treatment effect on export trade volume (COVID-19 pandemic outbreak).
Source: Original data from CEIC; results calculated by the author using Stata 18.
Fig. 16. Placebo test: comparison of actual and synthetic export trade volume (RCEP signing).
Source: Original data from CEIC; results calculated by the author using Stata 18.
Fig. 17. Placebo test: treatment effect on export trade volume (RCEP signing).
Source: Original data from CEIC; results calculated by the author using Stata 18.
Fig. 18. Placebo test for typical export categories: distribution of fitting errors in trade volume.
Source: Original data from CEIC; results calculated by the author using Stata 18.
Fig. 19. Right-hand \(p\)-value test for typical export categories.
Source: Original data from CEIC; results calculated by the author using Stata 18.
Fig. 20. Placebo test: comparison of actual and counterfactual trade volumes of typical export categories (US–China trade friction escalation).
Source: Original data from CEIC; results calculated by the author using Stata 18.
Fig. 21. Placebo test: treatment effect on trade volumes of typical export categories (US–China trade friction escalation).
Source: Original data from CEIC; results calculated by the author using Stata 18.
Fig. 22. Placebo test: comparison of actual and counterfactual trade volumes of typical export categories (COVID-19 pandemic outbreak).
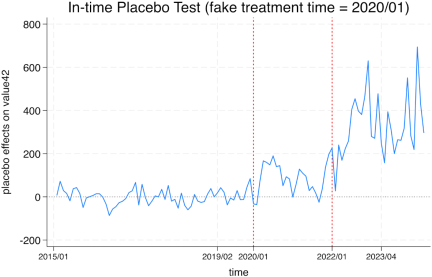
Source: Original data from CEIC; results calculated by the author using Stata 18.
Fig. 23. Placebo test: treatment effect on trade volumes of typical export categories (COVID-19 pandemic outbreak).
Source: Original data from CEIC; results calculated by the author using Stata 18.
Fig. 24. Placebo test: comparison of actual and counterfactual trade volumes of typical export categories (RCEP signing).
Source: Original data from CEIC; results calculated by the author using Stata 18.
Fig. 25. Placebo test: treatment effect on trade volumes of typical export categories (RCEP signing).
Source: Original data from CEIC; results calculated by the author using Stata 18.
Fig. 26. Right-hand \(p\)-value test for exports after excluding Japan, South Korea, and Australia.
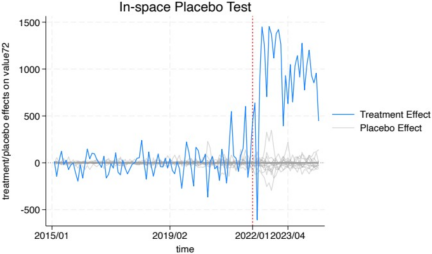
Source: Original data from CEIC; results calculated by the author using Stata 18.
Fig. 27. Placebo test for typical import categories: distribution of fitting errors in trade volume.
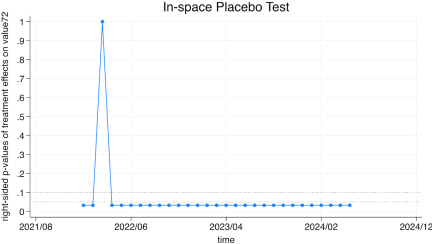
Source: Original data from CEIC; results calculated by the author using Stata 18.
Fig. 28. Placebo test for typical import categories: right-hand \(p\)-value test.
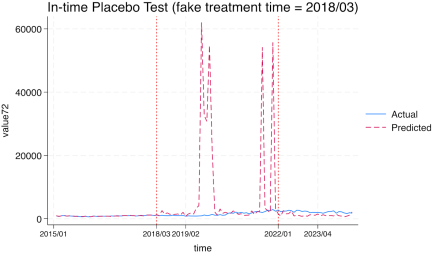
Source: Original data from CEIC; results calculated by the author using Stata 18.
Fig. 29. Placebo test: comparison of actual and counterfactual trade volumes of typical import categories (US–China trade friction escalation).
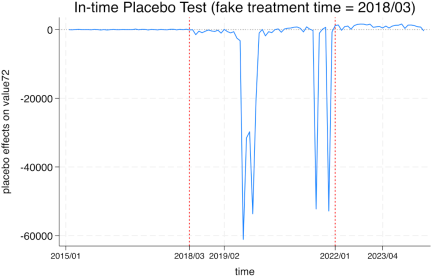
Source: Original data from CEIC; results calculated by the author using Stata 18.
Fig. 30. Placebo test: treatment effect on trade volumes of typical import categories (US–China trade friction escalation).
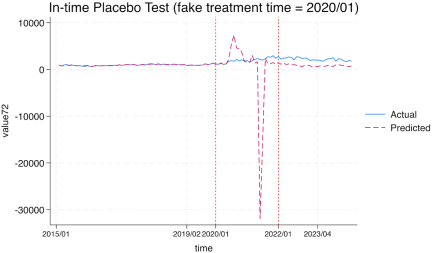
Source: Original data from CEIC; results calculated by the author using Stata 18.
Fig. 31. Placebo test: comparison of actual and counterfactual trade volumes of typical import categories (COVID-19 pandemic outbreak).
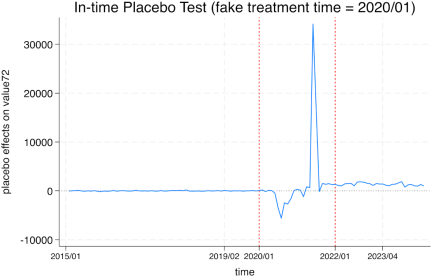
Source: Original data from CEIC; results calculated by the author using Stata 18.
Fig. 32. Placebo test: treatment effect on trade volumes of typical import categories (COVID-19 pandemic outbreak).
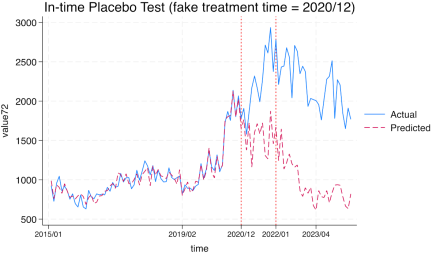
Source: Original data from CEIC; results calculated by the author using Stata 18.
Fig. 33. Placebo test: comparison of actual and counterfactual trade volumes of typical import categories (RCEP signing).
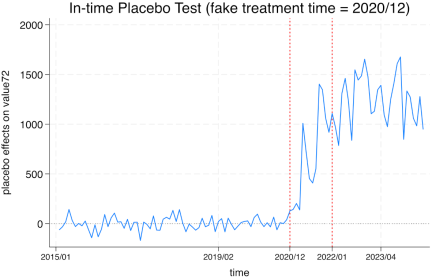
Source: Original data from CEIC; results calculated by the author using Stata 18.
Fig. 34. Placebo test: treatment effect on trade volumes of typical import categories (RCEP signing).
Source: Original data from CEIC; results calculated by the author using Stata 18.
Fig. 35. Right-hand \(p\)-value test for imports after excluding Japan, South Korea, and Australia.
Acknowledgments
This work was supported by the National Social Science Foundation of China (Grant No.25CGJ037). The authors affirm that there are no conflicts of interest to disclose.
- [1] M. Kawai and G. Wignaraja, “The Asian ‘noodle bowl’: Is it serious for business?,” Asian Development Bank Institute (ADBI) Working Paper Series, No.136, 2009.
- [2] J. E. Anderson and E. van Wincoop, “Gravity with gravitas: A solution to the border puzzle,” Am. Econ. Rev., Vol.93, No.1, pp. 170-192, 2003. https://doi.org/10.1257/000282803321455214
- [3] R. Baldwin, “Trade and industrialisation after globalisation’s 2nd unbundling: How building and joining a supply chain are different and why it matters,” National Bureau of Economic Research (NBER) Working Paper, No.17716, 2011. https://doi.org/10.3386/w17716
- [4] R. Baldwin and D. Jaimovich, “Are free trade agreements contagious?” J. Int. Econ., Vol.88, No.1, pp. 1-16, 2012. https://doi.org/10.1016/j.jinteco.2012.03.009
- [5] J. Bhagwati, “Shaping India’s future,” The Times of India, June 26, 2012. https://timesofindia.indiatimes.com/edit-page/shaping-indias-future/articleshow/14393212.cms [Accessed December 5, 2025]
- [6] P. A. Petri and M. Plummer, “RCEP: A new trade agreement that will shape global economics and politics,” The Brookings Institution, 2020. https://scholarworks.brandeis.edu/esploro/outputs/website/RCEP-A-new-trade-agreement-that/9924085789501921#details [Accessed June 25, 2026]
- [7] K. J. Pelc, “Googling the WTO: What search-engine data tell us about the political economy of institutions,” Int. Organ., Vol.67, No.3, pp. 629-655, 2013. https://doi.org/10.1017/S0020818313000179
- [8] A. Mattoo, A. Mulabdic, and M. Ruta, “Trade creation and trade diversion in deep agreements,” Can. J. Econ., Vol.55, No.3, pp. 1598-1637, 2022. https://doi.org/10.1111/caje.12611
- [9] K. Sun, H. Xiao, Z. Jia, and B. Tang, “Estimating the effects of regional value chains of the RCEP in a GVC-CGE model,” J. Asian Econ., Vol.88, Article No.101647, 2023. https://doi.org/10.1016/j.asieco.2023.101647
- [10] Z. Fan, S. Peng, and W. Hu, “How does the regional comprehensive economic partnership affect the restructuring of global value chains?,” China World Econ., Vol.31, No.3, pp. 140-172, 2023. https://doi.org/10.1111/cwe.12488
- [11] C. Estrades, M. Maliszewska, I. Osorio-Rodarte, and M. Seara e Pereira, “Estimating the economic impacts of the regional comprehensive economic partnership,” Asia Glob. Econ., Vol.3, No.2, Article No.100060, 2023. https://doi.org/10.1016/j.aglobe.2023.100060
- [12] P. Egger and M. Larch, “Interdependent preferential trade agreement memberships: An empirical analysis,” J. Int. Econ., Vol.76, No.2, pp. 384-399, 2008. https://doi.org/10.1016/j.jinteco.2008.08.003
- [13] F. Lin, Y. Lv, H. Yang, and Y. Li, “Exploring the welfare effects of RCEP—A quantitative analysis based on a structural model,” Digit. Econ. Sustain. Dev., Vol.2, Article No.3, 2024. https://doi.org/10.1007/s44265-023-00025-y
- [14] J. Han and Y.-Y. Xu, “RCEP and the integration of Asia-Pacific trade agreements—A quantitative study on the agreement text,” China Ind. Econ., Vol.2021, No.7, pp. 81-99, 2021 (in Chinese). https://doi.org/10.19581/j.cnki.ciejournal.2021.07.005
- [15] A. Abadie, A. Diamond, and J. Hainmueller, “Synthetic control methods for comparative case studies: Estimating the effect of California’s tobacco control program,” J. Am. Stat. Assoc., Vol.105, No.490, pp. 493-505, 2010. https://doi.org/10.1198/jasa.2009.ap08746
- [16] E. Cavallo, S. Galiani, I. Noy, and J. Pantano, “Catastrophic natural disasters and economic growth,” Rev. Econ. Stat., Vol.95, No.5, pp. 1549-1561, 2013. https://doi.org/10.1162/REST_a_00413
- [17] S. A. Hannan, “The impact of trade agreements: New approach, new insights,” IMF Working Paper No.2016/117, 2016. https://doi.org/10.5089/9781484386521.001
- [18] S. A. Hannan, “The impact of trade agreements in Latin America using the synthetic control method,” IMF Working Paper No.WP/17/45, 2017.
- [19] E. Colla-De-Robertis and R. G. Rivera, “The effect of a free trade agreement with the United States on member countries’ per capita GDP: A synthetic control analysis,” Reg. Sci. Policy Pract., Vol.13, No.4, pp. 1129-1146, 2021. https://doi.org/10.1111/rsp3.12402
- [20] Q. Li and H. C. Moon, “The trade and income effects of RCEP: Implications for China and Korea,” J. Korea Trade, Vol.22, No.3, pp. 306-318, 2018. https://doi.org/10.1108/JKT-03-2018-0020
- [21] L. Zhou, C. Pan, J. He, and S. Li, “The impact of RCEP on Chinese regional economy from global value chains perspective,” 24th Annual Conf. on Global Economic Analysis, 2021.
- [22] Ö. Karahan and O. Çolak, “The causality relationship between foreign direct investment and economic growth in RCEP countries,” J. Econ. Adm. Sci., Vol.40, No.1, pp. 95-110, 2024. https://doi.org/10.1108/JEAS-04-2022-0112
- [23] R. Wang, “New dynamics and prospects of China-Japan-ROK economic and trade cooperation,” Foreign Aff. J., Vol.135, pp. 30-44, 2020.
- [24] J. P. Xi, “Implementing new development concepts in the new development stage will inevitably require the construction of a new development pattern,” QiuShi, Vol.2022, No.17, 2022. http://www.qstheory.cn/dukan/qs/2022-08/31/c_1128960034.htm [Accessed June 25, 2026]
- [25] X. C. Li, “RCEP will stabilize the supply of raw materials for China’s steel industry and enhance low-carbon cooperation within the region,” Southern Finance and Economics Net, February 7, 2021 (in Chinese). https://m.sfccn.com/2021/2-7/yNMDE0MDVfMTYyNTUyNA.html [Accessed December 5, 2025]
This article is published under a Creative Commons Attribution-NoDerivatives 4.0 Internationa License.