
Research Paper:
An Interpretable and Hierarchical Positive-Prior-Driven Student Evaluation Enhancement Decision-Making Strategy
Aiqin Wang*,†
 and Wenliang Li**
*Zhangjiagang Campus, Jiangsu University of Science and Technology
No.8 Changxing Middle Road, Zhangjiagang, Suzhou, Jiangsu 215600, China
†Corresponding author
**School of Computing, Jiangsu University of Science and Technology
No.2 Mengxi Road, Zhenjiang, Jiangsu 212100, China

A scientific and reasonable student evaluation system plays a crucial guiding role in the development of higher education. However, for the current student evaluation theories and models, their operability is relatively weak. The constructed models have poor adaptability (weak robustness), lack cross-scenario research on guiding policies, and the evaluation results of the models are also relatively single. Therefore, this study proposes a hierarchical student evaluation enhanced decision-making model which is based on a zero-order fuzzy classifier as the construction unit. By introducing the administrative decision-making characteristics of the educational administration department (such as policy orientation indicators, teaching intervention suggestions, etc.), combined with a hierarchical fuzzy system and an improved ridge regression algorithm, it achieves the collaborative optimization of evaluation efficiency and interpretability. The experimental results show that the model demonstrates excellent classification performance and semantic interpretability on the degree student evaluation dataset, and can accurately predict students’ academic performance and support personalized educational decisions.
1. Introduction
Student evaluations serve as a driving force for effective teaching in higher education institutions, and traditional student evaluation models are limited by single evaluation subjects and methods, weak correlation with actual scenarios in the evaluation process, and insufficient use of the evaluation results. In October 2020, the Communist Party of China Central Committee and the State Council issued a programmatic document to guide the reform of education evaluations, which was labeled the Overall Plan for Deepening Educational Evaluation Reform in the New Era and focused on the clearly stated aims of improving result evaluations, strengthening process evaluations, exploring value-added evaluations, and improving comprehensive evaluations 1. In February 2022, the Key Tasks of the Ministry of Education reported that the digitalization of education should be rapidly promoted, the student evaluation system should be improved, and a new and more targeted data-based student evaluation model should be created 2. Therefore, in line with the trend of “internet + education,” it has been claimed that various information technologies should be fully used to develop innovative evaluation tools and new concepts rooted in artificial intelligence (AI), as well as to explore new models of student evaluation in the context of higher education. Furthermore, the student evaluation process should be reconstructed, and the humanized, intelligent, and personalized development of student evaluations should be promoted. These possibilities have been identified as necessary measures in the context of efforts to promote the development of higher education in China.
In recent years, many scholars have conducted in-depth studies to investigate AI-based student assessment theories and models. In general, relevant studies can be divided into the following categories. (1) Evaluation strategy construction and system theory-based discussion. Some scholars proposed an innovation path selection strategy for student assessments in the AI era from the perspectives of evaluation methods, evaluation measures, evaluation content, and development tools, and conducted a theoretical analysis to explore ways to construct an intelligent student evaluation system 3,4,5,6,7. (2) Evaluation efficacy-based practical applications. For this category, AI technology is used to conduct human-computer collaborative education evaluations in curriculum-based ideological and political education (Zhang and Liao 8), mental health assessment (Luo et al. 9), and innovation and entrepreneurship education (Ou et al. 10); the evaluation results are more objective and accurate, and students’ “implicit abilities” are better demonstrated 8,9,10. (3) Evaluation-based model construction and validation. Studies of this type focus on comprehensive quality evaluations and value-added evaluations. Typical works in this paper include the follows. Lin and Zhong combined the “OSEMN” big data analysis framework and the “\({1+N}\) distributed intelligent agent system” structure to construct an integrated “teaching-learning-assessment” AI education large language model (LLM), thus guiding the evaluation of the comprehensive quality of the students 11. Yu used the discrete Hopfield neural network to evaluate the comprehensive quality of the students 12. Currently, the models used in value-added evaluations include the student growth percentile model, multilayer linear model, residual model, gain model, hierarchical model, and classification model 13. These studies have investigated strategies, path selection, and the efficiency of student assessments from the perspectives of theory, technology, and modeling, which are subjective to a certain extent and ignore the authorized role of policy guidance on the assessment results.
The gaps between specific policies and their implementation can be broadly categorized as follows. (1) Regarding evaluation objectives, existing policies tend to prioritize students’ final grades. However, significant challenges remain in the implementation of unified collection, standardized quantification, and interpretable integration of multi-source process data, such as classroom exercises, video viewing, forum participation, online quizzes, assignments, and offline lab processes. Consequently, forming an actionable closed loop for early warning and intervention is difficult 14. In practice, there is often an over-reliance on summative indicators like “final exams, regular tests, and overall course grades,” while process evidence such as video viewing, classroom exercises, and forum participation is underutilized. This leads to an inability to accurately reflect learning engagement and the quality of the learning process. (2) Guided by policies promoting the digitalization and scalability of educational evaluation, evaluation models are expected to operate stably across different courses and semesters 15. However, due to significant discrepancies in evaluation dimensions and scoring criteria between theoretical and laboratory courses, as well as shifts in data distribution over time, traditional models often suffer from poor generalization (i.e., being effective in one course but invalid when applied to another or a different semester). This instability severely limits their large-scale application in academic administration.
With the rapid development of AI technology, research in student evaluation-related fields has achieved fruitful results. However, the following challenges remain:
-
Making full use of the administrative decision-making of the academic affairs office to improve the evaluation efficiency of the model.
-
Constructing a reasonable and interpretable student evaluation model to provide appropriate guidance for the issues of students’ behavioral norms and academic level.
Therefore, this study introduces four new evaluation features that are provided by the academic affairs office (e.g., in-class exercises, proportion of forum discussions, score of Offline Assignment 5, and regular test scores) into the model and combines them with the original student characteristics to construct a hierarchical fuzzy classifier. Only the top 30% of important rules are retained at each layer and passed on to the next layer to reduce noise interference. This structure not only retains the key policy guidance characteristics but also intuitively reflects the student evaluation results through the semantic output of the fuzzy rules. Specifically, the hierarchical structure enables phased modeling of the student evaluation process. Specifically, the first layer takes evidence—ranging from course grades and online behaviors (e.g., in-class exercise scores and video viewing duration) to offline assessment processes (e.g., assignment grades and lab report grades) and final exams—and converts it into semantic representations to generate interpretable rules. The subsequent layer then utilizes the outputs of key rules from the preceding layer as “guiding features” for comprehensive judgment, thereby achieving a progressive evaluation that moves from process-oriented evidence to a comprehensive conclusion. This structure aligns with the policy emphasis on process and comprehensive evaluation. By retaining the top 30% of key rules at each layer to establish priorities, it enhances the interpretability and actionability of the results, ultimately bridging the gap between policy goals and practical implementation.
This paper is arranged as follows. Section 1 describes the research background and motivation. Section 2 briefly describes the relevant knowledge involved in this study. Section 3 elaborates the model and the empirical analysis proposed in this study. Section 4 summarizes this study.
2. Related Work and Model Construction
To ensure that each basic construction unit has good interpretability, a set of independent features is selected on the basis of a randomizing mechanism that chooses from many candidate attributes, and the fuzzy rule base is constructed via a randomizing algorithm to increase the generalization ability of the system. Based on the data characteristics, a membership function with good discriminative abilities is created, and fuzzy \(c\)-means (FCM) clustering is used 16; the function addresses the ambiguity and multicategory characteristics of the data and is especially suitable for situations where there is an overlap in the processing data. For example, FCM is employed to perform soft clustering on student features, accommodating the “non-absolute boundaries” characteristic of student learning states (e.g., a single student may exhibit mixed states such as “average course grades” but “weak experimental skills”). Building on this, Gaussian membership functions are utilized to transform continuous numerical features into interpretable semantic levels. For instance, metrics such as “video view counts,” “in-class exercise scores,” and “proportion of forum comments” are mapped to linguistic variables ranging from “weak” to “very strong.” Similarly, “experiment preparation, operation, and reports” are mapped to corresponding levels. This approach aligns process evaluation more closely with educational management terminology and facilitates easier interpretation.
In traditional hierarchical neural networks (HNNs), to minimize the errors, the calculation methods employed for the output weights usually use iterative methods, such as the gradient descent algorithm 17. However, the local minimum problem may be encountered during the process of using gradient descent to optimize the function, and when training large-scale samples, the training speed usually cannot meet expectations. The extreme learning machine 18 facilitates the rapid learning of hierarchical fuzzy classifiers by using the solution of the minimized loss function as the output weight of the connection coefficient variable, thus forming the theoretical basis of this study.
The output weight between the hidden layer and the output layer is affected by many factors, such as the network structure and activation function. In addition to considering the error between the actual value and the expected value, owing to the gradual influence of the relationship between the HNN layers, the interlayer influence also gradually increases, so more attention should be given to the influencing factors between two adjacent layers. This study aims to design a novel fuzzy classifier to solve the approximation and convergence problems between the different layers simultaneously.
2.1. Zero-Order Fuzzy Classifier
The basic construction unit is the zero-order fuzzy classifier. The zero-order fuzzy classifier is intuitive and easy to understand, and has a strong ability to address uncertainty and ambiguous information; furthermore, it exhibits strong interpretability. In practical applications, a “zero-order fuzzy classifier” can be understood as an interpretable evaluation unit based on IF-THEN rules, which maps students’ multi-source features to evaluative conclusions and justifications. For instance, when grades in courses such as “Electrical Machinery and Drives” and “Electric Drive Automatic Control Systems” are low, coupled with weak “test scores” and “assignment grades,” as well as low “video view counts/discussion forum engagement,” the system generates a semantic conclusion indicating that “academic risk exists and intervention is required.” By providing the key evidence that triggers this conclusion, the classifier supports the Academic Affairs Office in early warning and intervention decision-making. The specific manifestations are as follows 19,20:
The Gaussian membership function is usually used as the fuzzy membership function, and its expression is as follows 16:
Suppose that the training set is \(D_{t} = \{{(x_{1}, T_{1})}, {(x_{2}, T_{2})}, \dots, {(x_{N}, T_{N})}\}\), \(x_{n}\) is expressed as the \(n\)-th input vector, \(T_n\) represents the real label set, and the matrix \(X\) and matrix \(T\) are set as the training set and the true class label set, respectively. The specific process is described in 21.
2.2. Ridge Regression
Ridge regression is a special type of linear regression 22,23 that is often used to solve multicollinearity problems and prevent overfitting. Based on classic linear regression, a regularization term is added to the loss function to limit the size of the regression coefficient, thereby improving the generalization ability and prediction stability of the model. The core idea is to solve the regression coefficients via the least squares method. The basic construction units of the first layer are calculated via classic ridge regression in this study, and the specific expressions are as follows.
Definition of objective function is expressed as follows 22,23:
After the partial derivative of variable \(\boldsymbol{\beta}_{\textit{tp}}\) is taken and the partial derivative result is set equal to 0, the following solution is obtained 24:
2.3. Fuzzification Process
The degrees to which feature \(x_i\) belongs to the corresponding fuzzy set in the rule are sorted in ascending order.
The control threshold is set at 30%, and the top 30% of important features are selected as the input of the training model.
The output of zero-order TSK fuzzy classifier can be generated as follows:
2.4. Hierarchical Fuzzy Learning Model
The hierarchical fuzzy system constructed in this study contains \(\mathit{TD}\) layers, which can be divided into two situations:
-
1)
If \(\mathit{TD} = 1\), the corresponding hierarchical fuzzy system is the classic zero-order fuzzy classifier which is used as the first layer of the training model.
-
2)
If \(\mathit{TD} \ge 2\), the corresponding training structure is called in this study a hierarchical fuzzy system.
If the FCM is used to cluster the input samples into \(C\) clusters, the features that correspond to \(C\) Gaussian membership functions in the fuzzy system are recorded as \(f_{1}, f_{2}, \dots, f_{c}\). According to the clustering algorithm FCM, all cluster centers are obtained and normalized between 0 and 1. Next, the distance between each cluster center and the boundary value 0 or 1 is calculated, and these distances are ranked in ascending order, thus forming several uncertain fuzzy intervals. For example, the cluster center \(a_j\) of the feature \(x_j\) satisfies \(\Vert a_{j}-0\Vert > \Vert a_{j}-1\Vert\). The cluster center \(x_j\) is set at the interval \((a_{j}, 1)\). By assigning a corresponding semantic explanation to each interval according to the degree of semantic description, sufficient interpretability can be obtained (e.g., weak, relatively weak, medium, strong, and very strong). The closer the cluster center is set to 1, the better the semantic interpretation ability of the feature.
When the actual situation of the teaching systems is considered, the teaching situations of two adjacent training layers usually exhibit certain similarities. However, the learning of the latter layer can be based on the training and learning of the previous layer. In other words, there is a certain correlation between these adjacent training layers.
For the \(\mathit{td}\)-th training layer (\(\mathit{td} > 1\)), the input set can be described as \(x_{\mathit{td}} \leftarrow x \oplus \mathit{Rank}\{Y_{i}\}\), where \(\mathit{Rank}\{Y_{i}\}\) is selected from the top 30% of important/critical outputs of the previous layer to ensure that the output of the previous layer has a strong guiding effect on the next training layer (suggestion from the academic affairs office), and \(x_{\mathit{td}}\) is the input set of the \(\mathit{td}\)-th training layer.
Obviously, this innovative design strategy cleverly avoids the influence of the previous training layer on the noise and redundant features of the input set of the subsequent training layer for traditional hierarchical fuzzy system while also maximizing the potential of the fuzzy classification performance for each training layer.
In the novel fuzzy student evaluation system discussed in this study, the value of cluster center of each feature is determined by the training samples from the previous layer. For other training layers, the original training sample \(X\) and \(x_{\mathit{td}}\) (i.e., enhanced features in this study) constitute a new type of training sample. This training method, which introduces the input of the previous layer as the guidance feature of the current layer, achieves feature enhancement to a certain extent. The implementation details are expressed as follows: \(X = [x_{1}, x_{2}, \dots, x_{15}]\) and \(X' = [x'_{1}, x'_{2}, x'_{3}, x'_{4}]\), where \(X\) are the original 15 student evaluation features, and \(X'\) are the four newly added evaluation characteristics. Now, \(X'\) is used to construct a hierarchical fuzzy system that offers guidance and suggestions concerning educational affairs (Fig. 1).
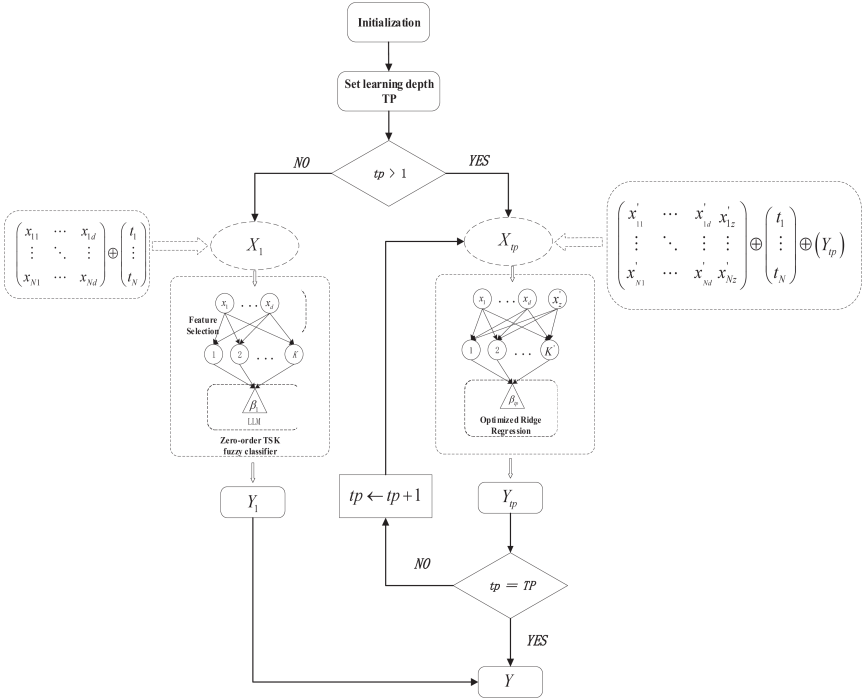
Fig. 1. Hierarchical training structure diagram with significant use of guidance.
2.5. Quantitative Consideration of Feature Enhancements
A new fuzzy classifier \(\mathrm{FC}_1\) is constructed on the basis of the four added features. The \(k_i\) is the number of fuzzy rules in layer \(i\), and the corresponding fuzzy rules can be expressed as 25:
Here, \(\oplus\) stands for a certain specific operation.
In this way, a fuzzy classifier is constructed, and the original input space is enhanced by the new features to open the manifold structure in the original data space in a stacked manner 21.
The output of the new fuzzy classifier is as follows:
By adding the membership product of the new feature \(x'_i\) to the equation, the generalization ability and classification accuracy of the entire model are improved. Combinations of new features (one to four) are selected and integrated with the existing features, which can greatly enrich the input of the model, thereby improving the generalization ability and interpretability of the model.
2.6. Optimization Strategy for the Objective Function
In this study, a novel hierarchical fuzzy classifier is designed to improve the approximation and convergence problem between adjacent training layers. A new method is proposed on the basis of ridge regression to address the consequent parameters of the fuzzy classifier. This classifier can perform classification more effectively. Next, the objective function is redefined as follows:
Equation 14 not only ensures the consistency of the construction units in the base but also ensures the approximation and convergence of the adjacent basic units.
Taking the partial derivative of Eq. 14 with respect to \(\boldsymbol{\beta}_{\mathit{tp}}\) yields the following:
According to the nature of ridge regression, the expression for weight \(\boldsymbol{\beta}\) is directly solved without the hassle of repeated iterations. Also, the influence of the previous layer and the error between the expected value and the actual value are considered in this study.
2.7. Proof and Analysis of the Quantitative Positive Correlation of Training Error
Next, a quantitative analysis is performed for the classification performance following the application of the enhanced features of the tp-th layer, as well as the positive correlation between training error and training parameters (i.e., \({\Vert \boldsymbol{H}'_{{\!}\mathit{tp}} \boldsymbol{\beta}'_{\mathit{tp}} - \boldsymbol{T} \Vert}^{2} \le {\Vert \boldsymbol{H}_{{\!}\mathit{tp}} \boldsymbol{\beta}_{\mathit{tp}} - \boldsymbol{T} \Vert}^{2}\)).
The general error for the \(\mathit{tp}\)-th layer can be described as follows:
The construction error in this study is described as follows:
According to Eq. 16, it is not difficult to determine the following:
To verify the quantitative impact of the newly added features of the academic affairs office on model performance, this study performs a feature correlation analysis on the basis of information gain. The information gain ratios (IGRs) of the newly added educational affairs features and classification labels are calculated with the aim of quantifying their contributions to decision-making:
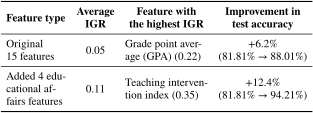
An analysis reveals that the mean IGR of the newly added educational affairs characteristics is 54.5% greater than that of the original characteristics, thus indicating that this approach is more policy-guided. When the “Teaching intervention index” that exhibits the highest IGR is introduced, the testing accuracy of the model on Dataset 4 reaches 94.21% (compared with 81.81% of the original 19–15 dataset) (Table 1).
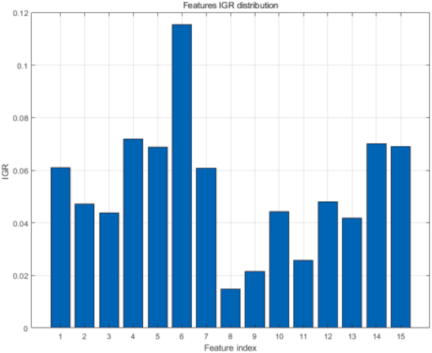
Fig. 2. Information gain ratio (IGR) value distributions corresponding to the dataset formed by the original 15 features.
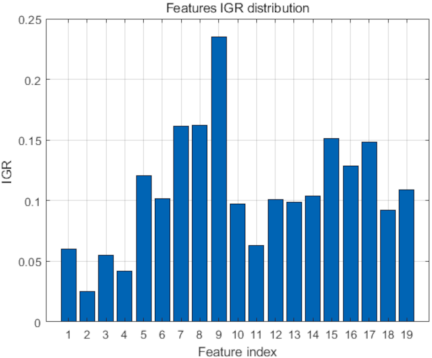
Fig. 3. Distribution map of IGR values corresponding to the dataset formed by the addition of four academic features.
Table 1. Detailed description of the features of the dataset.
3. Experimental Results and Analysis
3.1. Improved Algorithm for the Objective Function
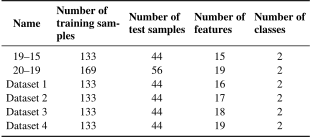
This paper uses the student evaluation data obtained from a university as sample data, and it mainly includes relevant course data, online behavior data, and offline behavior data. The dataset (called “19–15”) includes 19-year-old students, and the dataset (called “20–19”) includes 20-year-old students. The dataset “19–15” is associated with 15 student characteristics, and the dataset “20–19” is associated with 19 student characteristics, including the 15 characteristics included in the 19-year dataset and the newly added four characteristics. The original set of 15 features primarily covers the core dimensions of student learning outcomes and processes, which can be categorized as follows: (1) course learning outcomes: grades for electrical machinery and drives, electric drive automatic control systems, and detection technology; (2) online learning process: number of videos viewed, total view frequency, online quiz scores, and online assignment scores; (3) offline tasks and laboratory processes: scores for four offline assignments, as well as evaluations for experiment preparation, operation, and reports; and (4) final exam scores. The four newly added features are: in-class exercises, discussion forum participation, Offline Assignment 5, and regular tests. Each feature in the dataset usually represents the basic information of a student, such as class learning outcomes, online learning process, and offline tasks and laboratory processes, and these features are helpful for analysing the learning status, comprehensive quality, and academic trends of the student. In the experiments, in addition to the original two student datasets, one feature, two features, three features, and four features are randomly selected from the four newly added features in the 20-year dataset and added into the 19-year dataset to generate four new datasets (Datasets 1–4) for testing. For each dataset, the first 75% of the data are used for training, and the remaining 25% of the data are used for testing. In this study, the experiments are performed on a computer with an i5-8400U processor and 8 GB of memory. Table 2 presents the detailed information concerning the datasets.
Table 2. Experimental dataset description.
To verify that the classifier proposed in this paper exhibits good classification performance, QI-TSK-FC and D-TSK-FC, as well as two algorithms selected in Keel software, i.e., GFS-GCCL-C and MOGUL-C, are tested on the datasets. QI-TSK-FC is a quantitative ensemble-based hierarchical TSK fuzzy classifier that resolves the influence of the output of the previous layer on the input of the next layer in the traditional hierarchical model and ensures consistency within and between layers. The consequent parameters are obtained through optimized ridge regression, and a quantitative integration scheme is proposed to quantitatively integrate the output of each basic construction unit to obtain the final output result 16. D-TSK-FC is a fuzzy classifier based on the principle of stacked generalization, which is composed of multiple basic construction units. Each basic construction unit is a 0th-order TSK fuzzy classifier, and the LLM is used to solve the consequent parameters of each unit, thus ensuring interpretability while improving classification accuracy 17.
The main parameters of this experiment include training depth \(\mathit{TP}\), the number of fuzzy rules \(L\), the number of clusters \(C\), and the regularization parameter \(\lambda\), where the parameters \(C\), \(\lambda\), \(r\), and \(\xi\) can be adjusted manually. Table 3 lists the experimental parameter settings.
Table 3. Experimental parameter settings.
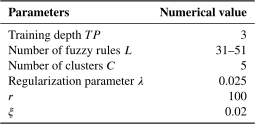
Table 4. Training accuracies [%] and testing accuracies [%] of each classifier with regard to different datasets.
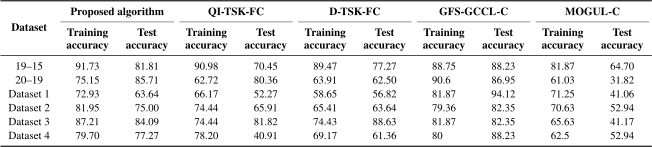
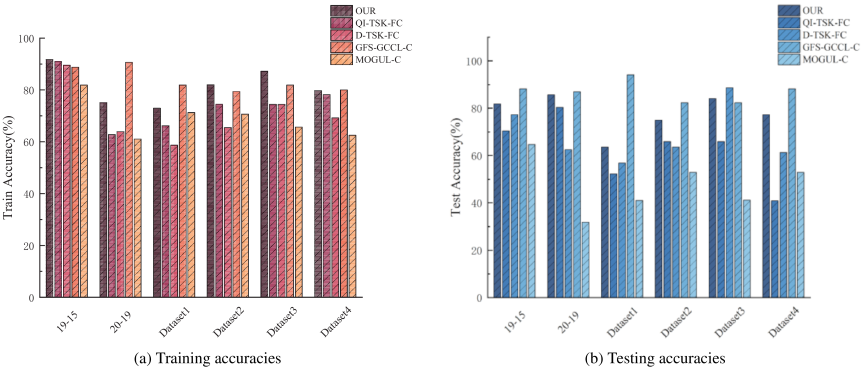
Fig. 4. Training accuracies and testing accuracies of each classifier in each dataset.
Table 5. F1-score [%] of each classifier with respect to different datasets.
3.2. Performance Analysis
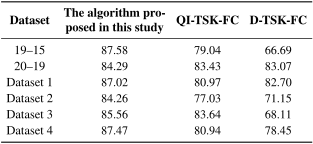
In this experiment, two algorithms in KEEL software (i.e., GFS-GCCL-C and MOGUL-C) and two other algorithms (i.e., D-TSK-FC and QI-TSK-FC) are used in the dataset for testing and comparison. The KEEL software can be downloaded from http://www.keel.es or https://github.com/SCI2SUGR/KEEL. Keel software is a Java-based open-source tool, has a simple interface and powerful functions, and contains many algorithms and datasets. Users can conveniently use the KEEL software for experimental design and algorithm evaluation. The experimental comparison verifies that the optimization method proposed in this paper is feasible and outperforms other algorithms. In the experimental process, several commonly used algorithms are evaluated, and different classifiers are compared by reference to the same dataset. The results show that the classifier proposed in this paper exhibits various improvements and advantages in terms of classification performance compared with the other classifiers. The training accuracies and testing accuracies of each algorithm with respect to different datasets are shown in Table 4, and the parameters obtained in the experiments are counted and compared. As shown in Fig. 4, the training accuracy of the classifier proposed in this paper on dataset “20–19” and the test accuracy on other datasets are slightly lower than those of GFS-GCCL-C. However, the classifier proposed in this paper uses the stacked method and is composed of a zero-order TSK fuzzy classifier as the basic construction unit, so the interpretability and classification efficiency are greater than those of GFS-GCCL-C, because GFS-GCCL-C features a relatively high computational cost, redundant rules, and relatively low interpretability. In addition, the classifier proposed in this paper is better than the other classifiers in terms of training accuracy and testing accuracy. Considering all the relevant factors, the new classifier proposed in this paper is better than the other classifiers. Table 5 shows the F1 score of each classifier in the dataset.
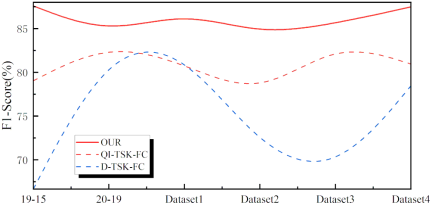
Fig. 5. F1-scores of each classifier with respect to different datasets.
Table 6. The true negative rate SP [%] of each classifiers with respect to different datasets.
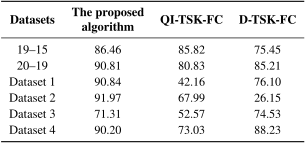
Table 7. The true negative rate SE [%] of each classifier with regard to different datasets.
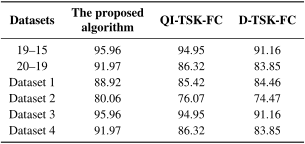
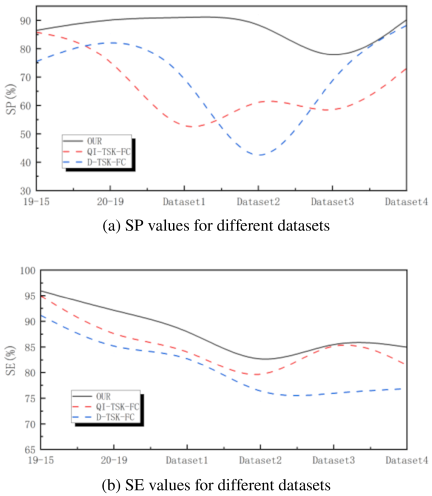
Fig. 6. SP and SE values of each classifier for different datasets.
The optimization method proposed in this paper outperforms other models. A higher F1-score indicates better model performance. When the F1-score is close to 100%, the model has established a good balance between the precision rate and the recall rate of the model, thus indicating that the classifier can accurately predict some specific student attributes, such as students’ overall academic performance and whether they can graduate successfully. Fig. 5 shows that the F1-score of the proposed algorithm is higher than those of the other algorithms. The true negative rate of the classifiers in the dataset, which is also known as the specificity SP, is shown in Table 6. A higher SP indicates a higher probability of the model predicting the negative samples correctly, which, in turn, reflects the classifier’s ability to accurately determine whether students meet graduation requirements with minimal error. The recall rate, i.e., the true positive rate SE, of the classifier in the dataset is shown in Table 7. A higher recall rate indicates a better ability of the model to correctly predict positive samples, thus reflecting that the ability of the classifier to correctly predict the student data is very good. As shown in Fig. 6, the SP and SE of the classifier proposed in this paper are both better than those of the other classifiers.
In summary, the optimization method proposed in this paper has very good feasibility, and the classification accuracies and other evaluation indicators of the proposed classifier are better than those of the other classifiers. Therefore, the classifier proposed in this paper exhibits better performance in terms of fit, which is closely related to the feature enhancement.
Table 8. Average rankings of the algorithms (Friedman).
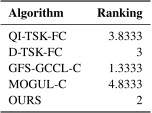
Table 9. Post hoc comparison analysis for \(\alpha=0.05\) (Friedman).
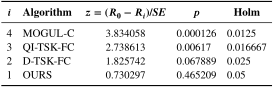
Table 10. Adjusted \(p\)-values (Friedman) (I).
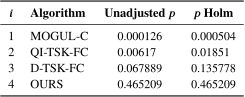
Table 11. Adjusted \(p\)-values (Friedman) (II).
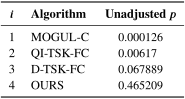
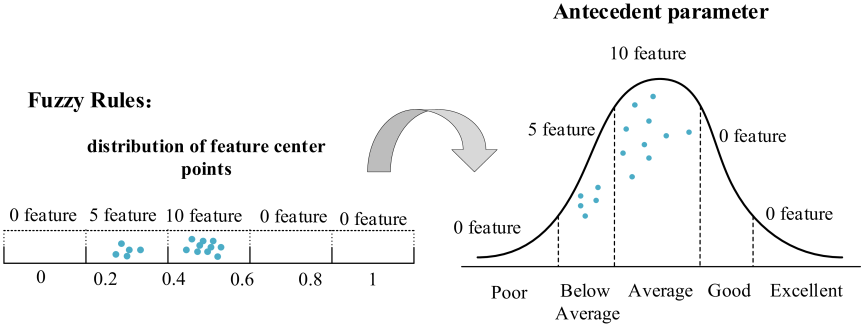
Fig. 7. Interpretability of fuzzy rules.
3.3. Nonparametric Statistical Analysis
To verify the statistical significance of the performance difference of the algorithms, this study uses a nonparametric test method that does not entail any requirements in terms of data distribution. First, the Friedman test is performed to determine whether a global difference is evident between the algorithms, following which the significant difference between the specific algorithm pairs is analyzed on the basis of a post hoc test (such as Holm correction). The results show that the proposed classifier offers significant advantages over the key baseline algorithms while maintaining statistical stability. The results of the analysis are shown as follows.
(1) Average rankings by the Friedman test
According to the Friedman test (Table 8), the OURS algorithm ranks second (better than the QI-TSK-PC and MOGUL-C, and second only to the GFS-GCCL-C). The level of significance (\(p = 0.00086\)) indicates a significant difference among the algorithms.
(2) Friedman post hoc comparison analysis
The difference between the proposed classifier (i.e., OURS) and a benchmark algorithm (i.e., D-TSK-PC) is close to the significance boundary (\(p = 0.067\)) and is significantly better than that of MOGUL-C (\(p < 0.001\)) and QI-TSK-PC (\(p = 0.006\)) (Table 9). After Holm correction is implemented, the conservative statistics of OURS remain stable, whereas the significance of other algorithms (such as MOGUL-C) is amplified. Therefore, it indicates the strong robustness of the proposed classifier.
(3) Friedman-adjusted \(p\)-value analysis
Following multiple testing corrections, the conclusions of the proposed classifier remain stable, whereas the statistical significance of other algorithms (such as MOGUL-C) decreases (Tables 10 and 11), thus indicating that the results of the proposed classifier are less affected by the correction and exhibit higher reliability.
3.4. Interpretability Analysis
This section discusses the interpretability of the model. In this study, the Gaussian membership function is used to perform fuzzy processing on the student dataset via equal interval partitioning. Partitions are named as \(F_{1}, F_{2}, \dots, F_{c}\).
In this study, the number of clusters is 5, and the cluster center point randomly falls on the \(i\)-th fuzzy partition, that is, \(i = 1, 2, \dots, c\). When the cluster center is located in a given fuzzy partition, the corresponding fuzzy partition is assigned a specific linguistic description: poor, relatively poor, medium, good, or excellent. As shown in Fig. 7, there are a total of 15 features, where the clustering centers of features 1–3 and features 8–14 are in the range \([0.4, 0.6]\), whereas the clusterings of features 4–7 and feature 15 are in the range \([0.2, 0.4]\). The semantic interpretation of these features is moderate or poor. Colleges can use these results to predict the grades and future status of the students to predict whether the students can graduate successfully.
Based on the experimental findings and the interpretability analysis, the proposed model can be deployed in higher education student evaluation and teaching management in the following aspects. (1) The results indicate that, in addition to course performance and final examination scores, certain process-oriented indicators exert a substantial influence on students’ overall outcomes. Accordingly, we suggest that universities place greater emphasis on monitoring and assessing two key dimensions, namely, students’ online learning behaviors and experimental process performance, in order to identify potential risks at an earlier stage and implement targeted interventions. (2) In practical teaching, greater attention should also be given to evaluating students’ hands-on abilities as well as their coursework and assignments. (3) Furthermore, the integration of online classrooms and smart learning environments with traditional face-to-face instruction should be promoted, so as to enhance student engagement, motivation, and active participation. (4) With regard to assessment implementation, more comprehensive and robust evaluation metrics, such as F1-score and SP, can be adopted to conduct multidimensional assessments of students’ learning performance and evaluation outcomes.
Although the proposed framework demonstrates promising performance on the collected university dataset, several limitations should be acknowledged. First, the data were collected from the same time period and the same cohort of students, which may not fully reflect variations across cohorts, semesters, or institutions. Second, the sample size is relatively limited, and under small-sample settings, the evaluation results may still be affected by sampling fluctuations. Third, regarding the feature setting, although we construct the evaluation system based on the original 15 features and additionally introduced 4 features, the present study mainly focuses on explaining the student evaluation process from the perspective of AI techniques.
To further enhance the generalizability and practical scalability, future work will focus on collecting data from different student cohorts and/or multiple time periods (and potentially multiple institutions) to increase the diversity of training samples, and expanding the observation dimensions by incorporating richer evaluation evidence, thereby improving the robustness and generalization ability of the proposed model.
4. Conclusion
This study introduces a zero-order fuzzy classifier and takes advantage of its high classification performance and good interpretability to address problems pertaining to student evaluation. Furthermore, more objective suggestions for student evaluations are provided.
A new rule generation method is proposed to ensure the overall performance of the model by screening out and transmitting important rules to the next basic construction unit. On the basis of the same sample, albeit with different numbers of features, two input subspaces are established to verify the effectiveness of the added features for teaching interventions. A new calculation method for output weights is introduced to reduce the errors between the basic construction units and improve the consistency and interpretability of the model. The stacked structure and the stacked-like structure ensure the generalization and consistency of the model and improve the performance of the classifier. More experiments show that Pgt-TC has good classification performance and interpretability in teaching interventions.
By introducing a zero-order fuzzy classifier and considering the administrative decision characteristics of the academic affairs office, a hierarchical student evaluation-enhanced decision-making model is constructed to obtain increased classification performance, interpretability, and practicability of student evaluations. By integrating the guiding characteristics of the academic affairs office (such as teaching interventions and academic early warnings), the training model ensures a close fit between the evaluation results and education policies. Furthermore, it provides a scientific basis for student management in colleges or universities during the actual teaching process.
Acknowledgments
We thank T. Zhou for providing research assistance. Meanwhile, we thank the academic editor and three anonymous reviewers for their contributions to improving the manuscript. Our gratitude is extended to each of the parties listed above. This work was supported in part by the Jiangsu Province Education Science Planning Projects (No.C/2024/01/49).
- [1] State Council, “Overall plan for deepening educational evaluation reform in the new era issued by the communist party of China central committee and the state council,” 2020 (in Chinese). http://www.moe.gov.cn/jyb_xxgk/moe_1777/moe_1778/202010/t20201013_494381.html [Accessed October 13, 2020]
- [2] Ministry of Education of the People’s Republic of China, “2022 key tasks of the Ministry of Education,” 2022 (in Chinese). http://www.moe.gov.cn/jyb_xwfb/gzdt_gzdt/202202/t20220208_597666.html [Accessed February 8, 2022]
- [3] H. Long, “Educational assessment reform in AI era: Opportunities, challenges and path selection,” J. China Exam., Vol.2021, No.11, pp. 10-18+34, 2021 (in Chinese). https://doi.org/10.19360/j.cnki.11-3303/g4.2021.11.002
- [4] B. Liu, T. Yuan, Y. Ji, B. Liu, and L. Li, “Intelligent technology enabling education evaluation: Connotation, overall framework and practice path,” China Educ. Technol., Vol.2021, No.8, pp. 16-24, 2021 (in Chinese). https://doi.org/10.3969/j.issn.1006-9860.2021.08.003
- [5] Z. Liu, X. Zhang, C. Song, Y. Lu, and J. Liu, “Research on the reform of the college student academic evaluation system: A multi-dimensional, in-depth, and comprehensive approach,” J. High. Educ., Vol.10, No.18, pp. 105-109+114, 2024 (in Chinese). https://doi.org/10.19980/j.CN23-1593/G4.2024.18.024
- [6] W. Zeng and Z. Zhou, “From ‘educating for scores’ to ‘educating person’—A probe into the Chinese path to modernization of educational evaluation,” Mod. Educ. Rev., Vol.2023, No.2, pp. 86-92, 2023 (in Chinese). https://doi.org/10.3969/j.issn.2095-6762.2023.02.010
- [7] Z. Zhang, L. Wang, and K. Ji, “Transformation of educational evaluation in new era of big data empowerment: Technical logic, realistic dilemma and realization path,” e-Educ. Res., Vol.43, No.5, pp. 33-39, 2022 (in Chinese). https://doi.org/10.13811/j.cnki.eer.2022.05.005
- [8] R. Zhang and H. Liao, “Value-added evaluation of ideological and political effect of curriculum empowered by intelligent technology: Model design and implementation path,” Heilongjiang Res. High. Educ., Vol.42, No.12, pp. 72-79, 2024 (in Chinese). https://doi.org/10.19903/j.cnki.cn23-1074/g.2024.12.013
- [9] F. Luo, X. Tian, Z. Tu, and L. Jiang, “New trend of educational assessment: A research overview of intelligent assessment,” Mod. Distance Educ. Res., Vol.33, No.5, pp. 42-52, 2021 (in Chinese). https://doi.org/10.3969/j.issn.1009-5195.2021.05.005
- [10] C. Ou, D. Huang, and L. Liang, “Components and operation mechanism of innovation and entrepreneurship education ecosystem in universities empowered by digital intelligence,” Heilongjiang Res. High. Educ., Vol.42, No.12, pp. 133-140, 2024 (in Chinese). https://doi.org/10.19903/j.cnki.cn23-1074/g.2024.12.016
- [11] X. Lin and B. Zhong, “Generative education special transformer empowering comprehensive quality evaluation: Concept, model, and prospect,” Open Educ. Res., Vol.30, No.6, pp. 72-78, 2024 (in Chinese). https://doi.org/10.13966/j.cnki.kfjyyj.2024.06.009
- [12] P. Yu, “Application of discrete Hopfield neural networks in the comprehensive quality assessment of vocational college students,” Technol. Innov. Appl., Vol.14, No.20, pp. 150-153, 2024 (in Chinese). https://doi.org/10.19981/j.CN23-1581/G3.2024.20.034
- [13] K. Zhu, Y. Liu, Y. Shang, and C. Zhang, “Value-added evaluation of teacher education empowered by artificial intelligence: A study of value implications, intrinsic mechanisms and implementation paths,” Digit. Educ., Vol.9, No.5, pp. 15-21, 2023 (in Chinese). https://doi.org/10.3969/j.issn.2096-0069.2023.05.004
- [14] A. Srivastava, V. Vaidya, S. Murthy, and C. Dasgupta, “GeoSolvAR: Scaffolding spatial perspective-taking ability of middle-school students using AR-enhanced inquiry learning environment,” Br. J. Educ. Technol., Vol.55, No.6, pp. 2617-2638, 2024. https://doi.org/10.1111/bjet.13456
- [15] X. L. Pham et al., “Enhancing educational evaluation through predictive student assessment modeling,” Comput. Educ.: Artif. Intell., Vol.6, Article No.100244, 2024. https://doi.org/10.1016/j.caeai.2024.100244
- [16] T. Zhou, Y. Zhou, and S. Gao, “Quantitative-integration-based TSK fuzzy classification through improving the consistency of multi-hierarchical structure,” Appl. Soft Comput., Vol.106, Article No.107350, 2021. https://doi.org/10.1016/j.ASOC.2021.107350
- [17] P. C. Pendharkar, “A comparison of gradient ascent, gradient descent and genetic-algorithm-based artificial neural networks for the binary classification problem,” Expert Syst., Vol.24, No.2, pp. 65-86, 2007. https://doi.org/10.1111/j.1468-0394.2007.00421.x
- [18] G.-B. Huang and C.-K. Siew, “Extreme learning machine: RBF network case,” Proc. 8th Control Autom. Robot. Vis. Conf., Vol.2, pp. 1029-1036, 2004. https://doi.org/10.1109/ICARCV.2004.1468985
- [19] T. Takagi and M. Sugeno, “Fuzzy identification of systems and its application to modeling and control,” IEEE Trans. Syst. Man Cybern., Vol.SMC-15, No.1, pp. 116-132, 1985. https://doi.org/10.1109/TSMC.1985.6313399
- [20] Z. Deng, L. Cao. Y. Jiang, and S. Wang, “Minimax probability TSK fuzzy system classifier: A more transparent and highly interpretable classification model,” IEEE Trans. Fuzzy Syst., Vol.23, No.4, pp. 813-826, 2015. https://doi.org/10.1109/TFUZZ.2014.2328014
- [21] T. Zhou, F.-L. Chung, and S. Wang, “Deep TSK fuzzy classifier with stacked generalization and triplely concise interpretability guarantee for large data,” IEEE Trans. on Fuzzy Systems, Vol.25, No.5, pp. 1207-1221, 2017. https://doi.org/10.1109/TFUZZ.2016.2604003
- [22] R. Bayindir, M. Gok, E. Kabalci, and O. Kaplan, “An intelligent power factor correction approach based on linear regression and ridge regression methods,” 10th Int. Conf. Mach. Learn. Appl. Workshops, pp. 313-315, 2011. https://doi.org/10.1109/ICMLA.2011.34
- [23] Z. Deng, K.-S. Choi, Y. Jiang, and S. Wang, “Generalized hidden-mapping ridge regression, knowledge-leveraged inductive transfer learning for neural networks, fuzzy systems and kernel methods,” IEEE Trans. Cybern., Vol.44, No.12, pp. 2585-2599, 2014. https://doi.org/10.1109/TCYB.2014.2311014
- [24] Y.-J. Zheng, H.-F. Ling, S.-Y. Chen, and J.-Y. Xue, “A hybrid neuro-fuzzy network based on differential biogeography-based optimization for online population classification in earthquakes,” IEEE Trans. Fuzzy Syst., Vol.23, No.4, pp. 1070-1083, 2015. https://doi.org/10.1109/TFUZZ.2014.2337938
- [25] Y. Zhang, H. Ishibuchi, and S. Wang, “Deep Takagi–Sugeno–Kang fuzzy classifier with shared linguistic fuzzy rules,” IEEE Trans. on Fuzzy Systems, Vol.26, No.3, pp. 1535-1549, 2018. https://doi.org/10.1109/TFUZZ.2017.2729507
This article is published under a Creative Commons Attribution-NoDerivatives 4.0 Internationa License.