
Research Paper:
Mobile-RCNN: Research on a Fire Detection Algorithm for Transmission Lines and Their Surroundings
Jiaxian Chen†, Shuang Xu, and Yuanyuan Xing
Guangdong Power Grid Company Foshan Power Supply Bureau
No.1 Fenjiang South Road, Foshan, Guangdong 528000, China
†Corresponding author

With the advancement of the intellectualization of power systems, visible light images captured by inspection robots have found extensive applications in the condition monitoring of transmission lines. However, two key challenges persist in real-world scenarios. First, critical components such as insulators and spacer dampers are frequently configured in dense and small-scale arrangements, rendering them prone to being overlooked by traditional detection methods owing to insufficient feature extraction or inadequate contextual modeling. Second, transmission corridors are often susceptible to various safety hazards, including encroaching vegetation, accumulated water, floating plastic films, and smoke from nearby fires, each posing a significant threat to operational reliability and the safe and stable operation of the power grid. Therefore, we propose a model named Mobile-RCNN that is capable of detecting both densely arranged and small-scale components as well as safety hazards. First, we constructed a safety hazard dataset through on-site photography. Second, we introduced the Q-linear-NMS post-processing method that replaced the non-maximum suppression (NMS) approach with Soft-NMS and incorporated a linear suppression control coefficient. Then, we replaced the intersection over union (IOU) evaluation method for overlapping detection boxes with the distance-IOU (DIOU) evaluation method and introduced an adjustment parameter for the degree of score suppression. Finally, to enable the backbone feature extraction network to better learn the characteristics of safety hazards and provide rich information for the subsequent detection network, we adopted MobileNetV3 as the feature extraction network for the Mobile-RCNN. The experimental results demonstrated that the proposed model detected densely arranged targets and accurately identified the locations of safety hazards, providing robust technical support for the construction of an intelligent, reliable, and all-weather operation and maintenance system for power systems.
1. Introduction
With the rapid economic development in China during the 21st century, the power industry has sustained steady progress, with grid construction reaching a world-leading standard. Currently, the total transmission line length in China exceeds 1.59 million km 1, making it one of the largest and most structurally complex modern power systems globally. However, this vast transmission network faces multiple safety threats during long-term operation. On the one hand, equipment aging, component failures, and natural disasters such as lightning strikes, icing, and wind deviation are prone to triggering power outages. On the other hand, influenced by frequent extreme weather events and human activities in recent years, the environmental risks surrounding transmission lines have become increasingly prominent. These include overgrown vegetation causing climbing plants to entangle with insulator strings and fittings, accumulated water around tower foundations owing to poor drainage in low-lying terrain, plastic film debris from farmland or domestic waste being carried by wind onto conductors and towers, and visible smoke from wildfires or straw burning. These hazards not only directly damage line structures and degrade electrical insulation performance, inducing flashovers, short circuits, or even wire breakage, but also frequently interfere with the inspection image quality through visual obstruction, thereby increasing the difficulty of defect identification.
Among them, smoke significantly weakens the dielectric strength of the air medium, elevating flashover risks; plastic films in humid environments readily form conductive pathways, causing phase-to-phase short circuits; prolonged water accumulation accelerates foundation corrosion and compromises tower stability; climbing plant entanglement may lead to partial discharges and abnormal mechanical loads and even obstruct operational personnel from properly observing critical components. If these hazards escalate into sudden failures, particularly triggering line trips in key transmission corridors, they can trigger cascading reactions, resulting in regional power outages, industrial production disruptions, and the paralysis of transportation and communication systems, causing severe economic losses and social impacts 2. Therefore, achieving synchronous perception and early warning of both transmission line conditions and the surrounding multi-type safety hazards is of significant strategic importance for safeguarding national energy security and ensuring stable socioeconomic operation.
To address the operational and maintenance challenges of large-scale power grids, the power sector has gradually transitioned from traditional manual inspection to intelligent monitoring. Unmanned aerial vehicle (UAV) inspection technology, leveraging its efficiency, flexibility, and broad coverage, has become a mainstream approach. By deploying UAVs equipped with high-definition optical cameras to capture visible light imagery along transmission lines and combining them with image analysis techniques for automated defect identification, inspection efficiency and safety have been significantly enhanced, particularly in complex terrain regions such as mountains, dense forests, and canyons. However, traditional image processing methods rely on manually designed features (for example, SIFT, HOG, and LBP); they require extensive empirical parameter tuning and exhibit weak generalization capabilities under real-world conditions, such as illumination variations, cluttered backgrounds, and target occlusions, failing to meet the detection demands in complex operational scenarios. Moreover, the existing methods predominantly focus on single tasks (for example, identifying only insulators or detecting only flames) and lack unified modeling and collaborative detection capabilities for both line components and multiple external environmental risks (for example, climbing plants, water accumulation, plastic films, and smoke), thereby limiting their application value in comprehensive risk assessment.
In recent years, breakthroughs in deep learning technologies in the field of computer vision have provided novel solutions for power inspection. Convolutional neural network (CNN)-based object detection models can automatically extract multilevel semantic features and significantly surpass traditional methods in terms of accuracy and robustness. Currently, mainstream architectures are classified into two categories: two-stage detectors (for example, RCNN 3, SPPNet 4, Fast RCNN 5, Faster RCNN 6, and Cascade RCNN 7) that achieve high-precision localization and classification through region proposal mechanisms; one-stage detectors (for example, SSD 8 and YOLO series 9) that employ end-to-end regression strategies, offering faster inference speeds more suitable for real-time inspection scenarios. Nevertheless, object detection in aerial imagery still faces numerous challenges: critical components (for example, insulators, grading rings, and spacer dampers) are small in size, densely arranged, and prone to missed detections; sample quantities vary drastically across categories, resulting in a severe class imbalance; environmental anomaly targets (for example, slender climbing plants, irregularly shaped water accumulation areas, lightweight drifting plastic films, and semi-transparent diffuse smoke) exhibit low contrast, blurred boundaries, and large shape variations, further exacerbating detection difficulties.
To address these issues, this study proposed a high-precision multitask detection framework, Mobile-RCNN, to achieve fine-grained identification of key transmission line components and synchronous perception of typical external safety hazards (including climbing plants, water accumulation, plastic films, and smoke). This method enhanced the dense target detection capabilities while ensuring accurate hazard detection. The experimental results demonstrated the superior performance of the proposed method on a self-constructed multi-hazard dataset for transmission lines, providing robust technical support for building an intelligent, reliable, and all-weather power system operation and maintenance framework.
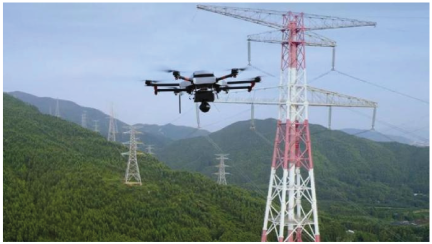
Fig. 1. Drone inspection map.
2. Related Work
Power outages owing to transmission line failures significantly affect industrial and residential power supplies, thereby affecting regional economies and living standards. Inspection technologies have evolved considerably to ensure reliable operation.
In the 1950s, manual periodic inspections were used abroad. By the 1970s, computer and sensor technologies enabled online monitoring, albeit with limited effectiveness. The 1980s witnessed the development of a line inspection robot capable to detect faults and assess surrounding obstacles, marking a breakthrough in automated inspection.
In 1988, a UAV-based inspection navigation system was developed abroad, integrating target tracking, image processing, and GPS for autonomous obstacle avoidance 10. Fig. 1 illustrates this system that offers low-cost high-efficiency inspection with minimal environmental constraints.
In China, research on transmission line inspection began later than abroad. Early attempts in the 1980s to use helicopters were discontinued because of their high costs and economic constraints 11. Recent years have seen extensive adoption of UAVs by utility companies and research institutes. For instance, the ZN-2 unmanned helicopter developed in Shandong in 2012 enabled efficient inspection over long distances, making Shandong the first province to implement regular UAV patrols 12. Systems in Gansu integrate visible, infrared, and ultraviolet imaging for real-time diagnosis. In Jiangxi, UAVs address terrain and climatic challenges, allowing rapid inspection and reporting 13. Promoted by national grid operators, UAVs are currently widely used across varied terrains, significantly improving efficiency and reducing labor.
The inspection focuses on key components—insulators, vibration dampers, spacer bars, and tower marking plates—essential for grid stability. Dampers reduce wind-induced conductor vibrations, marking plates provide identification, and spacer bars prevent conductor clashes. Bird nests on towers may hinder their maintenance. Therefore, an accurate localization of these elements is critical for subsequent fault diagnosis and system reliability 14.
Currently, in research on transmission line target detection based on Faster RCNN, the main issues addressed include missed detection of small targets, low accuracy, missed and false detection of dense and occluded targets, and inaccurate positioning of targets with large aspect ratio differences in UAV transmission line inspections.
(1) Small Targets
Transmission lines feature small targets such as climbing plants and plastic films as well as devices such as spacer rods, shockproof hammers, and tower number plates. These small targets are characterized by indistinct features and small sizes. When detecting them using a Faster RCNN, feature extraction and detection box regression are challenging, leading to missed detections. To enhance small target detection, research has focused on improving feature extraction and optimizing proposal box scales in Faster RCNN. Kong 15 introduced a context information coding network that aggregates multiscale context via dilated convolution and fuses features through deconvolution, thereby boosting detection accuracy. Li et al. 16 added small-scale anchors to the region proposal network (RPN) anchor generator, increasing the number of anchors from 9 to 12 and improving positioning; however, missed detections persisted. Xu 17 applied K-means\(\texttt{++}\) clustering to analyze target scales in training images and derived anchor parameters that better fit small targets, thus enhancing the regression accuracy.
(2) Sample Imbalance
Transmission line devices are unevenly distributed in the field, leading to a significant class imbalance in the number of labels in the collected datasets. The multiscale nature of these devices further complicates detection; smaller devices occupy fewer pixels and appear blurry in high-resolution images, making them more difficult to detect than larger devices. Certain devices also share color and shape features with background structures such as transmission towers, complicating feature learning, whereas other distinct devices are easier to identify, creating an additional imbalance between hard and easy samples. Research specifically addressing sample imbalance in this domain remains limited, with the current work focusing on two main approaches: modifying the loss function of the model and expanding data samples.
To address the class imbalance and inefficient learning of hard samples in insulator defect detection, Zhao et al. 18 proposed a dynamic focal loss and second-moment-based sample balancing method for Faster RCNN. Their approach dynamically adjusted the loss based on the hard/easy sample distribution, identified hard samples through loss discretization, balanced their contribution during backpropagation, and improved the performance on imbalanced datasets. He et al. 19 used a copy-paste data augmentation strategy to address the low sample count of broken insulators, and incorporated focal loss to mitigate hard/easy sample imbalances.
(3) Dense and Occluded Targets
The dense distribution of the transmission line components in the images leads to both dense and occluded targets. The overlapping features and high positional overlap of these targets cause incomplete feature extraction and inaccurate bounding box regression, resulting in missed detections. Research on improving the detection of these targets in Faster RCNN focuses on enhancing the network ability to extract complex features and improving regression positioning. To address the low detection accuracy of occluded and dense targets, Zhao et al. 20 proposed using the Kullback–Leibler (KL) divergence loss for position distribution prediction and incorporated category-specific shape features of hardware targets as constraints into the regression loss function, effectively improving the detection accuracy.
(4) Targets with Large Aspect Ratio Differences
Transmission line components such as insulators and towers often exhibit extreme aspect ratios. Conventional detection models struggle with these targets because their standard anchor boxes adapt poorly to elongated shapes and positional loss characterization becomes inaccurate, leading to suboptimal detection. To enhance the performance of the a Faster RCNN model for these targets, research has focused on improving both the adaptability of the generated boxes and the accuracy of the regression loss.
Prior studies 21,22 modified the allocation and adjustment of detection boxes within Faster RCNN to better recognize extreme-scale targets. From a loss function perspective, one improvement involved replacing the traditional mean squared error loss. Instead, the method calculated the Euclidean distance between center points to determine their intersection over union (IOU) relationship that more effectively ensured the regression accuracy for the targets with large width–height differences.
Furthermore, Dong et al. 23 addressed the issue of large size variation among insulators using a multiscale training strategy. This method randomly resized images while preserving their original aspect ratio, and trained the model on three different scales for the shorter side of the image. Concurrently, the aspect ratios of the candidate boxes were adjusted to match the characteristics of the insulators, ultimately improving the detection accuracy.
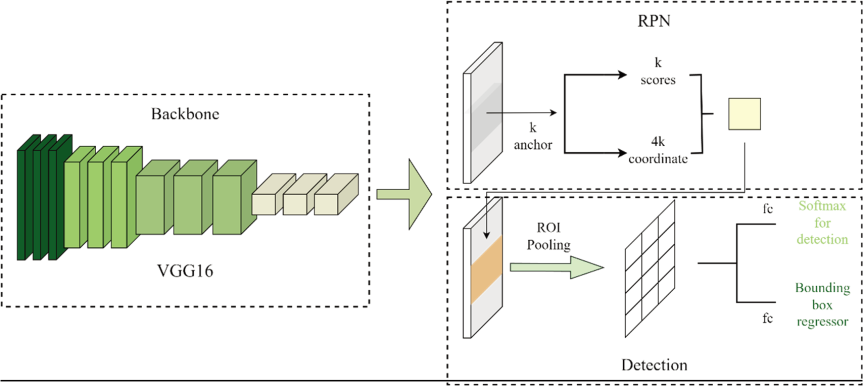
Fig. 2. Faster RCNN overall structure.
At present, in the research on transmission line target detection and surrounding object detection models based on Faster RCNN, relatively few studies exist on dense target detection and sample imbalance problems in the field of transmission line target detection. Moreover, the problems of dense targets and sample imbalance in transmission lines are relatively serious and have a significant impact on the overall detection effect. Moreover, the problem of low detection accuracy for small targets around transmission lines is relatively rare. Therefore, the Mobile-RCNN model proposed in this study mainly addresses the problems of dense target detection, sample imbalance, and scarcity of targets on and around transmission lines.
3. Method
To address the aforementioned limitations, we propose a Mobile-RCNN model. Its architecture evolves from Faster RCNN but incorporates key modifications to enhance the efficiency and accuracy of our specific task.
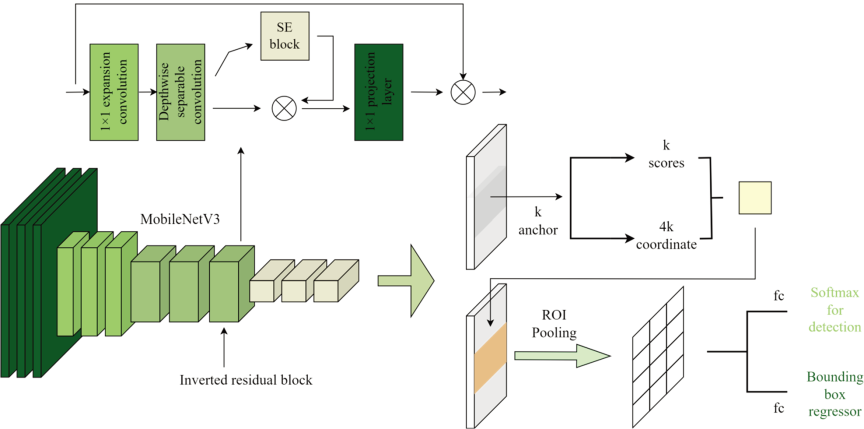
Fig. 3. Structure of the Mobile-RCNN model.
3.1. Faster RCNN Model
Faster RCNN has evolved and improved from RCNN and Fast RCNN, gradually becoming a classic and representative algorithm in the field of target detection. It is also among the most effective target detection algorithms in the RCNN series. In this study, the Faster RCNN algorithm is selected as the original algorithm model to improve transmission line target detection. The structure of a Faster RCNN target detection network is shown in Fig. 2.
The Faster RCNN target detection network comprises mainly three components: a feature extraction network (backbone), RPN module, and detector network module. The RPN module contains three structural parts: an anchor box generator, RPN detection head network, and a region proposal selection. The detector network module comprises three structural parts: region of interest (RoI) pooling, a classification and regression network, and non-maximum suppression (NMS).
The prediction process of Faster RCNN first feeds the transmission line image into the feature extraction network, VGG16, to extract the shared feature map. The VGG16 network contains 16 hidden layers (13 convolutional layers and three fully connected layers), and all the hidden layers of the VGG16 network use a \(3\times 3\) convolution and \(2\times 2\) max pooling.
The design of stacking multiple small convolutional kernels in a VGG network is highly effective. Two \(3\times 3\) convolutional layers in series are equivalent to a \(5\times 5\) convolutional layer, achieving a receptive field of \(5\times 5\). Three \(3\times 3\) convolutional kernels in series are equivalent to a \(7\times 7\) convolutional layer, achieving a receptive field of \(7\times 7\). The three concatenated convolutional layers have fewer parameters than the \(7\times 7\) layer (only 55% of the \(7\times 7\) layer), and undergo more nonlinear transformations.
As the number of layers of the CNN increases, its feature extraction ability gradually becomes stronger. The VGG16 network has a large number of network layers, and its feature extraction ability is strong, making it suitable for the feature extraction of small targets. VGG16 achieves the effect of a large convolutional kernel using multiple small convolutional kernels that increases the receptive field and reduces the number of parameters in the CNN. Networks with large receptive fields are more suitable for detecting and training high-resolution image datasets, whereas networks with fewer parameters are easier to train and more convenient to deploy on mobile devices. In addition, the VGG16 network model increases the input size of the image.
An anchor box generator typically generates 10,000 anchor boxes on a feature map. Through the RPN detection head network, binary classification between targets and backgrounds, as well as regression fine-tuning of the anchor boxes, are performed, generating anchor boxes with target confidence scores. Among these 10,000 anchor boxes, 2,000 region proposals are selected. The RoI pooling layer collects the input feature map and region proposals, integrating this information to obtain feature maps of a fixed size. These feature maps are then fed into subsequent fully connected layers for classification and position regression. The detection feature vectors derived from the fully connected layers are passed through a softmax layer to output the predicted class probabilities. Finally, the NMS post-processing method is employed to manage redundant boxes generated by the model by removing redundant boxes on the same target and yielding the final detection results for the transmission line image.
3.2. Mobile-RCNN Model
In the transmission line object detection task in this study, the Faster RCNN model is capable of identifying dense transmission line targets. However, after NMS removes redundant bounding boxes, certain detection boxes of dense targets are mistakenly removed by the NMS algorithm as redundant boxes, leading to missed detection of dense transmission line targets. Three reasons exist for this situation. 1) The IOU overlap evaluation criterion exhibits poor adaptability and has defects in transmission line object detection tasks with significant differences in length–width scales, requiring the introduction of a new overlap evaluation criterion. 2) The post-processing method has flaws and cannot effectively distinguish between dense target boxes and redundant boxes, necessitating improvements and optimizations in the post-processing method. 3) The VGG16 backbone feature extraction network fails to transmit effective and efficient feature information to the subsequent detection network when extracting features from dense transmission lines, resulting in an insignificant detection performance of the network. The structure of the Mobile-RCNN model is shown in Fig. 3.
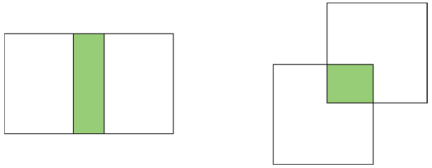
Fig. 4. Detecting different overlapping modes of boxes in the same IOU.
3.2.1. DIOU Method
Because of the deficiencies in the bounding box overlap evaluation approach based on the IOU value, as illustrated in Fig. 4, where two overlapping scenarios with different relative positions exhibit the same IOU value, distinguishing between the pair of boxes that overlaps more severely based solely on the IOU value is impossible. Therefore, this study introduces distance-IOU (DIOU) to replace IOU in evaluating the degree of overlap between detection boxes.
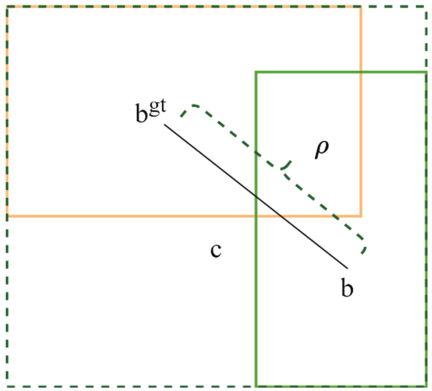
Fig. 5. DIOU calculation diagram.
Based on the IOU overlap evaluation criterion, the DIOU method incorporates the distance between detection boxes and scale factors to evaluate the degree of overlap. This makes overlapping evaluation criteria more reasonable and effective. The calculation formula for DIOU is given by Eq. 1.
DIOU adds distance and scale penalty terms based on IOU. The specific calculation process is illustrated in Fig. 5.
The orange rectangular box represents the ground truth box, green rectangular box represents the predicted box, black rectangular box is the smallest circumscribed rectangle, and penalty term is calculated by dividing the squared distance between the centers of the ground truth and predicted boxes, denoted as \(\rho^2\), by the squared diagonal distance of the smallest circumscribed rectangle, denoted as \(c^2\).
3.2.2. Q-Linear-NMS Post-Processing Method
In the original model, the NMS algorithm retains the detection box with the highest score and considers the detection boxes that overlap significantly with the current detection box as redundant. However, this approach has notable drawbacks in practical detection tasks. For instance, in dense object detection, when two targets of the same category are close to each other, using ordinary NMS may result in one target not being recalled. Soft-NMS 20 was introduced to improve the recall rate of object detection under these circumstances.
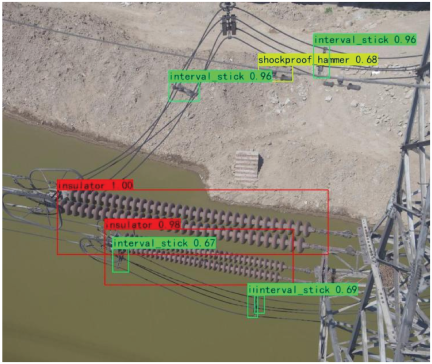
Fig. 6. Post-processing result of linear suppression Soft-NMS redundancy frame not deleted.
NMS adopts a “one-size-fits-all” approach, treating all detection boxes with significant overlap as redundant and deleting them directly. In contrast, Soft-NMS employs a “compromise” strategy. It considers that detection boxes with significant overlap may also contain valid targets; however, the likelihood decreases as the overlap area increases. It applies suppression processing to potentially redundant detection boxes, and determines whether they are redundant based on their scores. Two specific suppression methods are available. One method is the linear suppression (Eq. 2). Detection boxes with an IOU value with box \(M\) less than threshold \(N_t\) retain their scores, whereas those with an IOU value greater than or equal to \(N_t\) have their scores multiplied by a suppression weight to suppress the scores.
The suppression weight is smaller for detection boxes with a larger IOU value with box \(M\), resulting in lower scores after suppression. The other method is the Gaussian suppression (Eq. 3). As noted in 24, the performance difference between the linear and Gaussian methods is often marginal on standard benchmarks, with the linear method being simpler. Our ablation studies on the validation set confirmed this. Linear suppression achieved comparable or slightly better precision by more effectively cleaning the duplicate boxes along the power lines, without introducing additional hyperparameter \(\sigma\) required for Gaussian suppression, thus simplifying the deployment pipeline.
The implementation process of Soft-NMS is similar to that of NMS, except that the operation of deleting the detection boxes is replaced with score suppression for detection boxes.
After introducing the Soft-NMS post-processing method into Faster RCNN, the situation of erroneous deletion of the detection boxes improved. However, cases in which redundant boxes are not deleted still existed, as shown in Fig. 6. Both detection boxes for the two closely positioned insulators are retained. A redundant box exists for the spacer, as shown at the bottom of the figure, that has not been processed.
After extensive experiments, this study sets the IOU threshold for linearly suppressed Soft-NMS to 0.1 and the confidence score screening threshold after suppression to 0.5. Therefore, the IOU value range of the suppressed redundant detection boxes is 0.1–1. Generally, the IOU values of densely arranged targets are distributed within the range of 0.1–0.2; this overlaps with the IOU value distribution range of redundant detection boxes. The confidence scores of redundant boxes are distributed within the range of 0.6–0.8. As shown in Fig. 7, the suppression weight range of the linear suppression method in Soft-NMS for IOU values within 0.1–0.2 is 0.8–0.9, which fails to suppress the scores of potential redundant boxes within the 0.6–0.8 range to below 0.5, and thus cannot completely eliminate the redundant boxes.
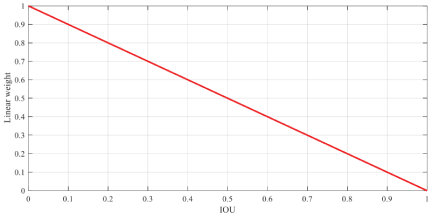
Fig. 7. Linear suppression weight of Soft-NMS and the function diagram of IOU.
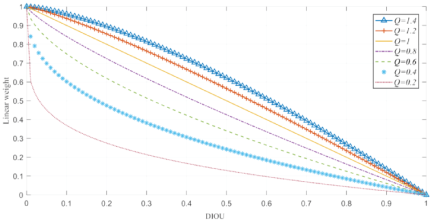
Fig. 8. Relationship between the linear suppression weight and IOU of Soft-NMS with different Q values.
In response to the aforementioned issue of insufficient suppression capability in the Soft-NMS linear suppression algorithm, this study introduces a control coefficient \(Q\) to regulate the magnitude of the suppression weight based on the Soft-NMS linear suppression algorithm and replaces IOU with DIOU as the overlap evaluation criterion. The improved formula for the Soft-NMS linear suppression algorithm is expressed in Eq. 4.
The variation curves of the Soft-NMS linear suppression weight with different control coefficients \(Q\) as a function of the DIOU value are shown in Fig. 8.
When the IOU value is in the range of 0.1–0.2, to suppress redundant boxes with scores in the range of 0.6–0.8 to a score below 0.5, the suppression weight must be less than 0.625. As shown in Fig. 8, control coefficient \(Q\) can regulate the magnitude of the suppression weight. When the value of \(Q\) is less than 0.6, the value of the suppression weight satisfies the requirement. By reasonably selecting the value of \(Q\) within this range, an appropriate suppression weight can be obtained, thereby better handling dense target and redundant boxes.
3.2.3. MobileNetV3 Network
We replace the backbone network in the Faster RCNN framework from VGG16 to MobileNetV3 to leverage its more advanced network architecture and stronger feature extraction capability to enhance the overall performance of object detection. Compared with VGG16, MobileNetV3 is not merely a lightweight model; it also has significant advantages in terms of feature representation capability. VGG16 is based on a traditional stacked convolution structure, lacking explicit modeling of interchannel dependencies, and uses ReLU as the activation function; it suffers from gradient saturation and feature sparsity issues. In contrast, MobileNetV3 incorporates several innovative designs that significantly enhance its feature learning capability. First, its squeeze-and-excitation (SE) module, through global information aggregation and channel attention mechanisms, adaptively calibrates the feature response weights of each channel, enabling the network to focus on more discriminative feature channels and thus improve sensitivity to key target regions. Second, MobileNetV3 uses hard-swish as the activation function. Compared with ReLU, its nonlinear characteristics are smoother, allowing it to retain more subtle positive activation information; this is conducive to gradient propagation and refined expression of deep features. These designs give MobileNetV3 the advantage of extracting multiscale and multilevel features, providing rich and efficient feature information on transmission lines for subsequent detection networks.
4. Experimental Results
This section presents the experimental dataset used and describes the validation of the proposed model. Here, we describe the source, construction, and scale of the dataset. The model was evaluated through ablation studies to verify the efficacy of each module and compared with existing methods using comprehensive benchmarks.
4.1. Experimental Dataset
In object detection tasks, sufficient high-quality image data serve as the foundation for ensuring effective model training. Particularly, to detect densely arranged and minuscule targets in transmission lines, the richness and annotation completeness of the data are critical. Currently, owing to the confidentiality of power data, datasets are not completely publicly available on the Internet. The only publicly available dataset is the insulator detection dataset of the State Grid on GitHub. Although it covers components such as insulator and interval_stick, along with a small number of targets such as shockproof_hammer, tower_number_plate, and bird_nest, only the insulator category includes annotation information; hence, supporting the joint detection of multiclass defects and environmental hazards is difficult.
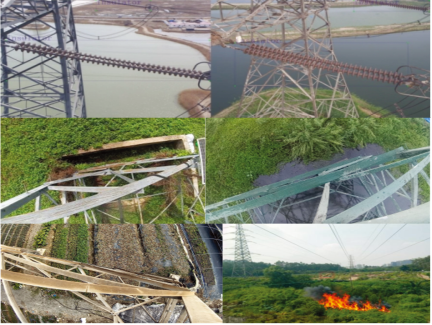
Fig. 9. Partial dataset.
To accurately identify typical external hazards threatening line safety and ensure stable grid operation, we constructed a specialized safety hazard dataset using on-site inspection photography. This dataset focused on four common and high-risk unstructured risks: climbing plants (entangling insulators or fittings), water accumulation (fluid retention around tower foundations), plastic films (foreign objects hanging on wires), and smoke (precursors to fire incidents). All images underwent meticulous manual annotation covering diverse seasonal, lighting, and terrain conditions, thereby exhibiting strong real-world representativeness; partial samples are illustrated in Fig. 9. To facilitate reproduction and comparison, the annotation details of the dataset were clarified. The annotation followed defined rules: all targets, namely climbing plants, water accumulation, plastic films, and smoke, were annotated with horizontal bounding boxes tightly drawn around their visible extent; partially occluded objects were labeled based on the visible portion, whereas densely clustered objects of the same category were annotated as a single instance if the boundaries were indistinguishable. All annotations were manually performed using LabelImg in accordance with the aforementioned rules, and the labels were saved in the VOC format. Finally, our transmission line and safety hazard dataset comprised 1,123 images, each with a size of \(1152\times 864\) pixels. The sample distributions for each category were as follows: insulator detection dataset (400 instances), climbing plants (232 instances), water accumulation (161 instances), plastic films (209 instances), and smoke (121 instances). This dataset effectively filled the gap in the existing labeling of public resource environmental risks and provided reliable data support for the multitask intelligent inspection of transmission lines.
Table 1. Parameter settings for different post-processing methods.
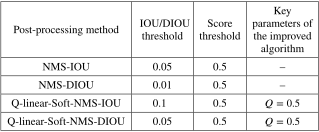
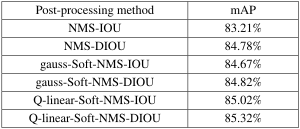
Table 2. Comparison of the results of different detection frame processing methods.
4.2. Experimental Results and Analysis
4.2.1. Comparison of Post-Processing Method Results
This experiment compared the detection results of models using different post-processing methods on the Faster RCNN object detection model with MobileNetV3 as the feature extraction network. NMS-IOU and NMS-DIOU are the NMS algorithms that use IOU and DIOU, respectively, for overlap discrimination. Q-linear-NMS-IOU and Q-linear-NMS-DIOU are linear suppression Soft-NMS algorithms that use IOU and DIOU, respectively, for overlap discrimination and introduce a control coefficient \(Q\). The specific parameter settings for the different post-processing methods are listed in Table 1, and a comparison of the model detection results for the different post-processing methods is presented in Table 2.
Table 2 presents the detection mean average precision (mAP) values of the six post-processing methods on the Faster RCNN model. Among them, the improved Q-linear-NMS-IOU algorithm showed enhanced performance compared with the other algorithms. After introducing DIOU to replace IOU in the Q-linear-NMS-IOU algorithm, the detection performance improved further. A comparison of the detection effects between the improved post-processing algorithm, Q-linear-NMS-DIOU, and the conventional post-processing algorithm, NMS-IOU, is shown in Fig. 10.
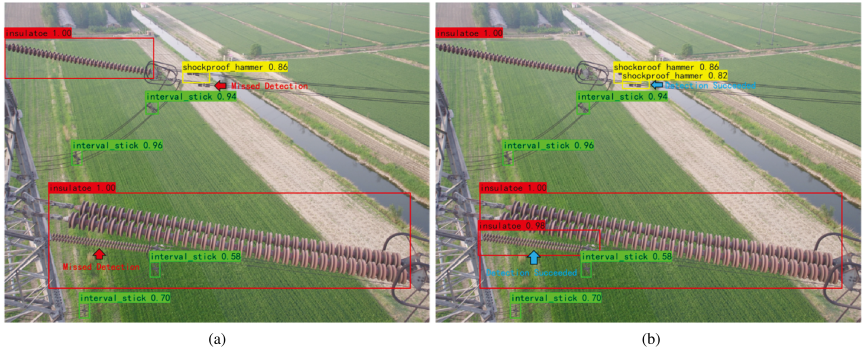
Fig. 10. Comparison of the detection results between NMS-IOU and Q-linear-NMS-DIOU.
When using the NMS-IOU algorithm for post-processing, missed detections of densely arranged insulator targets and densely arranged Stockbridge dampers (a type of anti-vibration device on power lines) occurred, as indicated by the red arrows in Fig. 10(a). When using the proposed Q-linear-NMS-DIOU algorithm for post-processing, both the densely arranged insulator targets and densely arranged spacer targets, as marked by the blue arrows in Fig. 10(b), could be detected. The experimental results demonstrated that the proposed post-processing method alleviated the issue of missed detections of densely arranged targets and improved the detection accuracy.
Table 3. Ablation experiments.
4.2.2. Ablation Experiments
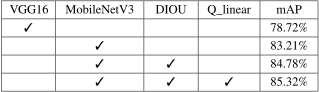
Ablation experiments were conducted to verify the effectiveness of each proposed module. The experimental results are listed in Table 3.
The experimental results indicated that when we replaced the backbone feature extraction network, the mAP increased by 4.49%. When we incorporated the DIOU algorithm, the mAP improved by 1.57%, demonstrating that the DIOU algorithm addressed the issues of poor adaptability and flawed overlap evaluation methods in object detection tasks for transmission line targets with significant differences in length–width scales. When we introduced the Q-linear-NMS-DIOU algorithm, the precision of detecting objects such as transmission lines increased owing to the improvement in the situation of erroneous deletion of detection boxes.
4.2.3. Comparative Experiments
To comprehensively evaluate the performance of the Mobile-RCNN, we compared it with several representative object detection models spanning different categories and generations.
-
1)
Two-stage detector: We included Faster RCNN 6 as a classic and widely applied benchmark.
- 2)
Table 4. Comparative experiments.
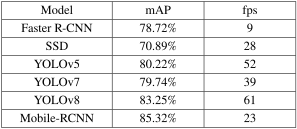
The experimental results are summarized in Table 4. The analysis revealed that the proposed Mobile-RCNN achieved a competitive performance with an mAP close to that of the robust YOLOv8 model 27. This indicated that the proposed Q-linear-NMS-DIOU method combined with the MobileNetV3 backbone constituted an effective approach for transmission line detection tasks. In terms of the real-time capability, the lightweight backbone in the Mobile-RCNN enabled an inference speed of 23 fps that was more than 2.5 times faster than its baseline Faster RCNN (9 fps). Although this frame rate was lower than that of the YOLO series, it sufficiently met the practical requirements for near-real-time processing in drone-based transmission line inspection, where the flight speed and image capture rate are the primary bottlenecks. Our design made a deliberate and justified trade-off, prioritizing the reliability of defect detection—a paramount objective for safety-critical infrastructure inspection—while attaining a viable inference efficiency for field deployment. The visual results are shown in Fig. 11.
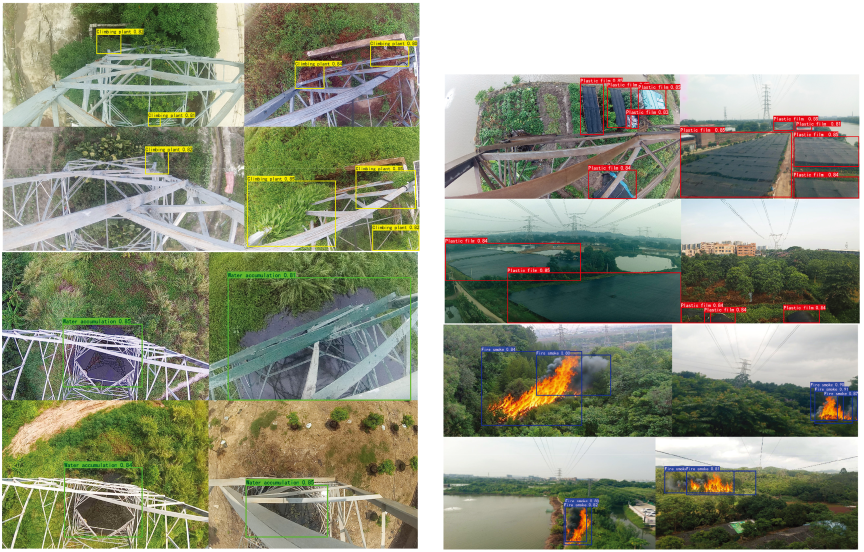
Fig. 11. Detection effect diagram.
5. Limitations and Future Work
Although the proposed method demonstrated an effective performance on the constructed dataset, this study acknowledges certain limitations that indicate valuable future research directions. The most significant limitation is the evaluation under complex real-world operational scenarios. Specifically, the current test set does not fully encompass extreme weather conditions (such as heavy rain or dense fog) or cases of severe structured occlusions. The primary challenge is the practical difficulty and safety concerns associated with systematically collecting and annotating large-scale high-quality image data under controlled adverse conditions in the field. Although the employed data augmentation strategies (for example, photometric variations) enhance generalizability to a certain degree, they serve as proxies and may not fully capture the complex nonlinear degradation of image features caused by real atmospheric particles or heavy precipitation.
To address this gap and further strengthen the robustness of the model for mission-critical deployment, future work should focus on two avenues: 1) exploring collaborative efforts with utility companies to access historical inspection imagery captured during infrequent adverse weather events and 2) investigating advanced physics-based synthetic data generation techniques. Using simulation environments or generative models (for example, diffusion models) to create physically plausible scenarios of fog, rain, and deliberate occlusions presents a promising and scalable pathway to build robust test suites and potentially augment training data, thereby validating and improving the model performance under these challenging yet crucial conditions.
Furthermore, the current study was based solely on visible light imagery. Future research can significantly extend the system capability for all-weather and all-scenario inspection through multimodal data fusion. Two primary directions are promising. 1) Integration of infrared (IR) thermography: IR imaging can effectively detect thermal anomalies (for example, overheated components and faulty insulators) and reveal target contours under low-visibility conditions (for example, night, fog, and haze) where visible light fails. Fusing visible and IR images at the feature or decision level has great potential for developing a robust inspection model that is invariant to lighting conditions. 2) Fusion with LiDAR and other sources: Incorporating 3D point cloud data from light detection and ranging (LiDAR) sensors can complement the rich texture from RGB images. This cross-modal fusion can enable more accurate target localization and identification and support 3D spatial quantification and risk assessment for hazards (for example, vegetation encroachment and clearance violations). This can expand the scope from 2D object detection to a comprehensive 3D situation awareness, providing a more holistic decision-support tool for grid maintenance.
6. Conclusion
With the in-depth advancement of power system intelligence, condition monitoring technologies for transmission lines based on visible-light imagery have been widely adopted. However, practical inspection scenarios still present two major challenges. First, critical components such as insulators and spacer dampers are often distributed in dense and minuscule configurations, leading traditional detection methods to frequently miss detections owing to insufficient feature representation capabilities. Second, the surrounding environment of transmission corridors is highly complex, with frequent occurrences of safety hazards such as climbing plants, water accumulation, plastic films, and smoke. These hazards degrade the equipment insulation performance and trigger severe faults such as short circuits or even wire breakages. To achieve a collaborative perception of both line infrastructure and environmental risks, this study constructed a field-measured image dataset encompassing the aforementioned four typical safety hazards and proposed a high-precision detection framework called Mobile-RCNN. This framework employed MobileNetV3 as the feature extraction network to enhance the hazard representation capabilities. To address the overlapping and missed detection issues in dense target detection, a Q-linear-NMS-DIOU post-processing method was designed that improved the bounding box localization accuracy and filtering rationality by introducing suppression coefficients. Through ablation and comparative experiments, the effectiveness of the proposed modules and model in the dual tasks of critical component identification and safety hazard detection was validated, significantly enhancing the overall detection performance and providing robust technical support for the reliable operation of intelligent transmission line inspection systems.
Acknowledgments
China Southern Power Grid Technology Project Funding [Project Number: GDKJXM20240649].
- [1] S. Yu, S. Zhou, and J. Qin, “Layout optimization of China’s power transmission lines for renewable power integration considering flexible resources and grid stability,” Int. J. of Electrical Power and Energy Systems, Vol.135, Article No.107507, 2022. https://doi.org/10.1016/j.ijepes.2021.107507
- [2] “DTE energy highlights accelerating its investments to build a smarter grid,” Food and Beverage Close-Up, 2025.
- [3] R. Girshick, J. Donahue, T. Darrell et al., “Rich feature hierarchies for accurate object detection and semantic segmentation,” Proc. of the IEEE Conf. on Computer Vision and Pattern Recognition, pp. 580-587, 2014. https://doi.org/10.1109/CVPR.2014.81
- [4] K. He, X. Zhang, S. Ren et al., “Spatial pyramid pooling in deep convolutional networks for visual recognition,” IEEE Trans. on Pattern Analysis and Machine Intelligence, Vol.37, No.9, pp. 1904-1916, 2015. https://doi.org/10.1109/TPAMI.2015.2389824
- [5] R. Girshick “Fast R-CNN,” Proc. of the IEEE Int. Conf. on Computer Vision, pp. 1440-1448, 2015. https://doi.org/10.1109/ICCV.2015.169
- [6] S. Ren, K. He, R. Girshick et al., “Faster R-CNN: Towards real-time object detection with region proposal networks,” IEEE Trans. on Pattern Analysis and Machine Intelligence, Vol.39, No.6, pp. 1137-1149, 2017. https://doi.org/10.1109/TPAMI.2016.2577031
- [7] Z. Cai and N. Vasconcelos, “Cascade R-CNN: Delving into high quality object detection,” Proc. of the IEEE Conf. on Computer Vision and Pattern Recognition, pp. 6154-6162, 2018. https://doi.org/10.1109/CVPR.2018.00644
- [8] W. Liu, D. Anguelov, D. Erhan et al., “SSD: Single shot multibox detector,” 14th European Conf. on Computer Vision (ECCV 2016), pp. 21-37, 2016. https://doi.org/10.1007/978-3-319-46448-0_2
- [9] J. Redmon, S. Divvala, R. Girshick et al., “You only look once: Unified, real-time object detection,” Proc. of the IEEE Conf. on Computer Vision and Pattern Recognition, pp. 779-788, 2016. https://doi.org/10.1109/CVPR.2016.91
- [10] L. Mejias, J. F. Correa, I. Mondragón et al., “COLIBRI: A vision-guided UAV for surveillance and visual inspection,” Proc. 2007 IEEE Int. Conf. on Robotics and Automation, pp. 2760-2761, 2007. https://doi.org/10.1109/ROBOT.2007.363883
- [11] C. Li, C. Wang, Y. Zhao et al., “Investigation into in situ computed tomography inspection technology for conductor connection structure of ultra-high voltage gas-insulated transmission lines,” Russian J. of Nondestructive Testing, Vol.61, No.3, pp. 353-365, 2025. https://doi.org/10.1134/S1061830925600133
- [12] C. Shen, N. Chen, R. Tan et al., “Modeling and stability analysis of coarse – Fine composite mechatronic system in UAV multi-gimbal electro-optical pod,” Electronics, Vol.9, No.5, Article No.769, 2020. https://doi.org/10.3390/electronics9050769
- [13] S. Zeng, J. Jia, T. Ma et al., “Application of AI Image Recognition in the Omnidirectional Monitoring System for Power Transmission Lines,” Advances in Multimedia, Vol.2023, Article No.9898403, 2021. https://doi.org/10.1155/2023/9898403
- [14] H. Ni, M. Wang, and L. Zhao, “An improved faster R-CNN for defect recognition of key components of transmission line,” Mathematical Biosciences and Engineering, Vol.18, No.4, pp. 4679-4695, 2021. https://doi.org/10.3934/mbe.2021237
- [15] L. Kong, “Research on Small Target Detection Algorithm for Transmission Lines Based on Convolutional Neural Network,” Master’s theses, Huazhong University of Science and Technology, 2019 (in Chinese).
- [16] L. Hui, D. Yan, and L. Xiang, “Abnormal target detection method of transmission line based on two-stage deep network," Control Decis, Vol.37, pp. 1873-1882, 2022.
- [17] Y. Xu, “Research on detection method of transmission line fittings based on knowledge reasoning,” Master’s theses, North China Electric Power University, 2024 (in Chinese).
- [18] Z. Zhao, Y. Li, Y. Qi et al., “Insulator defect detection method based on dynamic focus loss function and sample balance method," Electric Power Automation Equipment, Vol.40, No.10, pp. 205-211, 2020 (in Chinese). https://doi.org/10.16081/j.epae.202010008
- [19] W. He, J. Li, and W. Zhao, “Insulator anomaly detection based on improved faster RCNN,” Zhejiang Electric Power, Vol.40, No.8, pp. 40-46, 2021 (in Chinese). https://doi.org/10.19585/j.zjdl.202108006
- [20] Z. Zhao, Y. Li, Z. Zhen et al., “Typical fittings detection method with faster R-CNN combining KL divergence and shape constraints,” High Voltage Technology, Vol.46, No.9, pp. 3018-3026, 2020. https://doi.org/10.13336/j.1003-6520.hve.20200507023
- [21] H. Hu, Y. Liu, and H. Rong, “Detection of insulators on power transmission line based on an improved faster region-convolutional neural network,” Algorithms, Vol.15, Issue 3, Article No.83, 2022. https://doi.org/10.3390/a15030083
- [22] J. Ou, J. Wang, J. Xue et al., “Infrared image target detection of substation electrical equipment using an improved faster R-CNN,” IEEE Trans. on Power Delivery, Vol.38, No.1, pp. 387-396, 2023. https://doi.org/10.1109/TPWRD.2022.3191694
- [23] C. Dong, K. Zhang, Z. Xie et al., “An improved cascade RCNN detection method for key components and defects of transmission lines,” IET Generation, Transmission & Distribution, Vol.17, No.19, pp. 4277-4292, 2023. https://doi.org/10.1049/gtd2.12948
- [24] N. Bodla, B. Singh, R. Chellappa, and L. S. Davis, “Soft-NMS—Improving object detection with one line of code,” Proc. of the IEEE Int. Conf. on Computer Vision, pp. 5561-5569, 2017. https://doi.org/10.1109/ICCV.2017.593
- [25] Q. Wang, Z. Zhang, Q. Chen et al., “Lightweight transmission line fault detection method based on leaner YOLOv7-tiny,” Sensors, Vol.24, No.2, Article No.565, 2024. https://doi.org/10.3390/s24020565
- [26] C.-Y. Wang, A. Bochkovskiy, and H.-Y. M. Liao, “YOLOv7: Trainable bag-of-freebies sets new state-of-the-art for real-time object detectors,” Proc. of the IEEE/CVF Conf. on Computer Vision and Pattern Recognition, pp. 7464-7475, 2023. https://doi.org/10.1109/CVPR52729.2023.00721
- [27] Z.-y. Xu and X. Tang, “Transmission line insulator defect detection algorithm based on MAP-YOLOv8,” Scientific Reports, Vol.15, No.1, Article No.10288, 2025. https://doi.org/10.1038/s41598-025-92445-3
This article is published under a Creative Commons Attribution-NoDerivatives 4.0 Internationa License.