Research Paper:
Measuring and Characterizing Global Value Chain Resilience in Chinese Industries: Trend Analysis and Intelligent Clustering
Linhui Zhao*
 , Yanfang Lyu**,†, and Dong Wang***
*Institute of Quantitative Economics and Statistics, Huaqiao University
No.668 Jimei Avenue, Jimei District, Xiamen, Fujian 361021, China
**School of Economics, Guangdong University of Technology
No.161 Yinglong Road, Tianhe District, Guangzhou, Guangdong 510520, China
†Corresponding author
***School of Business, Minnan Normal University
No.36 Xianqianzhi Street, Xiangcheng District, Zhangzhou, Fujian 363000, China

Against rising global uncertainty, understanding the evolution and structural patterns of global value chain (GVC) resilience is crucial for sustaining stable international production networks. However, existing research often relies on single-indicator or linear measurement approaches that are insufficient to capture the multidimensional and heterogeneous nature of GVC resilience. To address this gap, this study develops a comprehensive GVC resilience framework encompassing resistance, adjustment, and transformative dimensions. Using the OECD inter-country input-output data, we measure the resilience levels of 42 Chinese industries. Feature vectors capturing each industry’s long-term resilience profile of each industry are constructed, and three intelligent clustering algorithms—K-means++, Gaussian mixture model, and spectral clustering—are applied to identify latent grouping structures. The empirical results showed that (1) the evolution of GVC resilience displayed substantial heterogeneity across industries; (2) China exhibited relatively strong resilience in 2000, 2001, 2009, and 2020, but weaker performance in 2004, 2012, and 2017; (3) the integrated clustering outcomes classified industries into three groups—high resilience and low volatility, low resilience and high volatility, and medium resilience and declining trend.
Clustering of GVC resilience in China
1. Introduction
Global value chains (GVCs) contribute to optimizing resource allocation, enhancing production efficiency, and fostering international economic growth. However, they also generate potential risks through complex transmission, interconnection, and accumulation across internal and external channels. In recent years, uncertainties in the global economy have markedly increased, with frequent shocks stemming from geopolitical frictions, trade disputes, extreme climate events, global public health crises, and disruptive technological transformations 1,2. These shocks directly or indirectly disrupt the secure and stable functioning of international trade networks, rendering the spatial and geographical configurations of GVCs increasingly vulnerable 3.
As a critical perspective for understanding value chain operations, GVC resilience has become a central topic in this field. Since the emergence of the “trade in value-added” concept, research on the driving forces, accounting frameworks, and structural mechanisms of the GVC system has remained at the core of academic inquiry 4,5. Against the backdrop of growing chain vulnerabilities, embracing the notion of “antifragility” to transform external pressures into opportunities for improvement—and re-examining the formation and mechanisms of GVC resilience—has emerged as an urgent frontier issue for both academia and industry 2,6.
Existing research provided valuable insights into GVC resilience. Academic literature actively explored the concept of GVC resilience that inherited the core elements of economic resilience while exhibiting distinct characteristics. Martin 7 defined resilience as the capacity of a system to absorb, mitigate, and withstand shocks to maintain normal functioning. With growing disruptions, Baldwin et al. highlighted that resilience increasingly depended on the ability to promptly adapt and rapidly recover after crises 8, making adjustment capability central to assessing system flexibility. Building on these dimensions, Statsenko et al. further argued that absorptive resistance and adaptive recovery jointly constituted the essence of economic resilience 9. However, this traditional framing mainly stressed shock resistance and short-term recovery while overlooking long-term structural impacts. Thus, Trippl et al. adopted a sustainable development perspective, viewing crises as “windows of opportunity” for transformation and emphasizing the catalytic role of transformative capability and structural change in fostering long-term resilience 10.
Building on the clarified conceptual foundations of GVC resilience, existing studies explored its measurement. Specifically, the current study mainly assessed resilience from the perspectives of the stability, security, and continuity of participation in GVC activities. For example, Schwellnus et al. 11 measured GVC resilience using the actual output fluctuations of firms based on the assumption that dependence on external inputs significantly affected domestic output. Yang and Zheng 12 evaluated GVC resilience from the dual dimensions of stability and security, using production volatility and value chain length gaps, respectively. On this basis, Shen and Hao 13 proposed a “stabilizing strengthening extending chain” framework, emphasizing that the dynamic extensibility of GVCs was central to resilience construction and further measured resilience using the duration of the engagement of participants in GVC activities.
This study constructed a comprehensive GVC resilience measurement framework covering resistance, adjustment, and transformative resilience. Using a dual-combination weighting approach and the 2023 OECD inter-country input-output (ICIO) tables, the GVC resilience levels of Chinese industries were quantified. Following the widely used industrial classification schemes in the existing literature, the industries were grouped into six structural categories to examine their respective resilience trajectories. The overall evolution of GVC resilience across industries was also analyzed over different periods. Finally, based on the mean, variance, and long-term trends of the annual resilience series, the feature vectors of industry-level GVC resilience were constructed. Three intelligent clustering methods—K-means\(\texttt{++}\), Gaussian mixture model (GMM), and spectral clustering—were then applied to reveal the latent grouping structure of GVC resilience and derive a typological classification framework.
This study makes three main contributions. First, it constructed a comprehensive measurement system for GVC resilience by integrating resistance, adjustment, and transformative dimensions and conducted a quantitative evaluation and trend analysis across Chinese industries. This multidimensional framework advanced the existing GVC research by moving beyond single-indicator or linear evaluation approaches and providing a more systematic basis for resilience assessment.
Second, leveraging the multidimensional characteristics of industry-level GVC resilience, this study developed an intelligent clustering framework tailored to structurally heterogeneous industrial systems. By combining distance-based (K-means\(\texttt{++}\)), probabilistic (GMM), and graph-based (spectral clustering) machine learning paradigms, the framework captured structural heterogeneity from complementary perspectives and mitigated the inherent limitations of any single clustering method related to shape assumptions, distributional constraints, or non-convex boundaries.
Third, this study uncovered the implicit grouping mechanisms underlying industry-level GVC resilience. The consistency of cluster sizes and feature patterns across the different methods demonstrated stable structural differences among industries, and the identified resilience profiles revealed systematic variations in structural robustness, long-term improvement trajectories, and sensitivity to external shocks. These insights provided a strong analytical foundation for formulating differentiated and targeted GVC governance strategies.
2. GVC Resilience Measurement Methods
2.1. GVC Resilience Index System
Table 1. GVC resilience index.

Building on the preceding discussion, this study defines GVC resilience as the capacity of a value chain system to withstand disruptions, maintain stable functioning under external shocks, rapidly adjust and restore operations after interruptions, and achieve structural transformation and generative upgrades beyond its original development level. Accordingly, GVC resilience is conceptualized along three dimensions: resistance, adjustment, and transformative.
Based on this definition, this study constructs an industry-level GVC resilience indicator system aligned with these three dimensions and employs a dual-combination weighting method to measure the resilience performance of each industry.
The measurement procedure comprises three steps: selecting sub-indicators, computing indicator values, and determining indicator weights. The sub-indicators used to measure GVC resilience are presented in Table 1, and the rationale for indicator selection and the specific measurement methods are elaborated in subsequent sections.
2.2. Calculation Method of GVC Resilience Sub-Indicator
2.2.1. Resistance Resilience Measurement
Continuous production and supply are key features of GVCs 14, and their stability reflects the ability of a system to withstand shocks. Production length measures the extensiveness and complexity of products along GVCs, and its volatility indicates the stability of supply and production processes. Based on the research by Wang et al. 15, this study uses the volatility of forward and backward production lengths to measure resistance elasticity. Based on the economic volatility measurement method proposed by John et al. 16, the forward and backward average production length volatilities are calculated as follows:
2.2.2. Adjustment Resilience Measurement
Based on the “pass-through frequency” indicator proposed by Inomata and Hanaka 17 that captures the structural features of global production chains, and following the logic of the Herfindahl–Hirschman index (HHI), this study measures the concentration level of industry \(i\) in year \(t\), denoted as \(\textit{Concen}_{\textit{it}}\). This indicator reflects the degree of global network activity in an industry. A higher value implies lower activity and thus weaker adjustment resilience in the GVC. The measurement process consists of the following three steps.
First, we construct a pass-through frequency matrix for each country–industry pair. In the input–output model of country \(C\) and sector \(I\) in year \(t\), we compute the pass-through frequency of each industry \(i\) in each country \(c\) along the production chains from any sector \(m\) to sector \(n\). The calculation method is as follows:
Second, we calculate the global pass-through frequency of each industry by summing its pass-through frequency matrices across countries. The calculation method is as follows:
Finally, we compute the global supply concentration of each industry. The calculation follows the HHI, and the global supply concentration is given by:
2.2.3. Transformative Resilience Measurement
Export domestic value-added reflects the proportion of domestic production factors in the exported products of a country for a particular industry 18. A higher proportion indicates that the industry in that country participates more in high-value-added segments such as R&D and design within the GVC and thus has a stronger ability to create and acquire high value-added.
Therefore, this study uses the export domestic value-added growth rate to characterize the resilience of various industries to GVC changes. The formula for calculating the export domestic value-added growth rate of industry \(i\) in year \(t\) is given by:
2.3. Weighted Methodology for GVC Resilience Indicators
Most existing studies determine indicator weights using the entropy weight method that primarily captures within-group information differences of individual indicators. To incorporate information heterogeneity across indicators, this study introduces an inter-indicator distance measure and proposes a dual-source weighting approach that simultaneously accounts for both between-group and within-group information differences. The computation consists of four steps.
First, all the indicators presented in Table 1 are normalized using the min–max method. Let \(Z_{ijt}\) denote the standardized value of indicator \(j\) for industry \(i\) in year \(t\).
Second, the Euclidean distance is used to capture information differences across indicators. A larger distance \(D(j_l,j_s)_t\) indicates greater informational distinctiveness and yields a higher between-indicator weight.
Third, within-indicator weights are obtained using the entropy method. Industry shares and entropy values are computed as follows:
Thus, the within-indicator weight is given by:
Finally, final weights assume equal contributions of between indicator and within indicator information.
The GVC resilience index is computed as follows:
A higher \(\textit{GVC}\_\textit{Res}\) value indicates stronger GVC resilience for industry \(i\) in year \(t\).
3. Analysis of the Evolution Trend of GVC Resilience
3.1. Dynamic Evolution Characteristics of GVC Resilience Across Industries
Based on the previously developed GVC resilience measurement framework, this study employs the 2023 OECD ICIO to evaluate industry-level resilience indicators. After applying the weighting procedure, the GVC resilience levels of 42 Chinese industries are obtained. The industries are organized into meaningful categories for subsequent trend analysis to facilitate comparisons and reveal heterogeneous evolutionary patterns.
Specifically, drawing on the High-Tech Industry (Manufacturing) Classification (2018) and the Statistical Classification of Producer Services (2019) issued by the National Bureau of Statistics of China as well as the industrial classification principles of Jiang et al. 19 and Ji et al. 20, the 42 industries are grouped into six categories. The detailed classification is presented in Table 2.
3.1.1. Resource-Intensive Industries: GVC Resilience Analysis
Figure 1 illustrates the trends in GVC resilience in resource-intensive industries. From 2000 to 2020, resilience levels widely fluctuated between 0.25 and 0.90, indicating high exposure to external shocks and risk factors that weakened the resistance, adaptability, and transformative resilience of these industries.
The non-energy mining sector (B07T08), energy extraction (B05T06), and electricity, heat, and gas supply (D) exhibited volatile downward trends, with energy extraction showing the lowest resilience. This decline was largely driven by global low-carbon and sustainability transitions that imposed substantial adjustment pressures on traditional energy sectors. Investments in green technologies and carbon taxation increased production costs, reduced recovery capacity, and consequently lowered GVC resilience.
Table 2. Industry classification based on sectoral attributes and economic activity characteristics.

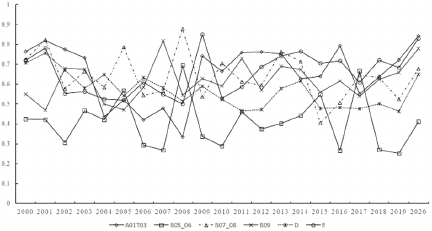
Fig. 1. Trends in the GVC resilience of resource-intensive industries.
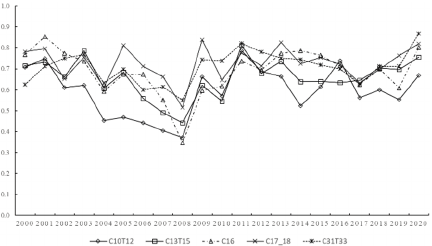
Fig. 2. Trends in the GVC resilience of low-technology manufacturing industries.
In contrast, agriculture, forestry, animal husbandry, and fishery (A01T03) and water supply and wastewater treatment (E) maintained relatively stable resilience levels, reflecting strong domestic demand and lower susceptibility to external disturbances. Mining support services (B09) showed an upward fluctuating trend. The expansion of outsourcing in resource extraction services enhanced specialization, improved operational efficiency, and lowered production costs, thereby strengthening the resistance, adaptability, and transformative resilience of the enterprises in these auxiliary sectors.
3.1.2. Low-Technology Manufacturing: GVC Resilience Analysis
Figure 2 illustrates the evolution of GVC resilience in low-technology manufacturing. From 2000 to 2020, resilience ranged between 0.35 and 0.90 and showed clear intra-group co-movement. Overall, most industries exhibited a declining trend before 2008, followed by a steady upward trend from 2008 to 2020.
The 2008 global financial crisis reshaped the international production system, and the GVC participation of China gradually shifted from an international-cycle-dominant pattern to a model with a stronger domestic cycle 21. The resilience pattern of low-technology manufacturing reflected this transition. Under the international-cycle-dominant regime, excessive dependence on external demand weakened GVC resilience. By contrast, under the dual-circulation paradigm, the strengthening of domestic circulation provided stronger support for resilience, enabling firms in this sector to develop a resilience mechanism increasingly driven by domestic demand.
3.1.3. Medium-Technology Manufacturing: GVC Resilience Analysis
Figure 3 illustrates the evolution of GVC resilience in medium-technology manufacturing. From 2000 to 2020, resilience fluctuated between 0.40 and 0.90 and remained consistently higher than that of low-technology manufacturing. This indicated stronger technological absorption and transformation capabilities in this sector that facilitated learning-driven upgrading and consequently higher GVC resilience.
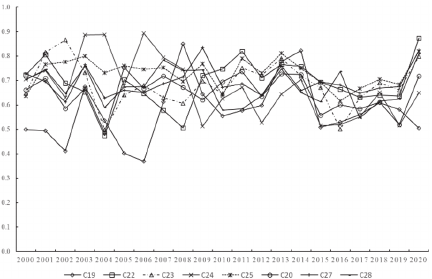
Fig. 3. Trends in the GVC resilience of medium-technology manufacturing industries.
Before 2008, resilience in medium-technology industries showed pronounced volatility, reflecting weak value chain stability under a participation pattern dominated by the international cycle in which industries relied heavily on external markets and resource inputs. Between 2008 and 2014, resilience became relatively stable, suggesting that under the dual-circulation regime, expanding domestic demand enhanced the resistance, recovery, and adaptive capacities of medium-technology manufacturing within the GVC system.
However, from 2014 to 2018, the overall GVC resilience of medium-technology manufacturing showed a volatile downward trend. This decline might be attributed to domestic overcapacity and deleveraging policies that imposed operational pressures on firms during the strengthening of domestic circulation 21. These pressures weakened the resistance and adaptive capacity of the sectors within the GVC system.
After 2018, resilience rose sharply across industries, indicating that following an adjustment period, medium-technology manufacturing experienced reduced supply chain risk exposure, and supply chain digitalization and localization measures effectively enhanced its risk-mitigation capacity in the GVC system.
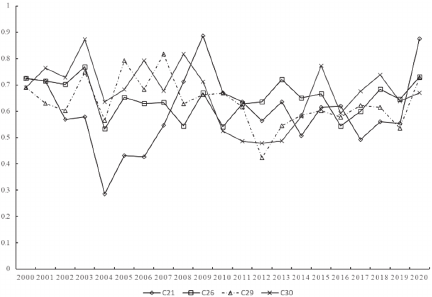
Fig. 4. Trends in the GVC resilience of high-technology manufacturing industries.
3.1.4. High-Technology Manufacturing: GVC Resilience Analysis
Figure 4 illustrates the evolution of GVC resilience in high-technology manufacturing. Except for the pharmaceutical industry (C21), resilience levels fluctuated between 0.45 and 0.9 during 2000–2020 and remained consistently higher than those of medium- and low-technology manufacturing. This indicated that high-technology industries possessed stronger innovation and iteration capabilities 22, enabling them to enhance their competitiveness in the global production system through technology absorption and thus maintain higher GVC resilience.
For the pharmaceutical industry (C21), resilience dropped sharply from 2000 to 2004, reflecting weak domestic technological innovation capability and a highly concentrated global competitive structure that placed the industry in a vulnerable position. From 2004 to 2009, resilience rose rapidly, likely driven by the learning effects following the WTO accession of China, that improved its resistance and recovery capacity. Other high-technology industries showed only mild fluctuations during this period, indicating their relative stability.
Between 2009 and 2015, GVC resilience generally declined across high-technology manufacturing, largely owing to shrinking external demand and intensified trade frictions after the global financial crisis. At that time, China had not yet mastered critical core technologies and remained in a non-core position within the global production network, facing multiple domestic and international risks. After 2015, resilience shifted to a steadily rising trend, suggesting that the growing adoption of digital and intelligent technologies enabled high-technology manufacturing to reduce supply chain risks through digital transformation, thereby enhancing its resistance and recovery capacity in the GVC system.
3.1.5. Producer Services: GVC Resilience Analysis
Figure 5 illustrates the evolution of GVC resilience in producer services. Except for water transport (H50) and real estate (L), the resilience levels of producer services fluctuated between 0.45 and 1.0 during 2000–2020 and remained significantly higher than those of other industry categories. This was closely related to their higher knowledge, technological intensity, and stronger specialization 23. Notably, substantial within-group heterogeneity existed, indicating a clear industry differentiation.
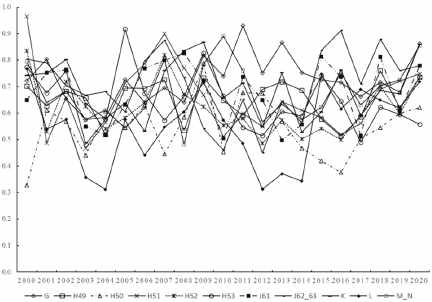
Fig. 5. Trends in the GVC resilience of producer services industries.
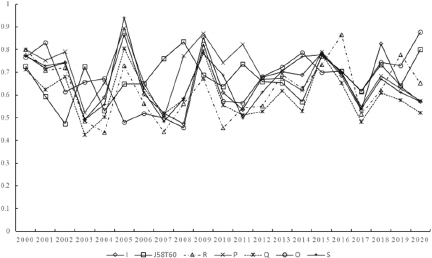
Fig. 6. Trends in the GVC resilience of consumer services industries.
From 2000 to 2004, resilience declined overall, likely because producer services were still in an early development stage, with limited openness and a relatively weak information infrastructure. These constraints reduced their embeddedness in the global production network and exposed their vulnerabilities in the initial phase. After 2004, the wholesale and retail trade and the repair of motor vehicles and motorcycles (G) showed a fluctuating upward trend. This reflected the expansion of service outsourcing and rising global demand that strengthened their market scale and enhanced their adaptive capacity against external shocks. By contrast, real estate (L) and water transport (H50) exhibited the most volatile resilience patterns, largely because of their strong dependence on economic cycles and international trade conditions. Other producer services maintained relatively stable resilience levels, suggesting a certain degree of risk resistance and recovery capability within the GVC system.
3.1.6. Consumer Services: GVC Resilience Analysis
Figure 6 illustrates the evolution of GVC resilience in consumer services. According to Fig. 6, the GVC resilience of these industries exhibited a generally consistent and stable pattern during 2000–2020, fluctuating within a range of approximately 0.4–0.9.
From 2000 to 2004, 2005 to 2008, 2009 to 2011, and 2015 to 2017, the overall GVC resilience of the life-oriented service industries exhibited a fluctuating but downward trend. This pattern suggested that, amid accelerated globalization, the inherently low tradability and slow productivity growth of these industries weakened their ability to recover and adjust when confronted with global shocks. Consequently, the non-tradable sector did not fully benefit from the efficiency gains of global production networks, thus limiting its capacity to adapt to external disturbances.
After 2019, however, a noticeable divergence appeared within this sector. The GVC resilience of accommodation and food services (I) and publishing, audiovisual, and broadcasting activities (J58T60) increased, whereas that of other life-oriented services continued to decline. This divergence mainly reflected the differences in digital transformation across industries. Sectors such as publishing, film, and broadcasting were early adopters of digitalization and platform-based content delivery, enabling them to exploit online dissemination channels to stimulate demand spillovers and market restructuring 24. Consequently, their resistance, adjustment, and transformation resilience within the GVC system improved.
By contrast, industries such as education, health, and social work still heavily relied on face-to-face service provision, with high adjustment costs and limited substitutability. Their declining resilience illustrated the manner in which an uneven adaptation to emerging digital technologies constrained the enhancement of GVC resilience.
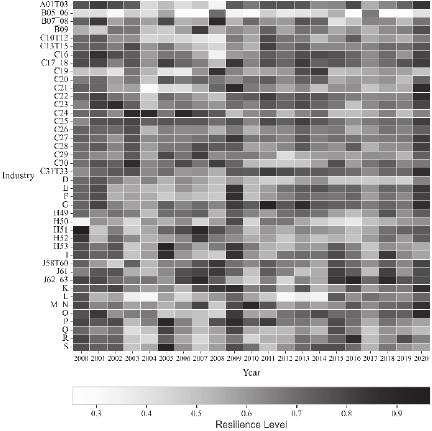
Fig. 7. Visualization of the overall GVC resilience level.
3.2. Overall Distribution Pattern of GVC Resilience
To depict the evolution of interindustry GVC resilience, Fig. 7 presents a heatmap of 42 Chinese industries from 2000 to 2020. Overall, China showed relatively high GVC resilience in 2000, 2001, 2009, and 2020, indicating a stronger recovery capacity after external shocks.
During 2000–2001, the WTO accession of China improved policy stability, and low factor costs facilitated its rapid integration into global production networks, supporting higher resilience. Although most industries were positioned in the lower segments of the GVCs, their diversified export markets made risk exposure manageable.
In 2009, post-crisis adjustments, such as increased domestic value chain length and reduced external exposure, were combined with domestic demand expansion to enhance resilience. In 2020, the post-COVID-19 recovery measures stabilized supply chains and restored exports, thereby strengthening GVC resilience.
Lower resilience levels mainly appeared in 2004, 2012, and 2017. In 2004, intensified external competition after the early phase of low-end capacity expansion weakened industry-level stability. In 2012, deleveraging and declining global demand increased business pressure and reduced competitiveness within GVCs. In 2017, supply side structural reforms, including capacity and inventory reductions, generated short-term shocks in traditional sectors and lowered resilience.
4. Intelligent Clustering and Typology Identification of GVC Resilience
4.1. Visualization of Clustering Results
Clustering analysis has been widely employed to uncover latent structural patterns and classify groups with distinct characteristics 25. Based on the annual mean, standard deviation, and long-term trend of GVC resilience, this study applied the following three representative intelligent clustering methods to classify 42 industries.
-
(1)
K-means\(\texttt{++}\): A distance-based machine learning algorithm that enhances clustering stability and convergence efficiency through an improved initialization strategy 26.
-
(2)
GMM: A probabilistic clustering approach that performs soft assignments and flexibly captures multimodal and heterogeneous distributional characteristics of industry resilience 27.
-
(3)
Spectral clustering: A graph-based intelligent clustering technique that leverages graph representation and eigen decomposition to detect nonlinear structures and complex cluster boundaries 28.
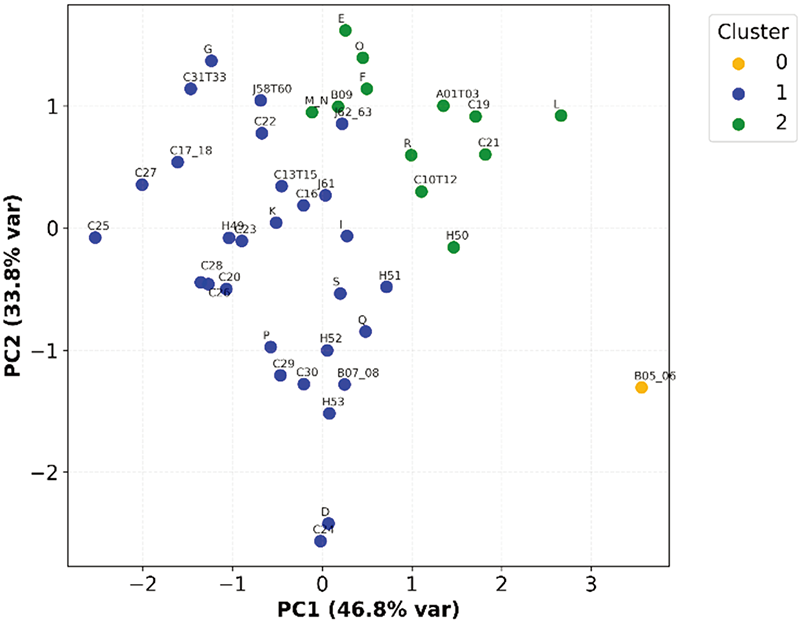
These three methods were selected because they represented the major paradigms of distance-based, probabilistic, and graph-based intelligent clustering, respectively. Their complementary perspectives enabled a more robust and interpretable characterization of structural heterogeneity in industry resilience. Figs. 8–10 show the visualization results of the three clustering algorithms.
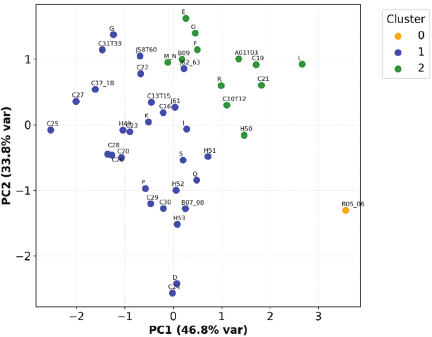
Fig. 8. GMM clustering results.
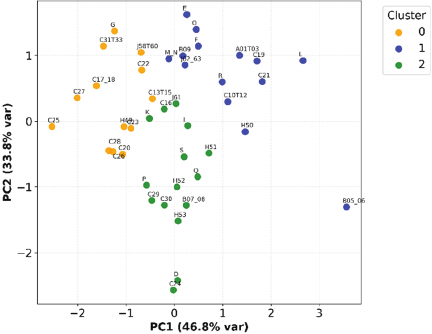
Fig. 9. K-means\(\texttt{++}\) clustering results.
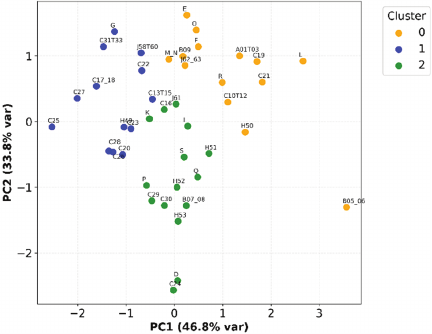
Fig. 10. Spectral clustering results.
All the three methods revealed clear cluster structures in the feature space. K-means\(\texttt{++}\) and spectral clustering exhibited highly consistent cluster boundaries, reflecting the stable relative positions of industries in the three-dimensional feature space. By contrast, the GMM captured distributional heterogeneity more effectively and assigned industries with distinctive resilience characteristics to separate clusters, namely mining and quarrying and energy-producing products (B05T06), demonstrating its advantage in identifying extreme or structurally divergent industries.
Table 3. Class size and average class features of three clustering methods.

4.2. Cluster Size and Feature Statistics
Table 3 presents the cluster size and the average values of the three resilience indicators under each method. The results confirmed that the GVC resilience characteristics of industries exhibited a clear multidimensional stratification.
(1) Characteristics of GMM clusters
The GMM divided industries into three groups with cluster sizes of 1, 29, and 12, reflecting a “one small, two large” structure.
-
Label 0 showed the lowest mean resilience (0.4088), relatively high volatility (0.1284), and a declining trend (0.0015), indicating a “low resilience, high volatility, declining” industry.
-
Label 1 showed the highest mean (0.6686), lowest volatility (0.0972), and a slightly negative trend, representing the dominant group with “high and stable resilience.”
-
Label 2 showed moderate resilience (0.6167), relatively high volatility (0.1211), and a positive trend (0.0041), corresponding to an “improving resilience” pattern.
(2) Characteristics of K-means\(\texttt{++}\) and spectral clusters
K-means\(\texttt{++}\) and spectral clustering generated identical cluster assignments with balanced sizes of 13, 14, and 15, indicating the following.
-
Label 0 showed the highest mean resilience (0.6858), lowest volatility (0.0793), and a slight upward trend (0.0008), indicating an industry group with “high resilience and low volatility.”
-
Label 1 exhibited the lowest mean resilience (0.6083), highest volatility (0.1223), and a positive trend (0.0035), corresponding to a “low-resilience and high-volatility” industry type.
-
Label 2 displayed moderate resilience, moderate volatility, and a distinct downward trend (0.0042), indicating a “medium-resilience and declining” group.
These patterns collectively confirmed that industry resilience exhibited systematic differences across the mean levels, volatility, and long-term trends.
4.3. Model Fit and Validity Evaluation
Table 4. Clustering parameters and effectiveness metrics.

Table 4 summarizes the parameter settings and clustering validity indices.
(1) Cluster number and noise samples
All the methods were set to three clusters and none identified noise points, suggesting that the dataset was suitable for conventional clustering without outlier removal.
(2) Performance of validity metrics
First, the Silhouette coefficients of K-means\(\texttt{++}\) and spectral clustering reached 0.3186 that was higher than the 0.2676 obtained by the GMM. This indicated that K-means\(\texttt{++}\) and spectral clustering achieved stronger within-cluster cohesion and clearer between-cluster separation.
Second, the GMM reported a lower Davies–Bouldin index (0.8976) compared with the 1.0713 of K-means\(\texttt{++}\) and spectral, suggesting that the GMM provided a relatively better degree of cluster separability.
Third, the Calinski–Harabasz index for K-means\(\texttt{++}\) and spectral clustering was 20.8139, exceeding the 13.5529 observed for the GMM. This demonstrated that K-means\(\texttt{++}\) and spectral clustering yielded more distinguishable cluster structures with greater between-cluster variability.
Overall, K-means\(\texttt{++}\) and spectral clustering produced clearer cluster boundaries and more compact cluster formations, making them robust primary classification methods. Meanwhile, the GMM exhibited unique strengths in distributional fitting and cluster separability, serving as a valuable complementary approach to robustness analysis.
4.4. Typology Interpretation and Summary
Based on the results obtained using the three clustering methods, several conclusions could be drawn.
First, industry resilience exhibited a stable three-group structure. All the methods consistently identified three distinct patterns of resilience, indicating that the multidimensional characteristics of resilience—mean, volatility, and trend—formed a clear structural differentiation across industries.
Second, K-means\(\texttt{++}\) and spectral clustering produced highly consistent results, reflecting stable inter-industry relationships in the feature space. The identical grouping structure generated by the two algorithms suggested that the relative distribution of industries was robust to methodological choices, thereby providing a classification scheme with strong interpretability and reproducibility. This served as the primary basis for the final classification.
Third, the GMM could detect industries with structurally atypical resilience features. The presence of a single-industry cluster indicated that certain industries substantially deviated from the overall distribution, offering additional information for policy analysis and risk identification. Therefore, the GMM served as a meaningful robustness complement to the main classification scheme.
Table 5. Final classification scheme.

As presented in Table 5, the 42 industries in the sample period could be classified into three categories based on the characteristics of their GVC resilience.
(1) Category I: High-resilience and low-volatility group
This category primarily included mid-range and high-end manufacturing, as well as producer services. These industries typically exhibited higher capital intensity, stronger technological capability, and superior supply chain coordination, enabling them to maintain greater stability and recovery capacity during external shocks.
For this group, policy efforts should focus on further enhancing technological upgrading and strengthening their control within GVCs, thereby consolidating their role as stabilizing anchors in the industrial system.
(2) Category II: Low-resilience and high-volatility group
This group mainly consisted of primary sectors and lifestyle services that were highly sensitive to market demand fluctuations. These industries were more vulnerable to external demand shifts, policy adjustments, and factor price volatility, resulting in lower average resilience and pronounced fluctuations.
Accordingly, supply chain risk diversification mechanisms should be reinforced, digitalization should be improved, and stronger buffers should be built against external disturbances.
(3) Category III: Medium-resilience and declining trend group
This category predominantly included mid-range and low-end manufacturing and producer services with relatively weak technological foundations. Although their resilience levels are moderate, the downward trend indicated an increasing pressure related to technological upgrading, value-chain positioning, and market restructuring.
For these industries, accelerating technological transformation and enhancing integration into GVCs are crucial to prevent further deterioration and avoid a potential low-end lock-in trajectory.
5. Conclusions
This study developed a comprehensive GVC resilience measurement system incorporating resistance, adjustment, and transformative dimensions and applied it to evaluate the resilience of 42 Chinese industries using the OECD ICIO database. Based on industry structural characteristics, the analysis examined the evolution of resilience across sectors and constructed industry-specific resilience feature vectors using annual means, variances, and long-term trends. By integrating K-means\(\texttt{++}\), GMM, and spectral clustering, this study identified the latent grouping patterns of industry-level GVC resilience. The main conclusions are as follows.
-
(1)
Significant heterogeneity emerged in the evolution of GVC resilience across industry types. Resource-intensive industries exhibited the lowest and most volatile resilience levels. Low-technology manufacturing, medium-technology manufacturing, and consumer services displayed relatively coordinated within-group dynamics. By contrast, producer services showed the highest resilience, followed by high-technology manufacturing, although both groups demonstrated substantial intragroup divergence. Overall, industries with higher knowledge and technological intensity tended to perform better across all three resilience dimensions.
-
(2)
From a temporal perspective, GVC resilience of China was relatively high in 2000, 2001, 2009, and 2020, indicating a stronger recovery capacity during the years characterized by major external shocks. Conversely, relatively weak resilience was observed in 2004, 2012, and 2017, reflecting the combined effects of decreased external demand and intensified structural adjustment pressures.
-
(3)
Based on the integrated results of intelligent clustering methods, the Chinese industries could be classified into three groups: high resilience and low volatility, low resilience and high volatility, and medium resilience and declining trend. The high-resilience and low-volatility group primarily consisted of mid-range and high-end manufacturing and producer services. The low-resilience and high-volatility group mainly included primary industries and consumer services that were highly sensitive to demand fluctuations. The medium-resilience and declining group largely comprised mid-range and low-end manufacturing and certain producer services with relatively weak technological capabilities.
Acknowledgments
This research was supported by the National Social Science Fund of China (Project No.24XJY013), Fujian Provincial Social Science Fund (Project No.FJ2023B063), and Fujian Provincial Natural Science Fund (Project No.2023J01926).
- [1] I. Ayadi and A. I. Hunjra, “Firms in times of economic uncertainty: Digital integration to counter information asymmetry and ESG controversies,” Business Ethics, the Environment & Responsibility, Vol.35, No.1, pp. 99-116, 2026. https://doi.org/10.1111/beer.12779
- [2] G. Gereffi, P. Pananond, F. Tell, and T. Fang, “Navigating industrial policy and global value chains in an era of disruptions,” J. of Int. Business Policy, Vol.8, No.3, pp. 207-223, 2025. https://doi.org/10.1057/s42214-025-00223-9
- [3] A. Berthou, A. Haramboure, and L. Samek, “Mapping and testing product-level vulnerabilities in granular production networks,” Organisation for Economic Cooperation and Development (OECD) Science, Technology and Industry Working Papers, No.2024/02, 2024. https://doi.org/10.1787/9bcde495-en
- [4] R. Koopman, Z. Wang, and S. Wei, “Tracing value-added and double counting in gross exports,” American Economic Review, Vol.104, No.2, pp. 459-494, 2014. https://doi.org/10.1257/aer.104.2.459
- [5] P. Antràs, “The uncharted waters of international trade,” National Bureau of Economic Research (NBER) Working Paper, No.33312, 2024. https://doi.org/10.3386/w33312
- [6] M. T. Islam and D. Chadee, “Adaptive governance and resilience of global value chains: A framework for sustaining the performance of developing-country suppliers during exogenous shocks,” Int. Business Review, Vol.33, No.2, Article No.102248, 2024. https://doi.org/10.1016/j.ibusrev.2023.102248
- [7] R. Martin, “Regional economic resilience, hysteresis and recessionary shocks,” J. of Economic Geography, Vol.12, No.1, pp. 1-32, 2012. https://doi.org/10.1093/jeg/lbr019
- [8] R. Baldwin, R. Freeman, and A. Theodorakopoulos, “Hidden exposure: Measuring US supply chain reliance,” National Bureau of Economic Research (NBER) Working Paper, No.31820, 2023. https://doi.org/10.3386/w31820
- [9] L. Statsenko, R. S. Jayasinghe, and C. Soosay, “Supply network resilience capabilities: A social-ecological perspective,” Supply Chain Management, Vol.29, No.1, pp. 1-26, 2024. https://doi.org/10.1108/SCM-11-2022-0438
- [10] M. Trippl, S. Fastenrath, and A. Isaksen, “Rethinking regional economic resilience: Preconditions and processes shaping transformative resilience,” European Urban and Regional Studies, Vol.31, No.2, pp. 101-115, 2024. https://doi.org/10.1177/09697764231172326
- [11] C. Schwellnus, A. Haramboure, and L. Samek, “Policies to strengthen the resilience of global value chains: Empirical evidence from the COVID-19 shock,” Organisation for Economic Cooperation and Development (OECD) Science, Technology and Industry Policy Papers, No.141, 2023. https://doi.org/10.1787/fd82abd4-en
- [12] R. Yang and Y. Zheng, “A study on the impact of digital economy development on the evolution of global value chain division of labor and resilience,” Quantitative Economics and Technological Economics Research, Vol.40, No.8, pp. 69-89, 2023 (in Chinese). https://doi.org/10.13653/j.cnki.jqte.20230706.001
- [13] B. Sheng and X. Hao, “Can digitalization of manufacturing enhance the resilience of enterprises’ global value chains? – From the perspective of ‘stabilizing, strengthening, and extending the chain’,” Finance and Trade Economics, Vol.46, No.6, pp. 1-17, 2025 (in Chinese). https://doi.org/10.19795/j.cnki.cn11-1166/f.20250611.006
- [14] R. C. Johnson and A. Moxnes, “GVCs and trade elasticities with multistage production,” J. of Int. Economics, Vol.145, Article No.103796, 2023. https://doi.org/10.1016/j.jinteco.2023.103796
- [15] Z. Wang, S. Wei, X. Yu, and K. Zhu, “Characterizing global value chains: Production length and upstreamness,” National Bureau of Economic Research (NBER) Working Paper No.23261, 2017. https://doi.org/10.3386/w23261
- [16] K. John, L. Litov, and B. Yeung, “Corporate governance and risk-taking,” The J. of Finance, Vol.63, No.4, pp. 1679-1728, 2008. https://doi.org/10.1111/j.1540-6261.2008.01372.x
- [17] S. Inomata and T. Hanaka, “Measuring exposure to network concentration risk in global supply chains: Volume versus frequency,” Structural Change and Economic Dynamics, Vol.68, pp. 177-193, 2024. https://doi.org/10.1016/j.strueco.2023.10.002
- [18] R. Baldwin, R. Freeman, and A. Theodorakopoulos, “Horses for courses: Measuring foreign supply chain exposure,” National Bureau of Economic Research (NBER) Working Paper, No.30525, 2022. https://doi.org/10.3386/w30525
- [19] F. Jiang, Z. Lei, and Z. Zhang, “Structural changes and efficiency evolution in manufacturing growth: A re-examination of the ‘geindustrialization’ issue,” China Industrial Economics, No.12, pp. 71-88, 2022 (in Chinese). https://doi.org/10.19581/j.cnki.ciejournal.2022.12.002
- [20] J. Ji, Y. Wang, and J. Yu, “Trade liberalization and distortions in labor allocation in the service sector,” Int. Trade Issues, No.7, pp. 105-122, 2023 (in Chinese). https://doi.org/10.13510/j.cnki.jit.2023.07.009
- [21] T. Liu and Q. Fu, “The structural ‘supporting effect’ in the dual circulation and the upward climbing of the manufacturing value chain: from the perspective of enhancing innovation capabilities,” China Industrial Economics, No.8, pp. 121-139, 2025 (in Chinese). https://doi.org/10.19581/j.cnki.ciejournal.2025.08.012
- [22] J. Yang, L. Hua, and H. Li, “U.S. export controls on China and the domestic value-added rate of Chinese firms’ exports,” World Economic Research, No.1, pp. 59-73, 2026 (in Chinese). https://doi.org/10.13516/j.cnki.wes.2026.01.004
- [23] C. Du and R. Zhang, “An exploration of the mechanisms and paths for artificial intelligence to promote the deep integration of advanced manufacturing and producer service industries,” The Economist, No.9, pp. 47-56, 2025 (in Chinese). https://doi.org/10.16158/j.cnki.51-1312/f.2025.09.014
- [24] A. Orankiewicz and M. Adamczak, “The emergence of new film distribution models as a result of streaming platforms’ impact on the contemporary film market,” Int. J. of Arts Management, Vol.27, No.2, pp. 51-66, 2025.
- [25] N. Shirahama, N. Nakaya, K. Moriya, K. Koshi, K. Matsumoto, and S. Watanabe, “An analysis of viewing intentions for promotional videos using fuzzy c c-means clustering: A comparative study between Japan and Singapore,” J. Adv. Comput. Intell. Intell. Inform., Vol.29, No.4, pp. 847-856, 2025. https://doi.org/10.20965/jaciii.2025.p0847
- [26] V. Kumar, A. Mohan, and G. Srivastava, “On machine learning assisted k k-means texttt{++} ++ clustering based phase quantization method for enhanced gain reflectarray design,” Int. J. of Electronics and Communications, Vol.204, Article No.156110, 2026. https://doi.org/10.1016/j.aeue.2025.156110
- [27] M. Wang, X. Li, L. Chen, H. Chen, C. Chen, and M. Liu, “A deep-based Gaussian mixture model algorithm for large-scale many objective optimization,” Applied Soft Computing, Vol.172, Article No.112874, 2025. https://doi.org/10.1016/j.asoc.2025.112874
- [28] Y. Zhao, Z. Bi, P. Zhu, A. Yuan, and X. Li, “Deep spectral clustering with projected adaptive feature selection,” IEEE Trans. on Geoscience and Remote Sensing, Vol.63, pp. 1-12, 2025. https://doi.org/10.1109/TGRS.2025.3530434
This article is published under a Creative Commons Attribution-NoDerivatives 4.0 Internationa License.