Research Paper:
REAM: A Multi-Sentiment Review-Driven Method for Fine-Grained Customer Requirement Extraction and Analysis
Lei Wu*, Yan Liu**, Lingru Cai*, and Chenglong Xiao*,†
*School of Mathematics and Computer Science, Shantou University
No.5 Cuifeng Road, Shantou, Guangdong 515821, China
†Corresponding author
**University of the West of England
Coldharbour Lane, Bristol, BS 1, United Kingdom

Massive online reviews play a crucial role in mining customer requirements. However, existing research has three limitations: (1) the inadequate capture of contextual semantics in traditional text classification models, (2) the lack of sentiment analysis targeted at the product attribute level, and (3) the neglect of inter-attribute dependencies in requirement analysis. To address these gaps, this study proposed a requirement extraction and analysis method (REAM) that integrated multi-sentiment reviews. Specifically, a multi-domain adaptive BERT–BiLSTM–hierarchical position-aware network (HPANet) was developed for the fine-grained classification of reviews to automatically categorize them into nine key product attributes (for example, cost-performance ratio and appearance) that served as concrete manifestations of customer requirements. For requirements analysis, this method examined three dimensions: customer attention to product features, sentiment orientation toward specific attributes, and inter-attribute dependencies, thereby facilitating a comprehensive understanding of customer requirements. In the requirement extraction phase, the experimental results demonstrated that the proposed model achieved 1.2% higher classification accuracy than the conventional BERT model on a custom-built customer requirement dataset. To further verify the stability of the BERT–BiLSTM–HPANet model, additional validation was conducted on public datasets (CNews and ChnSentiCorp), revealing significant improvements in both the accuracy and F1-score compared with the baseline models.
1. Introduction
In the digital economy era, online reviews have become the primary channel for consumers to express product experiences and requirements 1,2. According to Statista, global e-commerce platforms generate more than 30 billion reviews annually, containing extensive granular information on product attributes, usage experiences, and improvement suggestions 3. Compared with traditional market research methods, online reviews offer unprecedented opportunities for requirement mining because of their massive scale, real-time nature, and rich emotional expressions 4.
Traditional product design strategies rely heavily on in-depth customer insights 5. However, early methods such as surveys and customer interviews 6 are time-consuming and expensive 7. Advanced natural language processing (NLP) technologies enable manufacturers to systematically extract potential requirements from massive review data with high speed and accuracy. This data-driven approach provides a basis for functional architecture design and supports competitive benchmarking through dynamic sentiment analysis of product features, thereby gradually becoming a mainstream analytical method 8. Industries such as tourism, hospitality, and catering have widely used online reviews to understand specific customer requirements (CRs) 9,10,11. In the electronics industry, particularly for technology-intensive products such as smartphones and laptops, rapid product iteration, diverse CRs, and market fragmentation require the agile and accurate identification of consumer preferences 12. Several design studies such as the product recommendation system based on reviews by Lin et al. 13, the analysis of sentiment evolution toward product features by Kim et al. 14, and the derivation of new feature design strategies by Wang 7 have leveraged online data.
Despite these advancements, the existing research has critical limitations. Most studies have focused on document-level sentiment analysis while neglecting feature-level sentiment orientation, resulting in incomplete requirement interpretation 15. Current text classification models demonstrate limited effectiveness in processing massive amounts of review data and accurately categorizing CRs 16. Biased reviews of malicious activities (for example, fake purchases and competitor sabotage) have prompted some scholars to examine single sentiment categories 17; however, few have integrated analyses across different sentiment polarities.
To address these gaps, this study proposed a bidirectional encoder representations from transformers (BERT)-based framework for automated CR extraction and analysis, integrating three sentiment polarities: positive, neutral, and negative reviews. Unlike traditional requirement classification methods, BERT could better capture contextual nuances to improve classification accuracy 18. Furthermore, we introduced a feature-level sentiment analysis method for granular evaluation, enabling a comprehensive understanding of the requirements.
The remainder of this paper is structured as follows: Section 2 reviews related work. Section 3 presents the dynamic framework for continuous product improvement, detailing attribute definition, extraction, satisfaction scoring, and impact analysis. Section 4 provides comprehensive experimental comparisons between the proposed classification model and baselines. Section 5 demonstrates the application of this method using product case studies.
2. Related Work
2.1. Customer Requirement Extraction
E-commerce platforms and social media have become key channels for consumers to share product opinions, with user-generated content (UGC) containing valuable insights into product experiences. A comprehensive understanding of CRs is crucial for successful new product design 1. Traditional requirement mining methods, such as the voice of customer framework by Griffin and Hauser 19, rely on focus group interviews but suffer from small sample sizes and subjectivity. With the growth of online reviews, unstructured post-purchase UGC offers abundant requirement-related information, although extracting requirements from large volumes of unstructured text remains a challenge 20.
Existing approaches include the use of word frequency counting and co-occurrence analysis to identify core product attributes by Büschken and Allenby 11 that lacks precision and ignores the influence of sentiment. Ferguson et al. 21 developed an ergonomics-focused phrase set to extract design-specific requirements (for example, earplug dimensions) from reviews. Latent Dirichlet allocation (LDA), an unsupervised method, is widely used in review analysis for its simplicity. For example, Liu et al. 22 applied LDA to pharmacy reviews for satisfaction analysis. Guo et al. 23 combined topic modeling and sentiment analysis to prioritize service improvements using more than 20,000 hotel reviews. However, LDA performance degrades significantly on long texts; a root cause lies in its word-bag assumption that ignores contextual dependencies and semantic coherence 20. In long reviews, product attributes and related sentiments are often scattered across sentences, leading to sparse topic distributions and ambiguous clustering results. Recent studies 24 further confirm that LDA fails to capture the hierarchical semantic structure of long texts, resulting in overlapping topic clusters and reduced attribute extraction accuracy.
Timoshenko and Hauser 25 proposed a machine learning-based UGC analysis framework that was more efficient than traditional methods but required manual encoding of 12,000 UGC sentences, limiting its use in low-engagement domains. Tucker and Kim 26 tracked temporal shifts in consumer preferences using machine learning, and Long et al. 27 developed a framework linking core requirements to design strategies. Zhan et al. 28 identified negative themes in pharmacy reviews via sentiment analysis but overlooked critiques in positive or neutral feedback. Zhang et al. 29 used a deep learning-based embedding ensemble to mine innovative ideas from more than 10,000 reviews with 91% accuracy, although dichotomizing requirements into “innovative” and “non-innovative” provided limited actionable insights.
In recent years, lightweight transformer models have emerged as a pivotal solution for resource-constrained scenarios, achieving remarkable advancements via architectural innovations and efficiency-oriented optimizations. Representative models such as CloFormer 30, designed for computer vision tasks, adopt enhanced local perception mechanisms to reduce parameters to merely 42k and FLOPs to 0.6G while attaining a Top-1 accuracy of 77.0% on ImageNet1K, outperforming conventional lightweight vision models 30. TokenFormer 31 introduces a parameter-tokenization strategy, replacing fixed linear projections with attention-driven token-parameter interactions to enable seamless incremental scaling from 124M to 1.4B parameters without full retraining, drastically cutting training costs while maintaining performance parity 32. For specialized tasks such as sign language recognition, TSLFormer 32 leverages a compact two-layer Transformer architecture with 144-dimensional features, achieving 90.67% accuracy on the AUTSL dataset and enabling real-time inference on mobile devices with a 0.3-s processing latency per second of video. Despite these gains, trade-offs persist between extreme lightweighting and the modeling of complex contextual or spatiotemporal dependencies, highlighting avenues for further optimization in efficient architecture design.
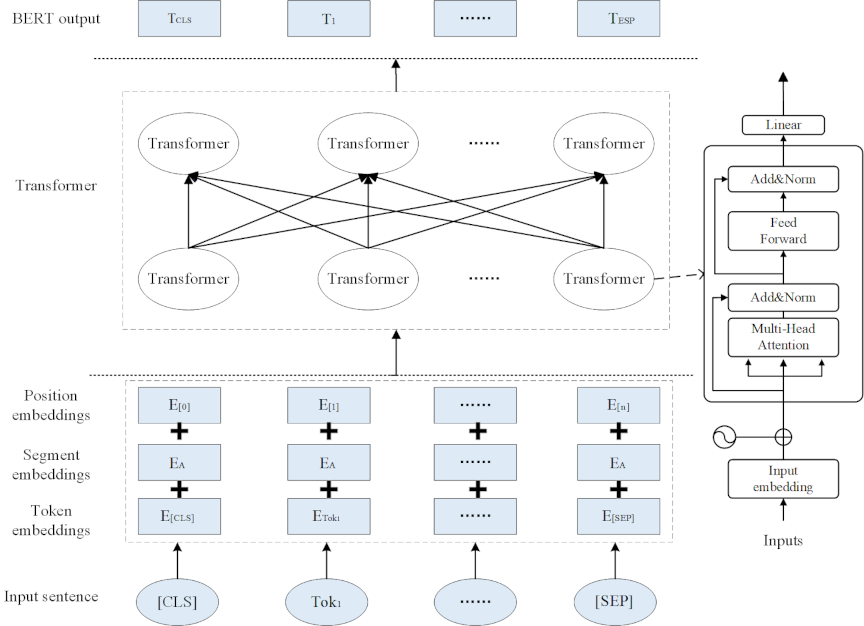
Fig. 1. BERT model.
2.2. Customer Requirement Processing
After extracting the requirements from UGC, processing and analysis are required to translate the insights into product design guidance. The Kano model and its variants CRs. Li et al. 33 proposed an importance-Kano analysis for online fresh products, highlighting consumer focus on shopping experience and quality. Bi et al. 34 integrated sentiment analysis with the Kano model to identify factors influencing satisfaction. Sun et al. 35 introduced a CM-Kano model incorporating both customer and manufacturer perspectives. However, the Kano model relies on questionnaire data, limiting large-scale review mining, and its qualitative criteria are subjective 36.
Alternative studies 37,38 have used machine learning to construct knowledge graphs from fragmented data, supporting conceptual design knowledge acquisition. Knowledge graphs connect diverse data by representing entities and relationships, integrating sources, and visualizing information flows 39. Although useful for storing requirement data, they require extensive expert input and manual annotation, and their word/phrase-level nodes capture limited semantic information. Thus, this study uses deep learning for requirement classification to preserve UGC semantics.
Sentiment and attention analysis of UGC is common 40, and assessing customer satisfaction with each attribute is critical 41. Traditional methods (for example, questionnaires and rule-based approaches) 42,43 lack generalizability owing to domain-specific lexicons. Machine and deep learning dominate sentiment analysis. Imtiaz and Islam 44 used mobile phone reviews to link product attributes to satisfaction, informing design strategies. Zhao et al. 45 prioritized attributes by considering sentiment and attention levels. This study builds on this by integrating inter-attribute relationships to provide more comprehensive design recommendations.
2.3. Fundamental Techniques
Hybrid neural networks have attracted considerable attention in NLP. Li et al. 46 proposed a BERT–BiLSTM model for sentiment analysis of Chinese buzzwords, whereas the RoBERTa–BiLSTM framework by Rahman et al. 47 achieved competitive results on three sentiment analysis benchmarks. Another Li et al. 48 used a BiLSTM–CNN hybrid model with multi-feature fusion to enhance community question answering text matching. Deng et al. 49 developed an attention-based BiLSTM–CNN model with a gating mechanism for medium-to-long text classification.
Building on these, this study proposes BERT–BiLSTM–hierarchical position-aware network (HPANet), integrating BERT for deep contextual understanding and BiLSTM for capturing sequential dependencies to extract fine-grained CRs from reviews.
Among pre-trained models (for example, GPT, ERNIE, XLNet, and T5), BERT and its derivatives excel in text understanding tasks. This framework uses the BERT-base-Chinese model for its balance of accuracy and efficiency in processing Chinese text.
BERT is a deep multi-layer bidirectional transformer encoder. As shown in Fig. 1, it processes inputs through embedding and encoding, where tokens are represented as the sum of token (semantic content), segment (distinguishing paired sequences), and position (token order) embeddings.
Composite embeddings pass through transformer encoder layers, each with multi-head self-attention and a position-wise feed-forward network, enhanced by residual connections and layer normalization to capture bidirectional contextual dependencies. The final hidden state of a [CLS] token represents sequences for classification, whereas the states of other tokens support downstream tasks (for example, named entity recognition). Fig. 1 illustrates the transformer blocks, where the embeddings are refined using attention and feed-forward networks.
BiLSTM follows the BERT encoder to model sequential dependencies and long-range contexts, capturing both forward and backward information that is critical for understanding the surrounding words in a text.
For a BERT-generated sequence of contextualized token embeddings \(\{h_{1}, h_{2}, \dots, h_{n}\}\), BiLSTM processes it in two directions as follows:
The final hidden state at time \(t\) concatenates forward and backward states as follows:
This bidirectional structure captures dependencies in past and future contexts, enhancing detection of nuanced CRs in free-form reviews.
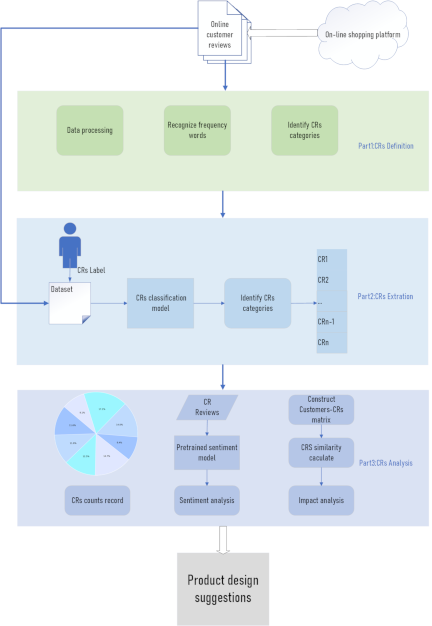
Fig. 2. Research framework.
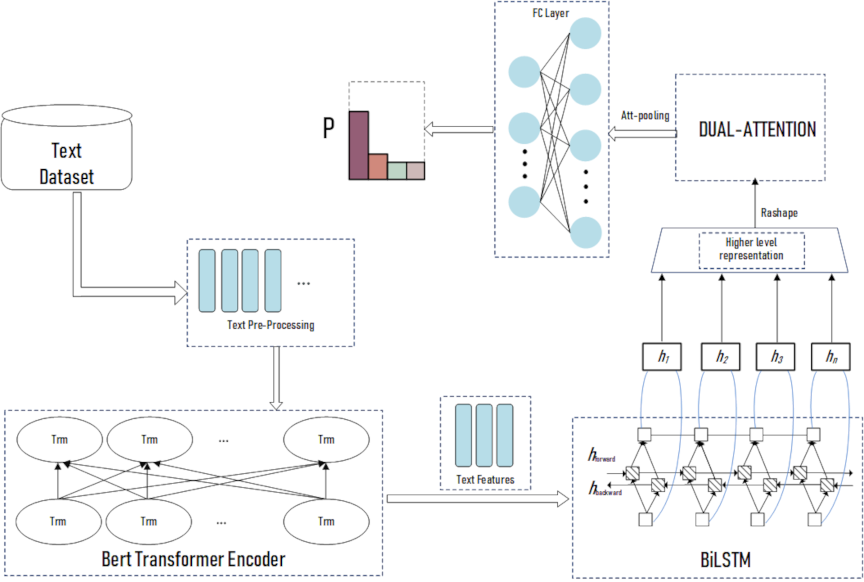
Fig. 3. Architecture of BERT–BiLSTM–HPANet.
3. Requirement Extraction and Analysis Method (REAM)
This study proposes a requirement extraction and analysis method (REAM), as illustrated in Fig. 2. This method comprises three sequential stages.
-
Stage 1:
CRs definition: Customer review texts are collected from mainstream e-commerce platforms and undergo systematic preprocessing to refine the latent requirement categories.
-
Stage 2:
CRs extraction: The collected CRs are classified into granular categories using the proposed BERT–BiLSTM–HPANet model.
-
Stage 3:
CRs analysis: An in-depth analysis is performed on the extracted CRs through a multi-dimensional examination, aiming to comprehensively grasp the essence and characteristics of CRs.
3.1. CRs Definition
3.1.1. Product Attribute Extraction
Online reviews contain rich user feedback on product characteristics, and identifying keywords related to these characteristics is critical for product design and optimization. Product characteristics refer to predefined attributes and functions (for example, performance, appearance, and price) established during the design phase that are core to CRs. Users express requirements and expectations for these attributes in reviews; thus, accurately mapping keywords to their categories can effectively reveal actionable CRs.
Product characteristics vary significantly across product types and functions (for example, smartphones emphasize performance, design, and battery life). To extract product-related key information from massive customer reviews, this study uses the term frequency–inverse document frequency (TF–IDF) technique. TF–IDF quantifies term importance in a corpus, enabling efficient identification of keywords that reflect product attributes.
The TF–IDF algorithm combines two metrics: TF and IDF. The TF measures the local importance of term \(t\) in document \(d\) and can be calculated as follows:
However, the TF is susceptible to high-frequency but semantically trivial terms (for example, “the” and “is” in English). The IDF addresses this issue by evaluating the discriminative power of a term across a corpus.
This score prioritizes terms with both local relevance (within a document) and global distinctiveness (across the corpus), effectively suppressing noise and highlighting domain-specific patterns critical for identifying product attributes in large-scale text analysis.
3.1.2. Product Requirement Mining
To filter product-irrelevant terms and identify CR categories, clustering analysis is applied to the extracted keywords, enabling the recognition of distinct product characteristic classes. For example, in smartphone reviews, terms such as “performance,” “speed,” and “processor” may cluster into a “performance” category, while “appearance,” “design,” and “weight” may form a “design aesthetics” category.
The \(K\)-means algorithm, a widely used unsupervised learning method, groups vocabulary into clusters based on semantic similarity. Its goal is to partition data into \(k\) clusters by maximizing the intra cluster cohesion and minimizing inter-cluster divergence that is achieved by iteratively optimizing the objective function.
-
Initialization: Randomly select \(k\) data points as initial centroids \(\{\mu_{1}, \mu_{2}, \dots, \mu_{k}\}\).
-
Assignment Step: For each data point \(\chi_{i}\), compute its distance to all centroids \(\mu_{j}\) and assign it to the nearest cluster: \begin{equation} \mathrm{cluster{\_}assignment} \bigl(\chi_{i}\bigr) = \mathop{\rm arg~min}\limits_{j \in \{1, 2, \dots, K\}} \left\lVert \chi_{i} - \mu_{j} \right\rVert^{2}. \label{eq:cluster_assignment} \end{equation}
-
Update Step: Recalculate the centroid of each cluster as the mean of its assigned data points: \begin{equation} \mu_{j} = \frac{1}{\vert C_{j} \vert} \sum_{\chi_{i} \in C_{j}} \chi_{i}, \label{eq:center_update} \end{equation}where \(C_{j}\) represents the set of data points in cluster \(j\), and \(|C_{j}|\) denotes the size of \(C_{j}\).
-
Termination: Repeat assignment and update until the centroids stabilize (change \(<\) threshold) or the maximum iteration count is reached.
This process effectively extracts product characteristic information from large-scale customer reviews and uncovers the specific requirements of users for these characteristics, enhancing review data interpretability and providing valuable references for product design and market optimization.
Table 1. Comprehensive comparison of attention mechanisms.

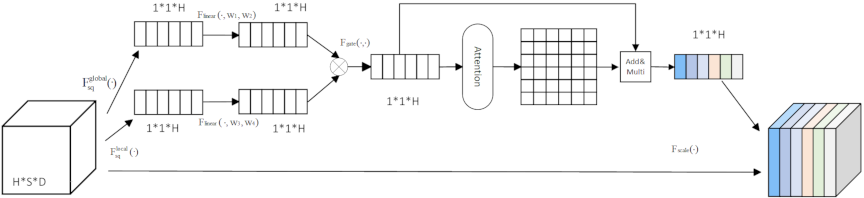
Fig. 4. HCG attention
3.2. CRs Extraction
The CRs are classified in fine-grained detail using the proposed BERT–BiLSTM–HPANet model (architecture in Fig. 3). The model preprocesses the requirement texts into embedded vectors, feeds them into BERT to generate context-rich word representations, and uses BiLSTM to capture the sequential features bidirectionally. Subsequently, it employs two key attention mechanisms.
-
Hierarchical cross-head gating (HCG) attention dynamically recalibrates BiLSTM outputs to focus on critical semantic information.
-
Position-aware attention integrates absolute and relative positional encodings to identify key semantic positions.
A detailed comparison of these mechanisms is presented in Table 1. Finally, average pooling and a multilayer perceptron are used to produce the classification logits. The proposed model combines BERT, BiLSTM, and dual attention to address the limitations in semantic capture and position sensitivity. The enables the accurate extraction of CRs from online reviews to optimize the product design.
3.2.1. Hierarchical Cross-Head Gating Attention
Inspired by the squeeze-and-excitation 50 block and HTH attention 51, this study presents a multi-granularity feature fusion network tailored to extract CRs from online reviews, introducing HCG attention. This mechanism is designed to dynamically recalibrate attention heads through multi-scale feature interactions, thereby enhancing the capability of the model to capture critical semantic information embedded in review texts, such as subtle descriptions of product attributes and user demands.
To achieve this, HCG attention incorporates a bottleneck structure to mitigate parametric complexity while maintaining sufficient feature expressiveness and constructs a symmetric attention matrix to enhance numerical stability during training. A key distinction from conventional attention frameworks lies in the treatment of each attention head as an independent computational unit: this design enables the efficient extraction of inter-head feature dependencies and facilitates targeted cross-head interactions. By establishing adaptive weight relationships between heads, it effectively reduces the redundancy in feature representations and strengthens the discriminative power of fused attention features that is critical for distinguishing between diverse and often ambiguous CR expressions in unstructured reviews.
The architectural details are shown in Fig. 4, where \(F_{\mathrm{sq}}^{\mathrm{global}}(\cdot)\) and \(F_{\mathrm{sq}}^{\mathrm{local}}(\cdot)\) denote global and local spatial squeezing operations, respectively, capturing both contextual-level and fine-grained semantic information. \(F_{\mathrm{linear}}(\cdot, w_{1}, w_{2})\) and \(F_{\mathrm{linear}}(\cdot, w_{3}, w_{4})\) perform global and local linear transformations, respectively, to refine the feature dimensions, and \(F_{\mathrm{gate}}(\cdot, \cdot)\) implements a gating mechanism to fuse multi-granularity features, ensuring that the most relevant semantic components for requirement extraction are prioritized.
Key implementation step: Input tensor \(U \in \mathbb{R}^{B \times H \times S \times D}\) (where \(B\), \(H\), \(S\), and \(D\) denote the batch size, number of attention heads, sequence length, and head dimension, respectively).
-
Stage 1:
Multi-Granularity Feature Squeezing
\begin{align} M_{bh}^{\mathrm{global}} &= \frac{1}{S \cdot D} \sum_{s = 1}^{S} \sum_{d = 1}^{D} U_{bhsd} ,\\ \end{align}\begin{align} M_{bh}^{\mathrm{local}} &= \frac{1}{S} \sum_{s = 1}^{S} \left(\frac{1}{D} \sum_{d = 1}^{D} U_{bhsd}\right) . \end{align} -
Stage 2:
Hierarchical Feature Transformation
\begin{align} & \hspace{-3em} X = \sigma \left(W_{x2} \cdot \mathrm{ReLU} \left(W_{x1} \cdot M^{\mathrm{global}} + b_{x1}\right) + b_{x2} \right) , \\ \end{align}\begin{align} &\hspace{-3em} Y = \sigma \left(W_{y2} \cdot \mathrm{ReLU} \left(W_{y1} \cdot M^{\mathrm{local}} + b_{y1} \right) + b_{y2} \right) . \end{align} -
Stage 3:
Dynamic Gating Fusion
\begin{align} g &= \sigma \left(W_{g} [X | Y] + b_{g}\right) , \\ \end{align}\begin{align} M &= g \odot X + (1 - g) \odot Y . \end{align} -
Stage 4:
Symmetric Cross-Attention
\begin{align} &\hspace{-3em} Z = \mathrm{softmax} \left(\frac{M \cdot M^{\top} + \bigl(M \cdot M^{\top}\bigr)^{\top}} {\sqrt{H}}\right) , \\ \end{align}\begin{align} &\hspace{-3em} \tilde{M} = Z \cdot M + M . \end{align} -
Stage 5:
Feature Recalibration
\begin{equation} \tilde{U}_{bhsd} = U_{bhsd} \cdot \tilde{M}_{bh} . \end{equation}
Here, \(|\) denotes tensor concatenation, \(\sigma\) represents the sigmoid activation function, and \(\odot\) signifies element-wise (Hadamard) multiplication.
3.2.2. Position-Aware Attention
Position-aware attention is a deep neural network module designed to enhance the explicit representation and interaction of positional information in sequence modeling. By leveraging a dual-modal position awareness mechanism that integrates absolute positional encoding and relative positional bias, combined with a dynamic multi-head attention paradigm, this module enables the cooperative modeling of local contextual relationships and global positional dependencies within text sequences. Its core lies in constructing a position-sensitive attention weight distribution, allowing the model to simultaneously capture semantic associations and spatial structural features simultaneously.
In terms of implementation, the module first performs position enhancement on the input sequence using learnable absolute positional encoding parameters. It injects independent position embedding representations for each sequence position, thereby establishing a benchmark spatial index. On this basis, a linear projection is employed to generate multi-head query, key, and value vectors. The multi-head attention mechanism is used to decompose the hidden space into multiple semantic subspaces, thereby facilitating the learning of diverse features. To strengthen the position awareness capability, a relative positional bias parameter matrix is introduced, that acts directly on the attention calculation process to explicitly model the relative distance association between any two positions. This bias matrix adaptively adjusts the interaction intensity between positions through parameterized learning, enabling the semantic associations of adjacent positions to receive stronger weight incentives. A scaling factor is introduced to normalize the dot product attention results, effectively controlling the stability of the attention weight distribution and avoiding gradient anomalies. When handling variable-length inputs, the module incorporates an attention masking mechanism to dynamically shield the interference from invalid positions, ensuring that the model focuses on the computation of effective semantic regions.
The calculation method can be expressed as follows:
Table 2. Data filtering pipeline.

3.3. CRs Analysis
3.3.1. Sentiment Analysis Based on RoBERTa
Sentiment analysis, a key post-extraction step in CR analysis, quantifies satisfaction by detecting emotional tones in the text to evaluate attitudes toward specific CRs, aiming to unearth latent emotional insights from reviews for CR management and product enhancement. This study leverages the pre-trained RoBERTa model (an advanced BERT variant developed by Facebook AI, 2019, adept at capturing contextual dependencies). As detailed, RoBERTa, fine-tuned by Zhang et al. 52 on 227,347 samples from eight Chinese sentiment analysis domains, enables precise sentiment judgments for product features. By holistically analyzing semantic relationships (not just word-level matching), it mitigates ambiguities, empowering the comprehensive evaluation of customer sentiments toward CRs to guide data-driven product improvements.
3.3.2. Impact Analysis
In CR analysis, uncovering the intricate correlations between different requirements is pivotal to understanding product improvement interdependencies and guiding design decisions. To address this, this study introduces a novel requirement-based collaborative filtering (RBCF) framework that models requirement correlations by leveraging CR co-occurrence patterns.
-
Step 1:
Customer Requirement Matrix Construction We construct a binary CR matrix \(\mathbf{U} \in \mathbb{R}^{m \times n}\), where \(m\) denotes the number of customers, and \(n\) denotes the number of requirements. Each element \(u_{ij}\) indicates whether customer \(i\) mentioned requirement \(j\).
\begin{equation} u_{ij} = \begin{cases} 1,& \text{if customer~$i$ mentioned} \\ & ~~~~\text{requirement~$j$},\\ 0,& \text{otherwise}. \end{cases} \label{eq:customer-requirement-matrix} \end{equation} -
Step 2:
Requirement Similarity Calculation We compute requirement similarity using cosine similarity over the CR matrix.
\begin{equation} \mathrm{Sim}\bigl(r_{i}, r_{j}\bigr) = \frac{\mathbf{U}_{i} \cdot \mathbf{U}_{j}} {\bigl\|\mathbf{U}_{i}\bigr\| \cdot \bigl\|\mathbf{U}_{j}\bigr\|}, \label{eq:cosine-similarity} \end{equation}where \(\mathbf{U}_{i}\) and \(\mathbf{U}_{j}\) denote the \(i\)-th and \(j\)-th columns, respectively, of matrix \(\mathbf{U}\), representing the customer interactions with requirements \(r_{i}\) and \(r_{j}\), respectively.
-
Step 3:
Requirement Correlation Matrix From the pairwise similarities, we derive a requirement correlation matrix \(S \in \mathbb{R}^{n \times n}\), where each element \(s_{ij} = \mathrm{Sim}(r_{i}, r_{j})\). This matrix explicitly captures the degree of semantic association of each pair of requirements. For example, a high \(s_{ij}\) value indicates that customers who mention \(r_{i}\) are likely to mention \(r_{j}\) as well, signaling a strong inter-dependency.
This framework directly leverages co-occurrence patterns to reveal hidden relationships between requirements. A high correlation between \(r_{i}\) and \(r_{j}\) implies that optimizing one may indirectly impact the other, guiding designers to consider holistic improvements rather than isolated changes.
4. Experiments
4.1. Experiment Data
4.1.1. Product Attribute Extraction
To determine the product attributes that customers cared most about, we used preprocessed review data to mine the key attributes. We relied on the Chinese word segmentation tool Jieba and the TF–IDF text feature extraction method. We analyzed 5,000 reviews of Mechrevo, Lenovo, and Dell laptops from JD.com to obtain product-attribute keywords that users often mentioned. After calculating and sorting by TF–IDF weights, we obtained core keywords.
Because review texts have semantically repeated words (such as “appearance” and “appearance design”), we need further cleaning and clustering. First, we filtered irrelevant expressions (such as marketing phrases and meaningless modal particles). Subsequently, we used a semantic clustering algorithm to combine similar keywords and determine the hidden thematic structure in the reviews. We put contents with no direct value for product design (such as “logistics” and “service quality”) into the “Other” theme. Finally, through clustering, we obtained nine core requirement themes: Processor, Storage, Screen, Appearance, Design, Price, System, Heat Dissipation and Endurance, and Other.
We organized the scattered user feedback through theme clustering. This clearly showed the requirement distribution of laptop products and provided a clear direction for subsequent requirements analysis and product optimization.
4.1.2. CRs Dataset Construction
To enable a systematic requirements analysis for laptop design, we constructed a structured dataset from UGC. The dataset was built using the reviews of Dell, HP, and ASUS laptops scraped from JD.com, a leading Chinese e-commerce platform. These reviews contained multi-dimensional feedback on product characteristics, forming the basis for requirement extraction and model training. To ensure dataset quality, a four-stage filtering process was implemented, as presented in Table 2.
Following preprocessing (encompassing the aforementioned filtering procedures), valid sentences were manually annotated with requirement categories. Specifically, nine primary labels were defined for laptop design requirements that corresponded to the product attributes that users cared the most about. The final dataset comprised 3,504 valid user requirement data points, with structured themes directly mapped to the outcomes of attribute extraction, laying a solid foundation for subsequent requirement analysis and product optimization endeavors.
Table 3. Statistics of CNews, ChnSentiCorp, and CRs datasets.

Table 4. Text classification results on multiple datasets.

4.1.3. Public Datasets
This experiment employed two publicly accessible datasets and CRs dataset, the details of which are listed in Table 3. The datasets are as follows.
ChnSentiCorp is a widely used Chinese sentiment analysis benchmark dataset comprising customer reviews primarily from e-commerce platforms. It is meticulously labeled into two polarities—positive and negative—offering a balanced distribution that facilitates the evaluation of sentiment classification models. The real-world origin and clear polarity labels of this dataset make it a standard reference for assessing the performance of sentiment analysis techniques in Chinese.
CNews dataset is a widely used Chinese news text classification dataset, consisting of news articles collected from various online media sources. It covers a broad range of real-world topics and is frequently used to evaluate Chinese text classification models. The dataset is annotated with 10 distinct categories, including finance, technology, sports, and entertainment.
4.2. Loss Function and Evaluation Metric
We adopted a cross-entropy loss function to quantify the discrepancy between the predicted probabilities and true labels. For our classification task, it is formulated as follows:
Accuracy (Acc), precision (P), recall (R), and F1-score were adopted as evaluation metrics to quantify the classification performance of the model. Their mathematical formulations are as follows.
Accuracy measures the overall proportion of correctly classified samples against the total number of samples. Its calculation is defined by Eq. \(\eqref{eq:accuracy}\):
Precision quantifies the ratio of truly positive samples to all samples predicted as positive by the model. This is formulated as shown in Eq. \(\eqref{eq:precision}\):
Recall (or sensitivity) reflects the proportion of truly positive samples that are correctly identified from all actual positive samples. Its formula is given by Eq. \(\eqref{eq:recall}\).
The F1-score is the harmonic mean of precision and recall, balancing the precision of the model in positive prediction and its ability to retrieve actual positives. It is calculated using Eq. \(\eqref{eq:f1}\).
4.3. Experimental
The text classification results across three datasets (CNews, ChnSentiCorp, and CRs), as are presented in Table 4, showed that BERT–BiLSTM–HPANet outperformed the baselines (for example, TextCNN and FastTEXT) and advanced pre-trained models (MacBERT, ChineseBERT, and RoBERTa). It achieved superior accuracy and F1-scores, demonstrating strong semantic capture and adaptability to domain-specific texts such as CRs.
For parameter efficiency, the model balanced the performance and computational cost, as shown in Fig. 5. Its parameter count was competitive with mainstream architectures (BERT, ERNIE, and RoBERTa), avoiding excessive parameters that inflated training/inference costs. This allowed deployment in resource-constrained environments (for example, edge devices) without sacrificing the quality.
In summary, the BERT–BiLSTM–HPANet model leveraged the contextual embeddings of BERT and the sequential modeling of BiLSTM to outperform single-architecture models. It achieved state-of-the-art accuracy with leaner parameters than heavyweight models (for example, RoBERTa), reducing the computational overhead. These results validated its suitability for industrial applications requiring high-precision text classification and resource efficiency.
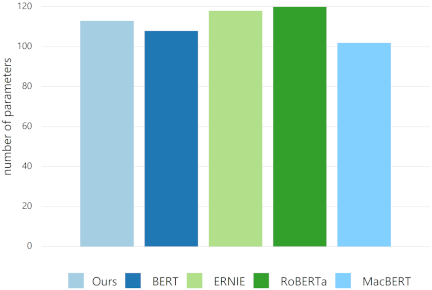
Fig. 5. Number of parameters.
4.4. Ablation Experiments
To determine the individual contributions of the core components, we conducted ablation experiments using the ChnSentiCorp and CRs datasets. In particular, this section examines the influence of the three key modules (BiLSTM, HCG attention, and position-aware attention) on the performance of the model, shedding light on their distinct roles in the full BERT–BiLSTM–HPANet architecture.
As presented in Table 5, removing the BiLSTM layer (w/o BiLSTM) caused consistent performance degradation across both datasets. This outcome underscored the pivotal function of BiLSTM in capturing sequential dependencies that is essential for enriching semantic representations in text classification tasks. Similarly, omitting HCG attention (w/o HCG Attn) or position-aware attention (w/o Position-Aware Attn) led to declines in accuracy, precision, recall, and F1-score. These results highlighted that HCG attention refined multi-head attention weights to prioritize critical semantic information, whereas position-aware attention bolstered the utilization of positional features, both of which were indispensable for effectively modeling complex contextual and structural nuances within texts.
The full model outperformed all ablated configurations, validating the synergistic design: the sequential modeling prowess of BiLSTM, semantic calibration ability of HCG attention, and positional enhancement capacity of position-aware attention collectively optimized the classification performance. This ablation study clarified the necessity of each component and underscored the robustness of the model architecture for text-intensive applications such as CR analysis.
Table 5. Ablation study on ChnSentiCorp and CRs datasets.

5. Application
The Mechrevo Aurora X laptop, with its long-term market presence, exceptionally high sales volume, and substantial online customer reviews, was selected as a representative case in this study. By analyzing its product strengths and weaknesses, we aim to assist designers in formulating evidence-based product design strategies. The feasibility and effectiveness of our analytical framework were validated by applying the proposed methodological framework to systematically examine CRs and generate actionable recommendations for this specific laptop model.
5.1. Data Collection and Processing
The Mechrevo Aurora X laptop was selected for analysis based on the customer reviews collected from JD.com, a leading e-commerce platform for electronic device purchases in China. Using established web crawling technologies, we systematically retrieved 1,700 customer reviews (including positive, neutral, and negative evaluations) spanning September to December 2024. A sample of the data is shown in Fig. 6.

Fig. 6. Online customer reviews.
Let \(\mathrm{Review} = \{\mathrm{CR}_{1}, \mathrm{CR}_{2}, \dots, \mathrm{CR}_{N}\}\), where \(N\) represents the number of CRs per review. We used the “re” module in Python to split long customer texts into sentences using special symbols such as periods and exclamation marks. This process separated different product-related requirements within the CR texts, laying the foundation for subsequent requirement extraction and impact analysis. Through this process, we processed 1,700 customer reviews to yield 3,044 valid requirement instances.
5.2. Application of REAM
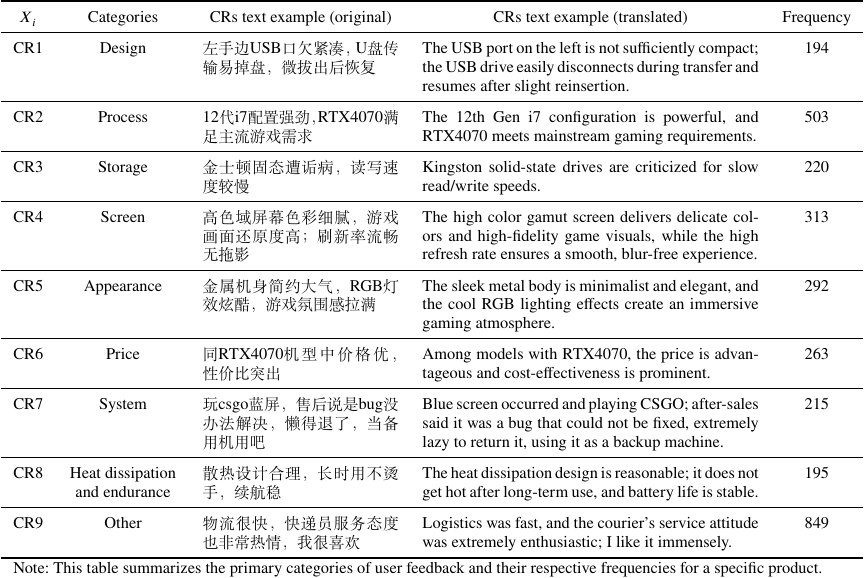
After data preprocessing, we employed the trained BERT–BiLSTM–HPANet requirement classification model to systematically categorize customer reviews into eight specific product design requirement categories and one miscellaneous category. Table 6 comprehensively presents the representative examples corresponding to eight specific requirement categories.
Table 6. Customer requirement classification statistics.
The pre-trained RoBERTa model captures rich linguistic features and contextual information, enabling it to effectively identify sentiment orientations in complex texts. The statistical results are shown in Fig. 7.
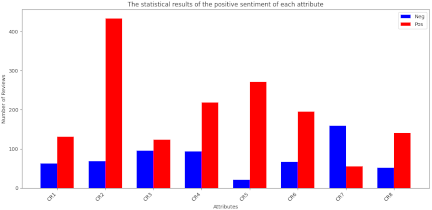
Fig. 7. Statistical results of the sentiment orientations of each attribute.
To analyze the influence of CRs influence on each other, we first extracted and structured CRs from reviews. We then computed the Jaccard similarity for all CR pairs—that measured the semantic overlap (ratio of intersection to union of CR descriptions). For our identified CRs (\(\mathrm{CR}_{1}\) to \(\mathrm{CR}_{8}\)), these similarities form the heatmap, as shown in Fig. 8. Warmer colors (for example, red) indicated stronger semantic links, revealing the CRs that customers often associated together. This helped prioritize fulfilling interrelated requirements in the product design, ensuring that we aligned with overlapping CRs.
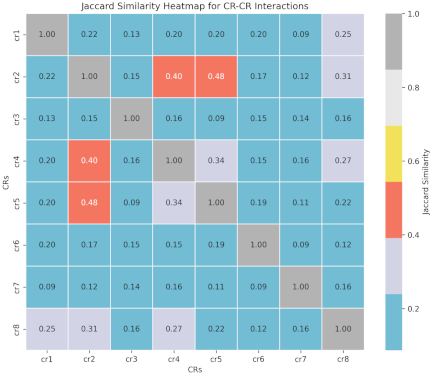
Fig. 8. Statistical results of the relationships among various CRs.
5.3. Results
Drawing on insights from the sentiment distribution (Fig. 7), requirement interaction patterns (Fig. 8), and classification statistics (Table 6), targeted product enhancements for Mechrevo Aurora X were proposed to address critical pain points and amplify competitive strengths. Focusing on high-impact categories, as presented in Table 6, where “Processor (CR2)” and “Display (CR4)” dominate customer feedback (503 and 313 mentions, respectively), the 12th gen i7 + RTX 4070 configuration in CR2, that garners positive sentiment, should be paired with refined thermal designs (for example, upgraded heatsinks or liquid metal cooling for power users) to sustain high performance. For CR4, screen defects such as dead pixels and backlight leakage can be mitigated through 100% automated optical inspection, complemented by “zero-defect” display warranties to reinforce trust in visual quality.
Critical pain points in “Internal Storage (CR3, 220 instances)” and “Software System (CR7, 215 instances)” require focused solutions. Underperforming SSDs in CR3 should be phased out, with high-speed PCIe 4.0/5.0 NVMe drives (\(>\)7,000/6,000 MB/s) sourced through partnerships, accompanied by firmware optimizations (for example, DRAM-cache integration) to reduce latency. For CR7, a dedicated “Gaming Mode” can disable conflicting background processes (for example, Windows Update) and lock stable GPU drivers, with top-cited issues (for example, blue screens) resolved within 48 hours via user-feedback loops.
Leveraging the sentiment trends, as shown in Fig. 7, strong positives in CR2 and CR5 (for example, metal chassis) can be amplified through custom finishes (for example, anodized aluminum) or RGB accents. For mixed/negative signals in CR1 and CR3, the left-side USB port should be reengineered (for example, rear placement) to fix “tight fit” issues, whereas discounted SSD upgrade kits can turn storage complaints into loyalty-building opportunities.
Aligning with requirement dependencies in the Jaccard heatmap, as shown in Fig. 8, high-correlation pairs such as CR2 \(\leftrightarrow\) CR4 and CR2 \(\leftrightarrow\) CR5 can inform “performance bundles” for example, RGB-lit vents (CR5) optimized for GPU thermals (CR2) or high-refresh displays (CR4) paired with CPU overclocking presets (CR2). Latent links such as CR1 \(\leftrightarrow\) CR8 (USB port and heat dissipation) can be addressed by relocating ports to avoid blocking air intakes, reducing thermal throttling while resolving usability issues. These data-driven adjustments, as shown in Table 6, Fig. 7, and Fig. 8, will enable Mechrevo Aurora X to resolve pain points, amplify strengths, and deliver a cohesive customer experience aligned with interconnected CR, thereby solidifying its market position.
Acknowledgments
This work was supported by the Natural Science Foundation of Guangdong Province (Project number: 2024A1515010250).
- [1] M. Zhang, L. Sun, G. A. Wang, Y. Li, and S. He, “Using neutral sentiment reviews to improve customer requirement identification and product design strategies,” Int. J. of Production Economics, Vol.254, Article No.108641, 2022. https://doi.org/10.1016/j.ijpe.2022.108641
- [2] X. Yue and Y. Kodono, “Text mining analysis of user experience in C2C e-commerce based on reviews of the flea market on App Mercari,” J. Adv. Comput. Intell. Intell. Inform., Vol.29, No.3, pp. 500-507, 2025. https://doi.org/10.20965/jaciii.2025.p0500
- [3] S. Guha and S. Kumar, “Emergence of big data research in operations management, information systems, and healthcare: Past contributions and future roadmap,” Production and Operations Management, Vol.27, No.9, pp. 1724-1735, 2018. https://doi.org/10.1111/poms.12833
- [4] M. Mameli et al., “Deep learning approaches for fashion knowledge extraction from social media: A review,” IEEE Access, Vol.10, pp. 1545-1576, 2021. https://doi.org/10.1109/access.2021.3137893
- [5] Y. Wang, L. Luo, and H. Liu, “Bridging the semantic gap between customer needs and design specifications using user-generated content,” IEEE Trans. on Engineering Management, Vol.69, No.4, pp. 1622-1634, 2022. https://doi.org/10.1109/tem.2020.3021698
- [6] I. Brace, “Questionnaire Design: How to Plan, Structure and Write Survey Material for Effective Market Research,” 4th Edition, Kogan Page, 2018.
- [7] S. Park and H. Kim, “Extracting product design guidance from online reviews: An explainable neural network-based approach,” Expert Systems with Applications, Vol.236, Article No.121357, 2024. https://doi.org/10.1016/j.eswa.2023.121357
- [8] K. Park, S. Park, and J. Joung, “Contextual meaning-based approach to fine-grained online product review analysis for product design,” IEEE Access, Vol.12, pp. 4225-4238, 2024. https://doi.org/10.1109/access.2023.3343501
- [9] X. Li, Y. Zhang, and L. Mei, “Analyzing online reviews of foreign tourists to destination attractions in china: A novel text mining approach,” Asia Pacific J. of Tourism Research, Vol.28, No.7, pp. 647-666, 2023. https://doi.org/10.1080/10941665.2023.2255315
- [10] J.-W. Bi, Y. Liu, Z.-P. Fan, and J. Zhang, “Wisdom of crowds: Conducting importance-performance analysis (IPA) through online reviews,” Tourism Management, Vol.70, pp. 460-478, 2019. https://doi.org/10.1016/j.tourman.2018.09.010
- [11] J. Büschken and G. M. Allenby, “Sentence-based text analysis for customer reviews,” Marketing Science, Vol.35, No.6, pp. 953-975, 2016. https://doi.org/10.1287/mksc.2016.0993
- [12] F. Fabiano and F. Martens, “Shifting towards smart, connected products: A business model innovation perspective,” Master’s thesis, Norwegian School of Economics, 2018.
- [13] S. Yin, Y. Wang, and S. Shafiee, “Ranking products through online reviews considering the mass assignment of features based on bert and q q-rung orthopair fuzzy set theory,” Expert Systems with Applications, Vol.213, Part C, Article No.119142, 2023. https://doi.org/10.1016/j.eswa.2022.119142
- [14] J. Kim, S. Park, and H. M. Kim, “Analysis of dynamic changes in customer sentiment on product features after the outbreak of COVID-19 based on online reviews,” J. of Mechanical Design, Vol.144, No.2, Article No.024501, 2022. https://doi.org/10.1115/1.4052789
- [15] A. S. Abrahams, J. Jiao, G. A. Wang, and W. Fan, “Vehicle defect discovery from social media,” Decision Support Systems, Vol.54, No.1, pp. 87-97, 2012. https://doi.org/10.1016/j.dss.2012.04.005
- [16] J. Joung and H. M. Kim, “Automated keyword filtering in latent Dirichlet allocation for identifying product attributes from online reviews,” J. of Mechanical Design, Vol.143, No.8, Article No.084501, 2021. https://doi.org/10.1115/1.4048960
- [17] M. Zhang, L. Sun, Y. Li, G. A. Wang, and Z. He, “Using supplementary reviews to improve customer requirement identification and product design development,” J. of Management Science and Engineering, Vol.8, No.4, pp. 584-597, 2023. https://doi.org/10.1016/j.jmse.2023.03.001
- [18] A. Choudhary and A. Arora, “Assessment of bidirectional transformer encoder model and attention based bidirectional LSTM language models for fake news detection,” J. of Retailing and Consumer Services, Vol.76, Article No.103545, 2024. https://doi.org/10.1016/j.jretconser.2023.103545
- [19] A. Griffin and J. R. Hauser, “The voice of the customer,” Marketing Science, Vol.12, No.1, pp. 1-27, 1993. https://doi.org/10.1287/mksc.12.1.1
- [20] F. Zhou, J. Ayoub, Q. Xu, and X. J. Yang, “A machine learning approach to customer needs analysis for product ecosystems,” J. of Mechanical Design, Vol.142, No.1, Article No.011101, 2020. https://doi.org/10.1115/1.4044435
- [21] T. Ferguson, M. Greene, F. Repetti, K. Lewis, and S. Behdad, “Combining anthropometric data and consumer review content to inform design for human variability,” ASME 2015 Int. Design Engineering Technical Conf. and Computers and Information in Engineering Conf., Article No.V02BT03A022, 2015. https://doi.org/10.1115/DETC2015-47640
- [22] J. Liu, Y. Zhou, X. Jiang, and W. Zhang, “Consumers’ satisfaction factors mining and sentiment analysis of B2C online pharmacy reviews,” BMC Medical Informatics and Decision Making, Vol.20, Article No.194, 2020. https://doi.org/10.1186/s12911-020-01214-x
- [23] Y. Guo, S. J. Barnes, and Q. Jia, “Mining meaning from online ratings and reviews: Tourist satisfaction analysis using latent Dirichlet allocation,” Tourism Management, Vol.59, pp. 467-483, 2017. https://doi.org/10.1016/j.tourman.2016.09.009
- [24] M. Venugopalan and D. Gupta, “An enhanced guided LDA model augmented with BERT based semantic strength for aspect term extraction in sentiment analysis,” Knowledge-Based Systems, Vol.246, Article No.108668, 2022. https://doi.org/10.1016/j.knosys.2022.108668
- [25] A. Timoshenko and J. R. Hauser, “Identifying customer needs from user-generated content,” Marketing Science, Vol.38, No.1, pp. 1-20, 2019. https://doi.org/10.1287/mksc.2018.1123
- [26] C. S. Tucker and H. M. Kim, “Trending mining for predictive product design,” J. of Mechanical Design, Vol.133, No.11, Article No.111008, 2011. https://doi.org/10.1115/1.4004987
- [27] M. Long, M. Erickson, and E. F. MacDonald, “Consideration-constrained engineering design for strategic insights,” J. of Mechanical Design, Vol.141, No.6, Article No.064501, 2019. https://doi.org/10.1115/1.4041916
- [28] Y. Zhan, R. Han, M. Tse, M. H. Ali, and J. Hu, “A social media analytic framework for improving operations and service management: A study of the retail pharmacy industry,” Technological Forecasting and Social Change, Vol.163, Article No.120504, 2021. https://doi.org/10.1016/j.techfore.2020.120504
- [29] M. Zhang, B. Fan, N. Zhang, W. Wang, and W. Fan, “Mining product innovation ideas from online reviews,” Information Processing & Management, Vol.58, No.1, Article No.102389, 2021. https://doi.org/10.1016/j.ipm.2020.102389
- [30] Q. Fan, H. Huang, J. Guan, and R. He, “Rethinking local perception in lightweight vision transformer,” arXiv:2303.17803, 2023. https://doi.org/10.48550/arXiv.2303.17803
- [31] H. Wang et al., “TokenFormer: Rethinking transformer scaling with tokenized model parameters,” arXiv:2410.23168, 2024. https://doi.org/10.48550/arXiv.2410.23168
- [32] K. Ertürk, F. Altınışık, İ. Sarıaltın, and Ö. N. Gerek, “TSLFormer: A lightweight transformer model for Turkish sign language recognition using skeletal landmarks,” arXiv:2505.07890, 2025. https://doi.org/10.48550/arXiv.2505.07890
- [33] D. Zhang, Z. Shen, and Y. Li, “Requirement analysis and service optimization of multiple category fresh products in online retailing using importance-Kano analysis,” J. of Retailing and Consumer Services, Vol.72, Article No.103253, 2023. https://doi.org/10.1016/j.jretconser.2022.103253
- [34] J.-W. Bi, Y. Liu, Z.-P. Fan, and E. Cambria, “Modelling customer satisfaction from online reviews using ensemble neural network and effect-based Kano model,” Int. J. of Production Research, Vol.57, No.22, pp. 7068-7088, 2019. https://doi.org/10.1080/00207543.2019.1574989
- [35] H. Sun, W. Guo, L. Wang, and B. Rong, “An analysis method of dynamic requirement change in product design,” Computers & Industrial Engineering, Vol.171, Article No.108477, 2022. https://doi.org/10.1016/j.cie.2022.108477
- [36] Q. Meng and J. Dong, “Future direction and visual analysis of Kano model: A literature review,” J. of Service Science and Management, Vol.11, No.4, pp. 399-413, 2018. https://doi.org/10.4236/jssm.2018.114028
- [37] Y. Huang et al., “Combining deep learning with knowledge graph for design knowledge acquisition in conceptual product design,” CMES – Computer Modeling in Engineering and Sciences, Vol.138, No.1, pp. 167-200, 2023. https://doi.org/10.32604/cmes.2023.028268
- [38] A. Liu, D. Zhang, Y. Wang, and X. Xu, “Knowledge graph with machine learning for product design,” CIRP Annals, Vol.71, No.1, pp. 117-120, 2022. https://doi.org/10.1016/j.cirp.2022.03.025
- [39] S. Sarica, J. Luo, and K. L. Wood, “TechNet: Technology semantic network based on patent data,” Expert Systems with Applications, Vol.142, Article No.112995, 2020. https://doi.org/10.1016/j.eswa.2019.112995
- [40] Q. Zhou, Z. Xu, and N. Y. Yen, “User sentiment analysis based on social network information and its application in consumer reconstruction intention,” Computers in Human Behavior, Vol.100, pp. 177-183, 2019. https://doi.org/10.1016/j.chb.2018.07.006
- [41] Y. Wang, X. Lu, and Y. Tan, “Impact of product attributes on customer satisfaction: An analysis of online reviews for washing machines,” Electronic Commerce Research and Applications, Vol.29, pp. 1-11, 2018. https://doi.org/10.1016/j.elerap.2018.03.003
- [42] M. S. Farooq, M. Salam, A. Fayolle, N. Jaafar, and K. Ayupp, “Impact of service quality on customer satisfaction in Malaysia airlines: A PLS-SEM approach,” J. of Air Transport Management, Vol.67, pp. 169-180, 2018. https://doi.org/10.1016/j.jairtraman.2017.12.008
- [43] A. Ahmad, L. Dey, and S. M. Halawani, “A rule-based method for identifying the factor structure in customer satisfaction,” Information Sciences, Vol.198, pp. 118-129, 2012. https://doi.org/10.1016/j.ins.2012.02.056
- [44] M. N. Imtiaz and M. K. B. Islam, “Identifying significance of product features on customer satisfaction recognizing public sentiment polarity: Analysis of smart phone industry using machine-learning approaches,” Applied Artificial Intelligence, Vol.34, No.11, pp. 832-848, 2020. https://doi.org/10.1080/08839514.2020.1787676
- [45] Q. Zhao, W. Zhao, X. Guo, K. Zhang, and M. Yu, “A dynamic customer requirement mining method for continuous product improvement,” Autonomous Intelligent Systems, Vol.2, No.1, Article No.14, 2022. https://doi.org/10.1007/s43684-022-00032-4
- [46] X. Li, Y. Lei, and S. Ji, “BERT- and BiLSTM-based sentiment analysis of online Chinese buzzwords,” Future Internet, Vol.14, No.11, Article No.332, 2022. https://doi.org/10.3390/fi14110332
- [47] M. M. Rahman, A. I. Shiplu, Y. Watanobe, and M. A. Alam, “RoBERTa-BiLSTM: A context-aware hybrid model for sentiment analysis,” IEEE Trans. on Emerging Topics in Computational Intelligence, Vol.9, No.6, pp. 3788-3805, 2025. https://doi.org/10.1109/TETCI.2025.3572150
- [48] Z. Li, X. Yang, L. Zhou, H. Jia, and W. Li, “Text matching in insurance question-answering community based on an integrated BiLSTM-TextCNN model fusing multi-feature,” Entropy, Vol.25, No.4, Article No.639, 2023. https://doi.org/10.3390/e25040639
- [49] J. Deng, L. Cheng, and Z. Wang, “Attention-based BiLSTM fused CNN with gating mechanism model for Chinese long text classification,” Computer Speech & Language, Vol.68, Article No.101182, 2021. https://doi.org/10.1016/j.csl.2020.101182
- [50] J. Hu, L. Shen, and G. Sun, “Squeeze-and-excitation networks,” 2018 IEEE/CVF Conf. on Computer Vision and Pattern Recognition, pp. 7132-7141, 2018. https://doi.org/10.1109/CVPR.2018.00745
- [51] B. Peng, K. Han, L. Zhong, S. Wu, and T. Zhang, “A head-to-head attention with prompt text augmentation for text classification,” Neurocomputing, Vol.595, Article No.127815, 2024. https://doi.org/10.1016/j.neucom.2024.127815
- [52] J. Zhang et al., “Fengshenbang 1.0: Being the foundation of Chinese cognitive intelligence,” arXiv:2209.02970, 2022. https://doi.org/10.48550/arXiv.2209.02970
This article is published under a Creative Commons Attribution-NoDerivatives 4.0 Internationa License.