Research Paper:
YOLO-CF: An Object Detection Model that Improves Feature Expression at Both Coarse-Grained and Fine-Grained Levels for Industrial Surface Image Defect Detection
Zhaowei Sun*1,†, Jintao Chen*2, Cong Lin*3, Xuebin Yue*4
 , Kuozhan Wang*4, and Lin Meng*5
*1Henan Huadong Industrial Control Technology Company Ltd.
No.5 Wutong West Street, High-New Technology Development Zone, Zhengzhou, Henan 450000, China
†Corresponding author
*2The First Affiliated Hospital of Henan University of Chinese Medicine
No.19 Renmin Road, Jinshui, Zhengzhou, Henan 450046, China
*3Hanwei Electronics Group Corporation
No.169 Xuesong Road, National High-Tech Zone, Zhengzhou, Henan 450001, China
*4School of Automation and Electrical Engineering, Zhongyuan University of Technology
No.41 Zhongyuan Middle Road, Zhongyuan, Zhengzhou, Henan 450007, China
*5College of Science and Engineering, Ritsumeikan University
1-1-1 Nojihigashi, Kusatsu, Shiga 525-8577, Japan

In industrial surface defect detection, enhancing the model’s capability to express features at both coarse-grained and fine-grained levels is crucial. Accordingly, this paper proposes YOLO Coarse and Fine (YOLO-CF), a novel object detection model that significantly enhances feature expression by integrating innovative feature fusion strategies with an improved network architecture. YOLO-CF incorporates Res2Net and Res2Net block modules, notably improving the expression of fine-grained features without increasing computational complexity. Additionally, this model introduces a multi-scale feature fusion module, which seamlessly integrates coarse and fine-grained information by combining top-down and bottom-up pathways. This enhancement effectively expands the perceptual range and significantly improves the model’s generalization capability, making YOLO-CF a powerful tool for detecting diverse defects in complex industrial images. A hybrid downsampling module is introduced, combining max pooling, average pooling, and convolution operations with a stride of 2 to provide richer feature representations. In the GC10-DET dataset, YOLO-CF achieved a mean average precision (mAP) of 59.09%, surpassing the second-ranked RetinaNet by 3.41 percentage points. On the PCB, crack, NEU-DET and Dish-20 public datasets, YOLO-CF achieved mAPs of 97.38%, 84.72%, 73.35%, and 99.54%, at IoU =0.5, respectively. The experimental results indicate that by integrating feature extraction at both coarse-grained and fine-grained levels, YOLO-CF effectively enhances the model’s ability to detect objects of various sizes in complex scenes, demonstrating significant performance improvements. The code is available at http://www.ihpc.se.ritsumei.ac.jp/obidataset.html.
YOLO-CF dual-level feature framework
1. Introduction
As one of the core problems in computer vision, object detection directly influences the effectiveness and reliability of various application domains 1, including intelligent surveillance 2, autonomous driving 3, robotic vision 4, Internet of Things applications 5,6, anomaly detection 7,8, and the preservation of cultural heritage 9,10. Although traditional object detection techniques recognize objects under a broad range of conditions, these methods often struggle to express details in complex or dynamic environments. Particularly, the capture and fusion of coarse-grained features (such as overall shape and category information) and fine-grained features (such as textures and local details) are often challenging to balance with existing technologies, which limits the application scope and robustness of the models 11.
In this context, developing object detection technology that enhances both coarse-grained and fine-grained feature expressions is particularly crucial. Coarse-grained features help summarize objects’ main attributes and categories quickly 12. In contrast, fine-grained features provide more detailed information, vital for recognizing similar objects, handling occlusions, and enhancing the adaptability of models in diverse environments 13. Therefore, optimizing the expression of the two-type features improves the accuracy of object detection techniques and enhances their practicality and flexibility in real-world applications.
Notably, besides supervised object detection, unsupervised anomaly detection has gained significant attention in industrial surface defect inspection 14,15. Such methods typically rely solely on normal samples and identify anomalies through reconstruction errors or feature deviations. While requiring minimal labeled data, these approaches are prone to overfitting normal patterns, struggle to detect subtle defects, lack precise bounding box localization, and exhibit limited stability under varying lighting and texture conditions. Therefore, supervised detection methods with precise localization capabilities remain more suitable for industrial defect scenarios, further highlighting the necessity of enhancing both coarse-grained and fine-grained feature representations.
This study develops an innovative detection model named YOLO Coarse and Fine (YOLO-CF) to address the challenges of integrating coarse-grained and fine-grained features in object detection. The model initially utilizes the Res2Net 16 architecture and the Res2Net block to enhance the expression of fine-grained features, allowing YOLO-CF to capture image details and textures more precisely, thereby significantly improving the ability to recognize small objects and details in complex scenes without increasing computational complexity. Additionally, integrating information flows from top-down and bottom-up approaches through the multi-scale feature fusion (MFF) module further strengthens the model’s feature expression capabilities. In the downsampling phase, by concatenating average pooling, max pooling, and convolution operations with a stride of 2, YOLO-CF effectively utilizes the advantages of various pooling strategies and convolution operations, greatly enhancing the ability to capture objects of different scales and morphologies, thereby significantly boosting the model’s generalization ability and accuracy. This comprehensive structural design endows YOLO-CF with the ability to maintain high detection speeds while demonstrating exceptional performance and strong adaptability in complex environments. Overall, the specific contributions are as follows.
-
YOLO-CF is an object detection model based on Res2Net modules and pooling operations, designed to enhance feature representation at both coarse-grained and fine-grained levels, thereby improving the accuracy and precision of object detection.
-
We design a downsampling module that integrates various pooling and convolution operations, enhancing feature representation and boosting the model’s robustness and generalization capabilities. This allows for better adaptation to variations and noise across data types.
-
We design an MFF module to capture and integrate features of various scales and levels within images. This module combines top-down and bottom-up information flows to integrate coarse-grained and fine-grained information effectively.
The rest of this article is organized as follows. The related works are discussed in Section 2. The details of the proposed method are introduced in Section 3. Section 4 presents the implementation details, datasets, results, discussion, and future work. Section 5 concludes the paper.
2. Related Work
2.1. Object Detection
Object detection, a cornerstone task in computer vision, has evolved significantly by introducing various innovative models and techniques. These methods are broadly categorized into one-stage and two-stage object detection methods.
Two-stage object detection: Two-stage methods focus primarily on accuracy and involve a preliminary step of generating candidate regions followed by classification and localization. The region-based convolutional neural networks (R-CNN) family is pivotal in this category. The original R-CNN model 17 uses a selective search to extract candidate regions and then employs CNNs for feature extraction, along with support vector machines for classification and bounding box regression. Advancing this approach, Faster R-CNN 18 introduces the region proposal network, which directly generates candidate boxes and employs ROI pooling to enhance feature extraction, significantly speeding up the detection process while maintaining high accuracy.
One-stage object detection: In contrast, one-stage methods simplify the object detection pipeline by eliminating the region proposal stage, aiming to perform object localization and classification in a single step. This approach is renowned for simplicity and efficiency. RetinaNet 19, a notable model in this category, addresses the challenge of class imbalance in object detection by introducing the focal loss function, which enhances both the accuracy and robustness of the detection. The YOLO series, including YOLOv3 and YOLOv4 20,21, epitomizes this category by converting the detection task into a regression problem, achieving real-time performance. The development within the YOLO series continues robustly, with newer models like YOLOv5, YOLOX 22, and YOLOv7 1 emerging, each introducing improvements in speed, accuracy, and adaptability to various detection scenarios.
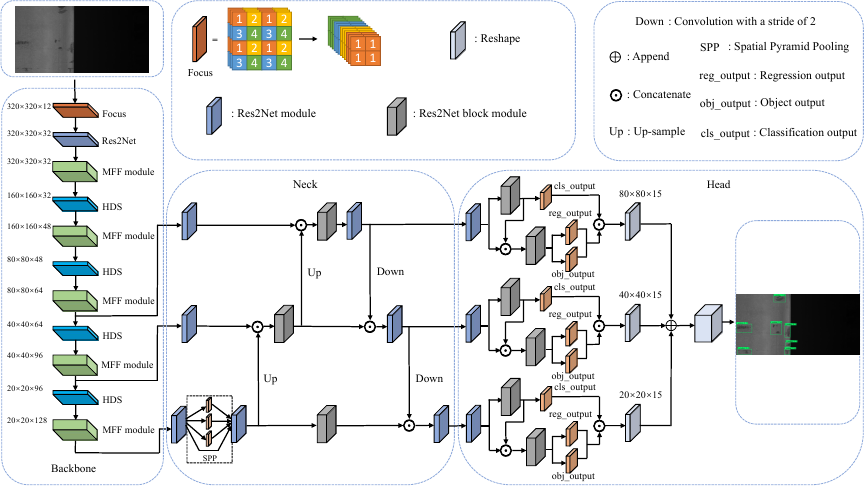
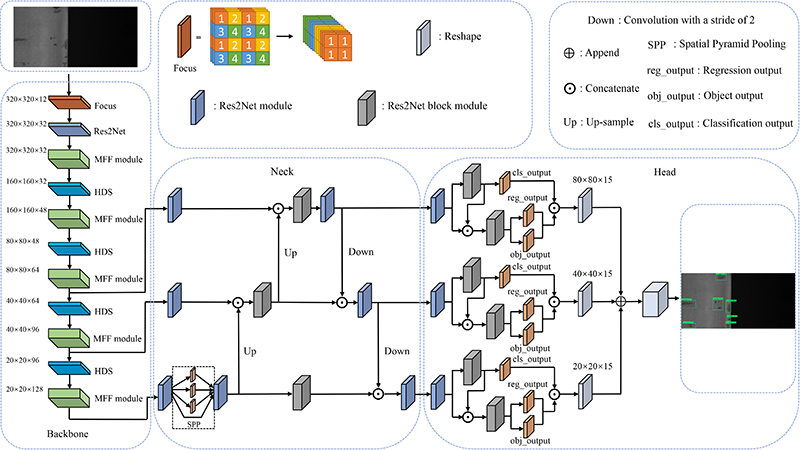
Fig. 1. The overall framework of YOLO-CF. The focus is to slice the image and perform a double downsampling feature map without information loss. Reshape is to adjust the feature map. The spatial pyramid pooling (SPP) uses the MaxPooling operation with sizes 5, 9, and 13. Up is an upsampling operation using nearest neighbor interpolation. Down is a convolution operation with a stride of 2.
2.2. Pooling Operation
Pooling operations play a crucial role in object detection. They help reduce the dimensionality of feature maps, thereby improving computational efficiency while preserving essential spatial hierarchies of features. Additionally, pooling aids in the optimization process by mitigating overfitting and enhancing the model’s translation invariance 23.
In applying pooling operation, Hou et al. 24 introduce a new strip pooling strategy that redefines spatial pooling using elongated kernels (such as \(1 \times N\) or \(N \times 1\)) and designs corresponding architectures to model long-range dependencies efficiently. Wu et al. 25 introduce the pyramid pooling Transformer, an enhanced vision transformer that incorporates pyramid pooling into multi-head self-attention to reduce sequence length and effectively capture contextual features, demonstrating significant performance improvements across various vision tasks. Gao et al. 26 propose a novel local importance-based pooling layer to enhance discriminative features during downsampling by learning adaptive importance weights from inputs, leading to consistent improvements in model performance on ImageNet and MS COCO datasets. Xu et al. 27 propose a novel graph pooling technology, geometric pooling, which maintains negative-value nodes by measuring feature similarity, ensuring more representative information is retained during pooling.
2.3. Feature Fusion
Different levels of features contain unique information distributions. Shallow features provide high-resolution spatial structure information but are relatively weak in capturing global context. In contrast, deep features are rich in advanced semantic information that aids in accurate object localization, but due to the lower resolution, these features lack detailed spatial details of the object. Therefore, to comprehensively capture an object’s characteristics, an effective integration of shallow and deep features is necessary.
Chen et al. 28 propose the high-resolution feature pyramid network, which improves the detection of small-scale objects and minimizes feature redundancy through advanced modules for feature alignment, fusion, and multi-scale prediction. Li et al. 29 present a method called the two-way feature pyramid network, which enhances feature fusion by combining maps generated from different directions and resolutions. This design improves both low-level feature utilization and the reuse of backbone features, leading to better feature extraction. Hu et al. 30 introduce the YOLO3-SM method, which incorporates a saliency map into YOLO to enhance feature fusion. The saliency map selects the grid cell containing the most salient part of the object rather than just the grid cell with the object’s center, allowing for more effective feature fusion and improved detection performance. Xu et al. 31 propose a method to locate multiple components in catenary systems by enhancing the YOLO-based framework, improving feature fusion through a novel “gather-and-distribute” mechanism, and incorporating Wasserstein distance loss to boost small object detection capabilities.
3. Methodology
3.1. Overall Framework of YOLO-CF
The structure of YOLO-CF, as shown in Fig. 1, comprises three parts: the backbone, neck, and YOLO head. The backbone is the foundation of the entire network and is responsible for extracting high-level features from the input image, which are subsequently used for object detection. The neck primarily processes and optimizes the features extracted by the backbone. The YOLO head uses the feature maps processed by the neck to predict classes and bounding boxes 32. The following provides a detailed introduction to these three components of YOLO-CF.
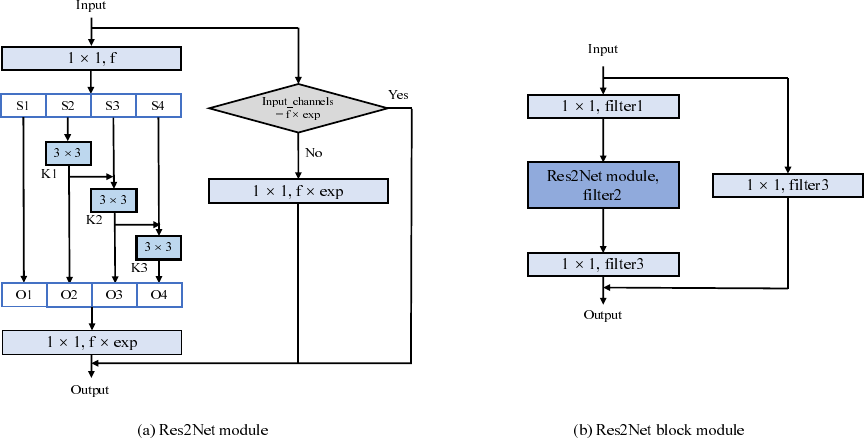
Fig. 2. The structure of the Res2Net and Res2Net block modules. The groups of convolution operation \(s\) is 4. \(f\) denotes the number of channels, and \(exp\) means the multiple of channel expansion.
Backbone: The left side of Fig. 1 shows the backbone structure. First, the input image is sliced and reorganized by focus operation to reduce the amount of calculation by reducing the image size. Then, the Res2Net operation extracts features at a fine-grained level to capture more detailed image information. Subsequently, the MFF module and HD module extract features at both coarse-grained and fine-grained levels and perform dimensionality reduction operations to extract more useful feature information. The final output of backbone is three feature maps of different scales, which are passed to the neck network for further processing and optimization. Through this structured approach, backbone efficiently captures and processes various feature details, thereby improving the overall performance of the YOLO-CF model.
In this work, Res2Net is adopted as the backbone because its hierarchical channel-splitting and feature reorganization mechanism enables fine-grained, multi-scale feature representation while maintaining low computational overhead. This makes it particularly suitable for real-time industrial detection scenarios that require both efficiency and accuracy. By contrast, Swin Transformer offers strong global modelling capabilities, but its self-attention structure introduces considerably higher computational and memory costs, rendering it impractical for deployment on resource-constrained industrial devices or edge platforms. The bidirectional feature pyramid network primarily enhances feature fusion at the neck stage, but does not directly improve fine-grained feature extraction within the backbone. This limits its ability to meet the refined representation requirements of this study. Taking these factors into account, Res2Net strikes a better balance between feature expressiveness, model complexity, and inference speed, aligning more closely with the overall design objectives of YOLO-CF.
Neck: The neck structure is shown in the middle of Fig. 1 and plays a vital role in the object detection network. It is mainly responsible for promoting feature fusion and information transmission. Based on the design principle of PANet 33, this structure seamlessly integrates the bottom-up and top-down paths, effectively fusing feature information at different levels to enhance detection performance. In the neck structure, we use Res2Net and Res2Net block modules to enhance the representation of fine-grained features during the feature fusion process. In the bottom-level output part, the SPP 34 module is added to handle the input image’s different scales and shapes effectively, further enhancing the network’s feature extraction capabilities.
Head: YOLO-CF uses the anchor-free YOLO head method, as shown on the right side of Fig. 1. This method achieves object detection by predicting the target’s center point and the offset of the bounding box, making the model more flexible and better able to adapt to targets of different sizes and scales. In addition, a dynamic head mechanism is introduced, which dynamically adjusts the structure of the detection head according to the size of the input image and the target, thereby improving the detection performance for targets across different scales.
In YOLO head, we add Res2Net and Res2Net block modules to provide a more prosperous and diverse feature representation for the final prediction, enhancing the model’s adaptability to object detection tasks. In the input part of YOLO head, after the classification network extracts features, the features are sent to the final classification and regression networks, respectively, which enhances the feature reuse capability and reduces the number of parameters.
3.2. Overall Framework of Res2Net and Res2Net Block Modules
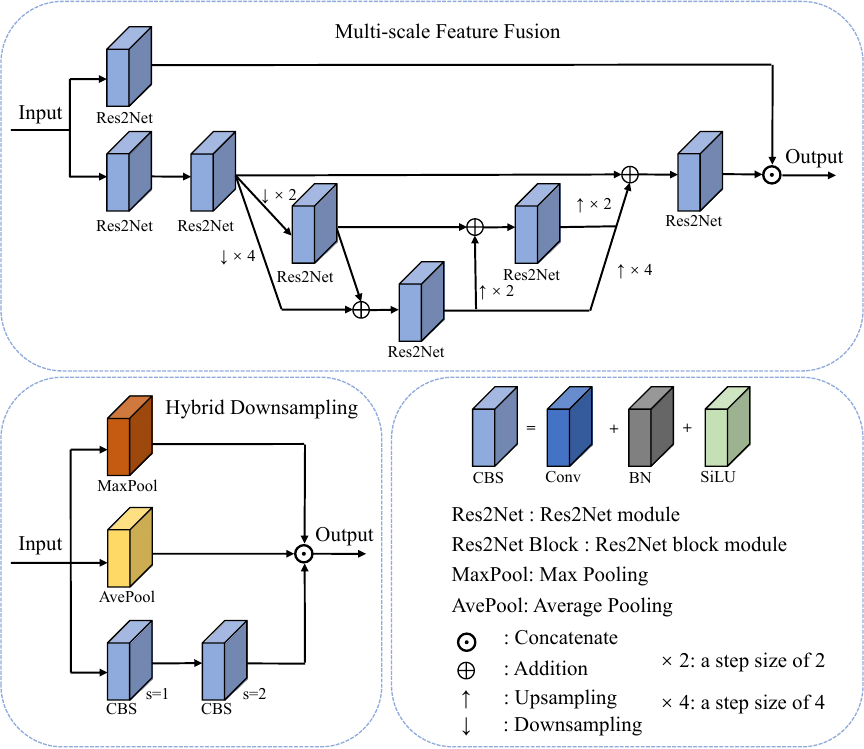
Fig. 3. The structure of the MFF module. ↑: Upsampling represents upsampling, achieved through the resize operation. ↓: Downsampling denotes the average pooling operation. \(s\) represents the step size.
To effectively extract features at a fine-grained level, YOLO-CF uses the Res2Net module. This module represents multi-scale features at a fine-grained level by constructing hierarchical residual-like connections within a single residual block. It increases the receptive field range of each network layer, as shown in Fig. 2(a). First, a \(1 \times 1\) convolution operation divides the features into \(s\) subsets, denoted as \(S_{i}\), where \(i \in \left\{1,2,\ldots,s\right\}\). In each subset, the number of channels is \(1/s\) of the original, and the feature map size is consistent with the original input. The feature subset \(S_{1}\) is directly output without any operation, while the remaining feature subsets \(S_{i}\) undergo a convolution operation with a 3 \(\times\) 3 kernel size and a dilation rate of \(d\), denoted as \({F}_{i}^{d}\). The output of \({F}_{i}^{d}\) is defined as \(O_{i}\). In this process, the feature subset \(S_{i}\) is added to \({F}_{i-1}^{d}\), and the result is sent to \({F}_{i}^{d}\) for further processing 35. The output \(O_{i}\) can be expressed as:
Each 3 \(\times\) 3 convolution operation \({F}_{i}^{d}\) takes into account all preceding feature map subsets. Additionally, by applying a 3 \(\times\) 3 convolution with a dilation rate of \(d\), the output achieves a larger receptive field than \(S_{i}\). The output of the Res2Net module thus encompasses feature maps with varying numbers, sizes, and receptive fields.
A Res2Net block module is proposed, as illustrated in Fig. 2(b). Initially, a 1 \(\times\) 1 convolution operation is used to alter the dimension of the input feature map. Subsequently, the Res2Net module performs multi-scale feature extraction. Finally, another 1 \(\times\) 1 convolution operation is applied to expand the dimension. Additionally, a shortcut connection using a 1 \(\times\) 1 convolution operation links the input and output, dynamically adjusting the model’s complexity to ensure normal back-propagation of gradients.
3.3. MFF Module
This paper introduces a novel MFF module that revolutionizes feature representation at coarse and fine-grained levels, as depicted in Fig. 3. The initial step involves utilizing the structure of CSPNet to partition the input features into two segments. One segment directly employs Res2Net for finer-grained multi-scale feature extraction. After extracting multi-scale features through Res2Net, the other segment undergoes average pooling operations with different strides to provide multi-level feature representation.
In the average pooling branches with different strides, the Res2Net operations mitigate the aliasing effects caused by downsampling and upsampling. This allows for the interaction and integration of information across different scales and levels, similar to PANet’s top-down and bottom-up structures. The bottom-up pathway captures lower-level features and passes them to higher levels. In contrast, the top-down pathway leverages upper-level semantic information to guide and adjust the processing of lower-level features through feedback pathways, ensuring a comprehensive and effective feature representation.
Ultimately, the two segments of the CSPNet structure are merged to ensure the integration of information from different scales, thereby augmenting feature dimensions and significantly enhancing the model’s representation ability and accuracy. This innovative approach promises substantial benefits in computer vision and deep learning.
3.4. Hybrid Downsampling
In object detection tasks, downsampling is frequently used in feature map processing to reduce the number of parameters and computational costs. Standard methods include average pooling, max pooling, and convolution with a stride of 2. Each method has advantages and captures different types of feature information. To fully leverage the strengths of these three methods, this paper proposes a new downsampling module called “hybrid downsampling.” This module applies average pooling, max pooling, and convolution with a stride of 2 and then concatenates their outputs to form a comprehensive feature representation, as shown in Fig. 3.
Specifically, we consider \(X \in \mathbb{R}^{H \times W \times C}\) as the input feature, where \(H\), \(W\), and \(C\) represent the height, width, and channels, respectively. Max pooling is described by Eq. \(\eqref{eq:MP}\), average pooling by Eq. \(\eqref{eq:AvP}\), and HD by Eq. \(\eqref{eq:HD}\). This design offers several advantages. First, it enriches feature representation: average pooling smooths the feature map and suppresses noise, max pooling retains important edges and details, and convolution with a stride of 2 captures local spatial features. By combining these methods, the module generates a more diverse and comprehensive set of features. Second, it enhances information integration: concatenating the outputs of these different downsampling methods integrates the features captured by each method, enhancing the diversity and richness of the feature set. Finally, it improves robustness: since these downsampling methods have different sensitivities to image transformations, such as rotation and scaling, their combination improves the model’s robustness to such transformations, resulting in more stable performance across different scenarios. This combined downsampling approach significantly enhances the model’s feature extraction capabilities and accuracy.
3.5. Loss Function
The loss function of YOLO-CF is divided into three parts: classification loss, regression loss, and object loss, which can be expressed as:
The classification and object loss is calculated using binary cross entropy (BCE) loss. BCE is a widely used loss function for binary classification problems. The calculation equation is as follows:
YOLO-CF employs structured intersection over union (SIoU) as the loss function for the regression loss. SIoU is an improved version of the IoU loss function, designed to more accurately measure the overlap between the predicted and ground truth bounding boxes, particularly when targets have varying scales and shapes 35, and can be expressed as:
The SIoU includes four parts, angle cost, distance cost, shape cost, and IoU cost, which can be formulated as:
The angular cost is calculated as follows:
The term \(C_{h}\) represents the height difference between the ground truth bounding box and the predicted bounding box’s center point. \(\sigma\) denotes the distance between the center points of the ground truth bounding box and the predicted bounding box. The coordinates \(b_{c_{x}}^{gt}\) and \(b_{c_{y}}^{gt}\) refer to the center point of the ground truth bounding box, while \(b_{c_{x}}\) and \(b_{c_{y}}\) are the center point coordinates of the predicted bounding box. It should be noted that the angle cost is zero when \(\alpha\) equals \({1/2}\) or 0. During training, if \(\alpha\) is less than \({1/4}\), the objective is to minimize \(\alpha\); otherwise, the goal is to minimize \(\beta\).
The distance cost is as follows:
\(C_{W}\) and \(C_{H}\) represent the width and height of the minimum bounding rectangle that encompasses both the ground truth and the predicted bounding boxes. The parameter \(\gamma\) prioritizes the distance value as the angle increases.
The shape cost is as follows:
The \((w,h)\) and \((w^{gt},h^{gt})\) correspond to the width and height of the predicted bounding box and the ground truth bounding box, respectively. The parameter \(\theta\) regulates the emphasis placed on the shape cost.
4. Evaluation
4.1. Implementation Details
All experiments use an i9-10900 CPU with a single NVIDIA GeForce RTX 3090 GPU. The operating system is Ubuntu 21.04, with CUDA version 11.4 and the GPU acceleration library cuDNN 8.2.4. To ensure the reproducibility and comparability of the results, all models discussed in this paper are reproduced using TensorFlow to replicate the official code.
The epoch is set to 300 in all experiments, and the batch size is set to 8. We employ the Mosaic and Mixup data augmentation techniques, a strategic choice that combines multiple images and mixed pixel values to generate new training samples. This approach enhances the robustness and generalization ability of the model, a key consideration in our experimental setup. Data augmentation is used for the first 210 epochs but is stopped for the last 90 epochs to prevent over-augmentation. The confidence threshold is set to 0.5 during evaluation, and the IoU threshold for non-maximum suppression is set to 0.3. All models are trained using the Adam optimizer with parameters \(\beta_{1}\) = 0.937 and \(\beta_{2}\) = 0.999. The learning rate is adjusted using a warm-up cosine annealing schedule, gradually increasing from 4e-6 to the initial setting of 1e-3 in the first five epochs and then decreasing according to a cosine curve, with a minimum learning rate of 1e-5 36.
4.2. Datasets
We have applied four datasets to measure the proposal’s performance.
GC10-DET: The GC10-DET public dataset comprises 2,294 images derived from actual industrial environments specifically tailored for detecting defects on metallic surfaces 37. This dataset is categorized into ten different types of defects. It is divided as follows: 1,857 images are designated for training purposes, 207 are meant for validation, and 230 are set aside for testing.
PCB: The PCB public dataset includes 693 synthetic images designed explicitly for defect detection tasks on printed circuit boards (PCBs) 38. These images are organized into six different defect categories. The distribution of images includes 560 for training, 63 for validation, and 70 for testing. Notably, the image defects are digitally created using Photoshop, a graphic editing tool developed by Adobe Systems.
Crack: The crack public dataset is an object detection dataset specifically annotated for detecting cracks in concrete 39. It includes 996 images, all categorized under a single class. The dataset is divided into 879 images designated for training, 80 for validation, and 37 for testing.
NEU-DET: The NEU-DET public dataset includes 1,800 images that depict six different types of surface defects in hot rolled strip images 40. The dataset is segmented into 1,458 images for training, 162 for validation, and 180 for testing.
Dish-20: The Dish-20 dataset comprises 506 images with 20 classes of dishes 36. The dataset is divided into 409 images designated for training, 46 for validation, and 51 for testing.
4.3. Evaluation Metrics
This study uses precision, recall, average precision (AP), and mean average precision (mAP) as the main indicators to evaluate object detection performance.
Precision is defined as the proportion of positive samples among those predicted by the model. The calculation equation is as follows:
Recall is defined as the proportion of positive samples that are correctly predicted by the model as positive. The calculation equation is as follows:
AP measures the detection performance of a single category by calculating the area under the precision–recall curve. The calculation equation is:
The mAP is the average value of AP of all categories, which is used to measure the overall detection performance of the model on multiple categories, which is as follows:
In this study, the evaluation indicators in the COCO API are used to evaluate the performance of the object detection model 35. These indicators include:
-
\(\textit{AP}_{11}\) (AP at IoU from 0.5 to 0.95 in stride of 0.05).
-
\(\textit{AP}_{50}\) (AP at IoU\(=0.5\)).
-
\(\textit{AP}_{75}\) (AP at IoU\(=0.75\)).
-
\(\textit{AP}_{s}\) (AP for small objects: area \(<\) 1024).
-
\(\textit{AP}_{m}\) (AP for medium objects: 1024 \(<\) area \(<\) 9216).
-
\(\textit{AP}_{l}\) (AP for large objects: area \(>\) 9216).
-
\(AR_{s}\) (\(AR\) for small objects: area \(<\) 1024).
-
\(AR_{m}\) (\(AR\) for medium objects: 1024 \(<\) area \(<\) 9216).
-
\(AR_{l}\) (\(AR\) for large objects: area \(>\) 9216).
4.4. Performance Comparison
Table 1. Comparison with other SOTA models on GC10-DET. \(\mathit{Input\,Res.}\) indicates the resolution size of the input image. Param. is the number of parameters contained in the network.

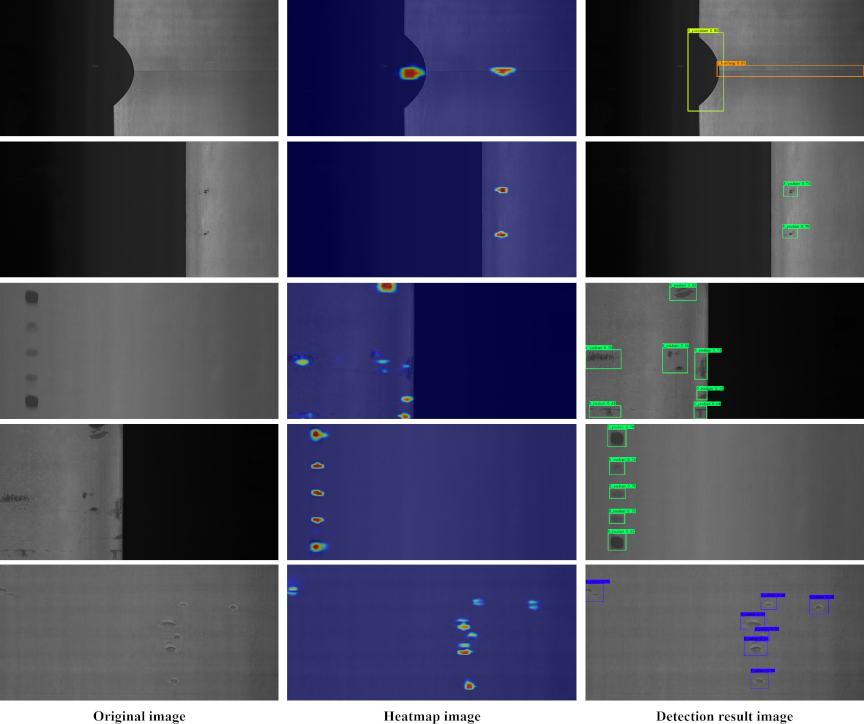
Fig. 4. Visualization results of YOLO-CF.
4.4.1. Comparison with State-of-the-Art (SOTA) Models on GC10-DET Dataset
To validate the performance of YOLO-CF, we conduct comparisons with 20 SOTA models on the publicly available dataset GC10-DET. These comparisons involved various models, including Faster-RCNN with different backbone networks 18, EfficientDet 41, RetinaNet 19, SSD 42, YOLOv3 20, YOLOv4 series 21, YOLOv5 series, YOLOX series 22, and YOLOv7 series 1. Comparative metrics included FLOPs, number of model parameters, model weight size, inference speed, and accuracy-related parameters detailed in Subsection 4.3. To facilitate a fair comparison, we standardized the input resolution to 640 \(\times\) 640 \(\times\) 3. In contrast, the Faster-RCNN model utilizes a resolution of 600 \(\times\) 600 \(\times\) 3, and the SSD model employs a resolution of 500 \(\times\) 500 \(\times\) 3, both as specified in their official releases.
The evaluation results are presented in Table 1. YOLO-CF achieved the highest mAP of 59.09%, surpassing the second-ranked RetinaNet by 3.41 percentage points. This performance advantage is not just theoretical; YOLO-CF’s significant computational efficiency, requiring only a quarter of the FLOPs and one-fifth of the parameter count and model weight size compared to RetinaNet, translates into real-world benefits. Regarding inference speed, YOLO-CF achieved 30.86 frames per second (fps), 10.16 fps faster than RetinaNet. This performance advantage underscores YOLO-CF’s effectiveness in handling real-time processing tasks while maintaining a compact model architecture, making it a robust solution for applications demanding high accuracy and efficiency.
In object detection, \(\textit{AP}_m\) and \(\textit{AP}_l\) measure the average precision for medium and large-sized targets, while \(\textit{AP}_m\) and \(\textit{AP}_l\) represent the average recall for these categories. The YOLO-CF model significantly outshines competitors by achieving top marks in both recall and precision for medium and large objects. This superior performance ensures that the model detects and accurately classifies medium and large targets, enhancing reliability and effectiveness across diverse object sizes.
Compared with the advanced models, YOLOv5-Nano has lower FLOPs, fewer parameters, and smaller model weight than YOLO-CF, and it significantly surpasses YOLO-CF in inference speed, achieving higher processing efficiency. However, the mAP is only 41.29%, 17.8 percentage points lower than YOLO-CF. Similarly, YOLOv4-Tiny also exhibits lower FLOPs, parameters, and model weight compared to YOLO-CF and has a significant advantage in inference speed, but the mAP is only 52.18%, 6.91 percentage points lower than YOLO-CF. The same applies to YOLOX-Tiny, which also has lower FLOPs, parameters, and model weight than YOLO-CF, with a much higher inference speed, yet the mAP is only 44.25%, 14.84 percentage points lower.
In contrast, other SOTA models have higher FLOPs, more parameters, and heavier model weights than YOLO-CF and achieve lower mAPs. These results highlight the advantages of YOLO-CF in maintaining model efficiency and processing speed while significantly enhancing detection accuracy, demonstrating the potential value and effectiveness in practical applications.
4.4.2. Visualization Results
To enhance understanding and share insights into model performance, we visualize the results using three types of images as referenced in the figure: the original image, a heatmap, and the detection results image, as shown in Fig. 4. The original image presents the actual input scene, providing a clear background for observers. The heatmap highlights the areas where the model focuses during detection, offering an intuitive view of how the model recognizes and locates targets within the image. Bright areas on the heatmap mark the locations where the model predicts the presence of objects, typically concentrating around the core areas of the targets. These visual cues demonstrate the model’s keen ability to perceive objects’ central positions and reflect high localization precision. Visualizing the results in this manner is highly effective for understanding the behavior and efficiency of the model when processing complex images.
The middle column of Fig. 4 shows that YOLO-CF significantly effectively extracts and integrates target features. The heatmap illustrates the heat distribution of all detection results, and these distributions are reasonable. In the final detection results, both the bounding boxes and confidence levels achieved satisfactory outcomes. These results demonstrate that YOLO-CF has high performance and reliability in focusing on target locations and accurate recognition.
4.4.3. Comparison with SOTA Models on Other Public Datasets
Table 2. Comparison with other SOTA models on public datasets. \(\mathit{Input\,Res.}\) indicates the resolution size of the input image.

Table 3. Comparison with other SOTA models on the Dish-20 datasets. \(\mathit{Input\,Res.}\) indicates the resolution size of the input image.

To validate the generalization performance of YOLO-CF, we conduct extensive experiments on three public datasets: the PCB, the crack, the NEU-DET, and the Dish-20 public datasets, which are all introduced in Subsection 4.2, and the results are summarized in Table 2. Specifically, the PCB dataset uses inputs of 640 \(\times\) 640 \(\times\) 3, while both the crack and NEU-DET datasets use inputs of 416 \(\times\) 416 \(\times\) 3. Notably, Faster-RCNN uses inputs of 600 \(\times\) 600 \(\times\) 3 across all three datasets, EfficientDet uses inputs of \(512\times 512 \times3\) for the crack and NEU-DET datasets, RetinaNet uses inputs of 600 \(\times\) 600 \(\times\) 3 across all three datasets, and SSD uses inputs of 500 \(\times\) 500 \(\times\) 3 for the PCB dataset and 300 \(\times\) 300 \(\times\) 3 for the crack and NEU-DET datasets.
In the PCB public dataset, YOLO-CF achieves the highest mAP of 97.38%, surpassing the second-ranked YOLOX-X by 0.9 percentage points. However, in \(\textit{AP}_{11}\), YOLO-CF scored 0.485, 0.3 percentage points lower than YOLOX-X. In \(\textit{AP}_{50}\), YOLO-CF achieves an accuracy of 0.962, higher than YOLOX-X by 0.4 percentage points. In \(\textit{AP}_{75}\), YOLO-CF scored 0.379, 1.8 percentage points lower than YOLOX-X. Despite some fluctuations in accuracy compared to YOLOX-X, YOLO-CF’s overall accuracy exceeds other SOTA models. The YOLO-CF performs well on the PCB public dataset, showcasing the strong competitiveness and application potential in object detection tasks.
In the crack public dataset, YOLO-CF achieves the highest mAP at 84.72%, surpassing the second-place YOLOX-S by 0.61 percentage points. However, in \(\textit{AP}_{11}\), YOLO-CF achieves 0.514, 2 percentage points lower than YOLOX-X. In \(\textit{AP}_{50}\), YOLO-CF attained a precision of 0.782, 1.4 percentage points lower than YOLOX-X. In \(\textit{AP}_{75}\), YOLO-CF achieves a precision of 0.593, 4 percentage points lower than YOLOX-X. YOLO-CF is 1.1 percentage points lower than YOLOX-M in \(\textit{AP}_{50}\) compared to other models. The suboptimal precision in \(\textit{AP}_{75}\) indicates that YOLO-CF has shortcomings in accurately locating targets on the crack dataset, especially when higher IoU is required (such as in \(\textit{AP}_{75}\)). This suggests further optimizing the model’s feature extraction and bounding box regression capabilities to improve precision.
In the NEU-DET public dataset, YOLO-CF achieves the second-highest mAP at 73.35%, just 0.86 percentage points lower than the top-ranked Faster-RCNN (ResNet50). However, in \(\textit{AP}_{75}\), YOLO-CF achieved a precision of 0.419, 1.6 percentage points higher than Faster-RCNN (ResNet50). YOLO-CF outperformed all other SOTA models in mAP, \(\textit{AP}_{11}\), \(\textit{AP}_{50}\), and \(\textit{AP}_{75}\) compared to other models. This indicates that YOLO-CF demonstrates outstanding overall performance on the NEU-DET dataset, particularly excelling in high-precision target localization, showcasing significant advantages in feature extraction and bounding box regression capabilities.
In the Dish-20 dataset, YOLO-CF achieves the highest overall mAP, outperforming all compared SOTA models, as shown in Table 3. Specifically, YOLO-CF demonstrates strong detection accuracy across various dish categories characterized by diverse shapes, reflective surfaces, and frequent occlusions. In terms of \(\textit{AP}_{50}\) and \(\textit{AP}_{75}\), YOLO-CF consistently surpasses the baseline YOLO models, indicating its enhanced capability in both coarse-grained classification and fine-grained localization. These results confirm that YOLO-CF maintains excellent generalization performance on complex real-world scenarios and exhibits substantial advantages in robust feature representation and precise bounding box regression.
4.5. Discussion and Future Work
The experimental results obtained from multiple datasets, including GC10-DET, PCB, crack, NEU-DET, and Dish-20, demonstrate that YOLO-CF maintains stable detection performance under diverse conditions of texture, illumination, background complexity, and target appearance. These datasets differ substantially in visual characteristics, noise patterns, and scene variability, effectively simulating dynamic environmental factors such as lighting fluctuations, material variations, structural irregularities, and background interference. Across all datasets, YOLO-CF consistently delivers superior performance, indicating that its feature extraction and multi-scale fusion mechanisms are highly robust and adaptable to dynamic conditions, enabling reliable detection in real-world industrial scenarios.
Table 1 further shows that although some models possess higher parameters and FLOPs than YOLO-CF, their inference speeds are nonetheless faster. This suggests that YOLO-CF involves more data read and write operations, resulting in performance loss due to memory bandwidth constraints during data transfer between memory and computation units. Nevertheless, YOLO-CF achieves an inference speed of 36.68 fps, which is sufficient for most industrial surface defect detection applications. In practical production environments, medium-speed manufacturing lines typically require around 20–30 fps for stable online detection. In contrast, scenarios with higher throughput or stricter latency requirements benefit from speeds above 30 fps. Therefore, YOLO-CF’s current inference performance meets the real-time processing requirements of a wide range of industrial tasks, and it can be deployed on edge or resource-constrained devices.
Moreover, as illustrated in the last row of Fig. 4, the heatmap of the right target is not perfectly centered and exhibits two activation regions, suggesting that the feature extraction and fusion process still has room for refinement. In future work, we plan to optimize the MFF structure, enhance multi-scale feature extraction and fusion, and reduce redundant data read and write operations to further improve inference efficiency. Through these improvements, we aim to enhance both the accuracy and real-time performance of YOLO-CF in industrial applications.
5. Conclusion
This paper introduces YOLO-CF, an innovative object detection model that effectively integrates multi-scale feature extraction and fine-grained feature fusion through the Res2Net architecture and the newly developed MFF and HD modules. YOLO-CF not only achieves an mAP of 59.09% on the GC10-DET dataset, surpassing RetinaNet by 3.41 percentage points, but also excels on other public datasets with mAPs of 97.38% on PCB, 84.72% on crack, 73.35% on NEU-DET and 99.54% on Dish-20. These results confirm the model’s robustness and enhanced generalization capabilities across varied conditions, demonstrating the potential in complex object detection scenarios. Future work focuses on further optimizations and exploring additional architectural innovations to extend the model’s applicability and performance in more challenging environments. The ongoing development of YOLO-CF is poised to push forward the boundaries of object detection technologies.
- [1] C.-Y. Wang, A. Bochkovskiy, and H.-Y. M. Liao, “YOLOv7: Trainable bag-of-freebies sets new state-of-the-art for real-time object detectors,” Proc. of the IEEE/CVF Conf. on Computer Vision and Pattern Recognition, pp. 7464-7475, 2023. https://doi.org/10.1109/CVPR52729.2023.00721
- [2] J. Qu, R. W. Liu, C. Zhao, Y. Guo, S. S.-D. Xu, F. Zhu, and Y. Lv, “Multi-task learning-enabled automatic vessel draft reading for intelligent maritime surveillance,” IEEE Trans. on Intelligent Transportation Systems, Vol.25, No.5, pp. 4552-4564, 2024. https://doi.org/10.1109/TITS.2023.3327824
- [3] Y. Cai, T. Luan, H. Gao, H. Wang, L. Chen, Y. Li, M. A. Sotelo, and Z. Li, “YOLOv4-5D: An effective and efficient object detector for autonomous driving,” IEEE Trans. on Instrumentation and Measurement, Vol.70, pp. 1-13, 2021. https://doi.org/10.1109/TIM.2021.3065438
- [4] N. Robinson, B. Tidd, D. Campbell, D. Kulić, and P. Corke, “Robotic vision for human–robot interaction and collaboration: A survey and systematic review,” ACM Trans. on Human-Robot Interaction, Vol.12, No.1, pp. 1-66, 2023. https://doi.org/10.1145/3570731
- [5] Y. Ge, Z. Li, X. Yue, H. Li, Q. Li, and L. Meng, “IoT-based automatic deep learning model generation and the application on empty-dish recycling robots,” Internet of Things, Vol.25, Article No.101047, 2024. https://doi.org/10.1016/j.iot.2023.101047
- [6] Y. Wang, S. Cang, and H. Yu, “A survey on wearable sensor modality centred human activity recognition in health care,” Expert Systems with Applications, Vol.137, pp. 167-190, 2019. https://doi.org/10.1016/j.eswa.2019.04.057
- [7] Z. Li, Y. Ge, X. Wang, and L. Meng, “3D industrial anomaly detection via dual reconstruction network,” Applied Intelligence, Vol.54, pp. 9956-9970, 2024. https://doi.org/10.1007/s10489-024-05700-x
- [8] Z. Li, Y. Ge, X. Yue, and L. Meng, “MCAD: Multi-classification anomaly detection with relational knowledge distillation,” Neural Computing and Applications, Vol.36, pp. 14543-14557, 2024. https://doi.org/10.1007/s00521-024-09838-0
- [9] X. Yue, Z. Wang, R. Ishibashi, H. Kaneko, and L. Meng, “An unsupervised automatic organization method for Professor Shirakawa’s hand-notated documents of oracle bone inscriptions,” Int. J. on Document Analysis and Recognition, Vol.27, pp. 583-601, 2024. https://doi.org/10.1007/s10032-024-00463-0
- [10] X. Yue, H. Li, Y. Fujikawa, and L. Meng, “Dynamic dataset augmentation for deep learning-based oracle bone inscriptions recognition,” J. Comput. Cult. Herit., Vol.15, No.4, 2022. https://doi.org/10.1145/3532868
- [11] G. Wang, K. Jiang, K. Gu, H. Liu, H. Liu, and W. Zhang, “Coarse- and fine-grained fusion hierarchical network for hole filling in view synthesis,” IEEE Trans. on Image Processing, Vol.33, pp. 322-337, 2024. https://doi.org/10.1109/TIP.2023.3341303
- [12] Y. Gan, F. Gao, J. Dong, and S. Chen, “Arbitrary-scale texture generation from coarse-grained control,” IEEE Trans. on Image Processing, Vol.31, pp. 5841-5855, 2022. https://doi.org/10.1109/TIP.2022.3201710
- [13] X.-S. Wei, Y.-Z. Song, O. M. Aodha, J. Wu, Y. Peng, J. Tang, J. Yang, and S. Belongie, “Fine-grained image analysis with deep learning: A survey,” IEEE Trans. on Pattern Analysis and Machine Intelligence, Vol.44, No.12, pp. 8927-8948, 2022. https://doi.org/10.1109/TPAMI.2021.3126648
- [14] Y. Lin, Y. Chang, X. Tong, J. Yu, A. Liotta, G. Huang, W. Song, D. Zeng, Z. Wu, Y. Wang, and W. Zhang, “A survey on RGB, 3D, and multimodal approaches for unsupervised industrial image anomaly detection,” Information Fusion, Vol.121, Article No.103139, 2025. https://doi.org/10.1016/j.inffus.2025.103139
- [15] Z. Li, Y. Yan, X. Wang, Y. Ge, and L. Meng, “A survey of deep learning for industrial visual anomaly detection,” Artificial Intelligence Review, Vol.58, Article No.279, 2025. https://doi.org/10.1007/s10462-025-11287-7
- [16] S. Gao, M. Cheng, K. Zhao, X. Zhang, M. Yang, and P. Torr, “Res2Net: A new multi-scale backbone architecture,” IEEE Trans. on Pattern Analysis and Machine Intelligence, Vol.43, No.2, pp. 652-662, 2021. https://doi.org/10.1109/TPAMI.2019.2938758
- [17] R. Girshick, J. Donahue, T. Darrell, and J. Malik, “Rich feature hierarchies for accurate object detection and semantic segmentation,” Proc. of the IEEE Conf. on Computer Vision and Pattern Recognition (CVPR), pp. 580-587, 2014. https://doi.org/10.1109/CVPR.2014.81
- [18] S. Ren, K. He, R. Girshick, and J. Sun, “Faster R-CNN: Towards real-time object detection with region proposal networks,” IEEE Trans. on pattern analysis and machine intelligence, Vol.39, No.6, pp. 1137-1149, 2016. https://doi.org/10.1109/TPAMI.2016.2577031
- [19] T. Lin, P. Goyal, R. Girshick, K. He, and P. Dollár, “Focal loss for dense object detection,” Proc. of the IEEE Int. Conf. on Computer Vision (ICCV), Vol.42, No.2, pp. 318-327, 2017. https://doi.org/10.1109/TPAMI.2018.2858826
- [20] J. Redmon and A. Farhadi, “YOLOv3: An incremental improvement,” arXiv:1804.02767, 2018. https://doi.org/10.48550/arXiv.1804.02767
- [21] A. Bochkovskiy, C.-Y. Wang, and H.-Y. M. Liao, “YOLOv4: Optimal speed and accuracy of object detection,” arXiv:2004.10934, 2020. https://doi.org/10.48550/arXiv.2004.10934
- [22] Z. Ge, S. Liu, F. Wang, Z. Li, and J. Sun, “YOLOx: Exceeding YOLO series in 2021,” arXiv:2107.08430, 2021. https://doi.org/10.48550/arXiv.2107.08430
- [23] J. Liu, Q. Hou, Z. Liu, and M. Cheng, “PoolNet+: Exploring the potential of pooling for salient object detection,” IEEE Trans. on Pattern Analysis and Machine Intelligence, Vol.45, No.1, pp. 887-904, 2023. https://doi.org/10.1109/TPAMI.2021.3140168
- [24] Q. Hou, L. Zhang, M. Cheng, and J. Feng, “Strip pooling: Rethinking spatial pooling for scene parsing,” Proc. of the IEEE/CVF Conf. on Computer Vision and Pattern Recognition (CVPR), pp. 4002-4011, 2020. https://doi.org/10.1109/CVPR42600.2020.00406
- [25] Y. Wu, Y. Liu, X. Zhan, and M. Cheng, “P2T: Pyramid pooling transformer for scene understanding,” IEEE Trans. on Pattern Analysis and Machine Intelligence, Vol.45, No.11, pp. 12760-12771, 2023. https://doi.org/10.1109/TPAMI.2022.3202765
- [26] Z. Gao, L. Wang, and G. Wu, “LIP: Local importance-based pooling,” Proc. of the IEEE/CVF Int. Conf. on Computer Vision (ICCV), pp. 3354-3363, 2019. https://doi.ieeecomputersociety.org/10.1109/ICCV.2019.00345
- [27] H. Xu, J. Liu, Y. Shen, K. Lou, Y. Bao, R. Zhang, S. Zhou, H. Zhao, X. Zhu, and S. Wang, “Geometric pooling: Maintaining more representative information,” IEEE Access, Vol.12, pp. 54066-54072, 2024. https://doi.org/10.1109/ACCESS.2024.3387703
- [28] Z. Chen, H. Ji, Y. Zhang, Z. Zhu, and Y. Li, “High-resolution feature pyramid network for small object detection on drone view,” IEEE Trans. on Circuits and Systems for Video Technology, Vol.34, No.1, pp. 475-489, 2024. https://doi.org/10.1109/TCSVT.2023.3286896
- [29] H. Li, H. Ma, Y. Che, and Z. Yang, “A two-way dense feature pyramid networks for object detection of remote sensing images,” Knowledge and Information Systems, Vol.65, No.11, pp. 4847-4871, 2023. https://doi.org/10.1007/s10115-023-01916-4
- [30] J. Hu, C.-J. R. Shi, and J. Zhang, “Saliency-based YOLO for single target detection,” Knowledge and Information Systems, Vol.63, No.3, pp. 717-732, 2021. https://doi.org/10.1007/s10115-020-01538-0
- [31] S. Xu, J. Fei, G. Zhao, X. Liu, and H. Li, “CCL-YOLO: Catenary components location based on YOLO and gather-distribute mechanism,” IEEE Access, Vol.13, pp. 9064-9072, 2025. https://doi.org/10.1109/ACCESS.2024.3403716
- [32] X. Yue, H. Li, and L. Meng, “An ultralightweight object detection network for empty-dish recycling robots,” IEEE Trans. on Instrumentation and Measurement, Vol.72, pp. 1-12, 2023. https://doi.org/10.1109/TIM.2023.3241078
- [33] S. Liu, L. Qi, H. Qin, J. Shi, and J. Jia, “Path aggregation network for instance segmentation,” Proc. of the IEEE Conf. on Computer Vision and Pattern Recognition (CVPR), 2018. https://doi.org/10.1109/CVPR.2018.00913
- [34] K. He, X. Zhang, S. Ren, and J. Sun, “Spatial pyramid pooling in deep convolutional networks for visual recognition,” IEEE Trans. on Pattern Analysis and Machine Intelligence, Vol.37, No.9, pp. 1904-1916, 2015. https://doi.org/10.1109/TPAMI.2015.2389824
- [35] X. Yue and L. Meng, “YOLO-MSA: A multiscale stereoscopic attention network for empty-dish recycling robots,” IEEE Trans. on Instrumentation and Measurement, Vol.72, pp. 1-14, 2023. https://doi.org/10.1109/TIM.2023.3315355
- [36] X. Yue, H. Li, M. Shimizu, S. Kawamura, and L. Meng, “YOLO-GD: A deep learning-based object detection algorithm for empty-dish recycling robots,” Machines, Vol.10, No.5, Article No.294, 2022. https://doi.org/10.3390/machines10050294
- [37] X. Lv, F. Duan, J.-j. Jiang, X. Fu, and L. Gan, “Deep metallic surface defect detection: The new benchmark and detection network,” Sensors, Vol.20, No.6, Article No.1562, 2020. https://doi.org/10.3390/s20061562
- [38] W. Huang and P. Wei, “A PCB dataset for defects detection and classification,” arXiv:1901.08204, 2019. https://doi.org/10.48550/arXiv.1901.08204
- [39] K. Liu, X. Han, and B. M. Chen, “Deep learning based automatic crack detection and segmentation for unmanned aerial vehicle inspections,” 2019 IEEE Int. Conf. on Robotics and Biomimetics (ROBIO), pp. 381-387, 2019. https://doi.org/10.1109/ROBIO49542.2019.8961534
- [40] Y. Bao, K. Song, J. Liu, Y. Wang, Y. Yan, H. Yu, and X. Li, “Triplet-graph reasoning network for few-shot metal generic surface defect segmentation,” IEEE Trans. on Instrumentation and Measurement, Vol.70, pp. 1-11, 2021. https://doi.org/10.1109/TIM.2021.3083561
- [41] M. Tan, R. Pang, and Q. V. Le, “EfficientDet: Scalable and efficient object detection,” Proc. of the IEEE/CVF Conf. on Computer Vision and Pattern Recognition (CVPR), pp. 10778-10787, 2020. https://doi.org/10.1109/CVPR42600.2020.01079
- [42] W. Liu, D. Anguelov, D. Erhan, C. Szegedy, S. Reed, C.-Y. Fu, and A. C. Berg, “SSD: Single shot multibox detector,” 14th European Conf. on Computer Vision (ECCV), pp. 21-37, 2016. https://doi.org/10.1007/978-3-319-46448-0_2
This article is published under a Creative Commons Attribution-NoDerivatives 4.0 Internationa License.