Research Paper:
An Optimal Capacity Allocation Method for Integrated Photovoltaic-Storage-Charging System Based on Multi-Objective Artificial Hummingbird Algorithm
Zhuoran Song*, Sichen Lu*, Yongji Tong*, Tao Jiang*, and Lu Wang**,†
*State Grid Liaoning Electric Power Co., Ltd.
No.18 Ningbo Road, Shenyang, Liaoning 110006, China
**Shanghai Proinvent Info Tech Co., Ltd.
Room 302, Building 8, No.1441 Humen Road, Minhang, Shanghai 200241, China
†Corresponding author

The capacity configuration of integrated photovoltaic (PV), energy storage, and charging systems requires balancing economic efficiency, reliability, and environmental benefits. However, dynamic load demand, intermittent PV output, and multi-source uncertainties pose challenges to precise configuration using conventional methods. To address this, a Multi-Objective Artificial Hummingbird Algorithm (MOAHA)-based optimal capacity allocation method for integrated PV-storage-charging systems (PSCSs) is proposed. A comprehensive structure for the integrated system is developed, and PV array and inverter models are implemented in OpenDSS to achieve rapid maximum power point tracking. A capacity degradation model for the energy storage battery is established, accounting for factors such as the number of charge-discharge cycles and depth of discharge. Furthermore, an electric vehicle model is incorporated, considering initial charging time, daily mileage, and energy consumption per unit distance. The objective function and constraints for optimal capacity allocation are formulated, and the artificial hummingbird algorithm is employed to solve the multi-objective optimization problem, thereby enabling optimal capacity allocation. Experimental results demonstrate that the proposed method achieves a configuration ratio of only 22.5%, the lowest comprehensive cost, reduced operating frequency and amplitude of energy storage, and a significant reduction in the deviation between the PSCS and actual demand.
1. Introduction
Against the backdrop of the global transition toward a low-carbon energy structure, the renewable energy industry is undergoing unprecedented technological innovation and industrial transformation. According to statistics from the International Energy Agency, the global installed capacity of renewable energy has exceeded 35,000 GW by 2024, with photovoltaic (PV) systems accounting for over 40% of this total, making photovoltaics the fastest-growing renewable energy technology. However, the inherent intermittency of renewable energy and its conflict with grid stability requirements have become increasingly prominent, urgently necessitating the development of energy systems with flexible regulation capabilities. The integrated photovoltaic, energy storage, and charging (PSC) system, as a key component of renewable energy infrastructure, has attracted widespread attention. This system integrates PV power generation, energy storage units, and electric vehicle charging facilities to establish a closed-loop “generation-storage-utilization” energy management model, achieving the three core functions of PV power generation, energy storage, and electric vehicle charging, thereby providing strong support for sustainable green energy development and contributing to global energy transition and carbon neutrality goals 1,2.
Although PSC systems possess significant technological advantages, their capacity configuration faces numerous complex challenges. Among these, the high uncertainty of renewable energy generation is a primary concern. PV power generation is highly dependent on dynamic weather conditions, solar irradiance, and cloud cover, which can cause substantial short-term fluctuations in power output. To cope with extreme operating conditions, redundant energy storage capacity is often required, yet this exacerbates the trade-off between system conservatism and economic efficiency. For example, increasing storage capacity can enhance system resilience but also significantly raises capital costs; conversely, reducing storage capacity may compromise grid stability and even lead to energy curtailment losses. Furthermore, high-performance storage technologies such as lithium-ion batteries involve high manufacturing costs, and their lifespan is constrained by multiple factors, including depth of discharge (DOD), cycle number, and thermal characteristics. Improper sizing of the energy storage system (ESS) may result in premature performance degradation or insufficient capacity utilization relative to operational needs, further increasing lifecycle costs. Meanwhile, spatiotemporal variations in electric vehicle charging demand and uncertainties in user behavior further complicate system design. Traditional static models struggle to dynamically adapt to these variations, leading to mismatches between storage capacity and actual demand, which can cause resource waste or supply shortages. These interdependent constraints render capacity optimization a multidimensional and complex challenge, representing a key focus of current research.
Yao et al. 3 conducted a comprehensive review of the concept, advantages, capacity allocation methods, algorithms, and control strategies for PV and ESS-integrated electric vehicle charging stations, analyzed existing problems and challenges, and proposed corresponding solutions and methods. However, a significant shortcoming remained in existing research regarding the comprehensive sensitivity analysis of capacity configuration parameters to uncertainties such as weather conditions and user behavior. Specifically, dynamic variations in weather conditions and the randomness of user behavior (e.g., uncertainties in electric vehicle charging time and energy demand) could influence system performance through multiple pathways. For instance, weather variations could directly affect PV power generation, thereby altering the charging and discharging requirements of the ESS; meanwhile, the randomness of user behavior could lead to changes in the spatiotemporal distribution of charging loads, making it difficult to accurately predict energy storage capacity demand. Most existing studies employed static or simplified models to address these uncertainties, failing to fully account for the complex influence of their dynamic characteristics on system parameters. This resulted in limitations of the proposed capacity allocation methods and algorithms in practical applications, preventing them from accurately adapting to real-world operating environments.
Dong et al. 4 considered a voltage optimization strategy for distribution networks utilizing the flexible regulation capability of integrated PV-storage systems. Taking the distribution network voltage as the optimization objective and incorporating the actual operational requirements of the power system, the integrated PV and ESS could be better adapted to distribution network operation through strategy optimization, thereby improving power supply reliability and quality. However, certain shortcomings existed in this study. In practical application analysis, performance variations of integrated PV-storage systems under different geographical and climatic conditions may not have been fully considered. For example, factors such as solar radiation intensity and temperature variations in different regions could significantly influence PV generation efficiency and energy storage battery performance, yet these factors may not have received adequate attention and analysis in the research. Furthermore, considerations regarding the diversity of user-side electricity consumption behavior and demand response were insufficiently comprehensive. Users may exhibit different electricity demands and charging behaviors across various time periods and scenarios, which could lead to deviations between the actual operating status of the integrated PV and ESS and the intended optimization strategies.
Tong 5 proposed a large-scale wind-PV hybrid grid energy storage architecture, analyzed the operational characteristics of PV and wind power generation, and established probability models for PV power generation, wind power generation, and load profiles, along with battery and supercapacitor charging/discharging models. Based on this, Tong constructed optimization objective functions, determined constraint conditions, and established a big data-driven optimization model for energy storage capacity configuration in large-scale wind-PV complementary grids. The particle swarm optimization algorithm was employed to solve the model, achieving big data-optimized configuration of energy storage capacity. However, the robustness of these models to uncertainties such as weather forecast errors and load demand fluctuations has not been thoroughly tested. Weather forecast errors could lead to inaccurate predictions of PV power generation, while load demand fluctuations could alter the required energy storage capacity. Most existing models relied on idealized weather forecasts and load demand assumptions, failing to fully account for the practical impact of these uncertain factors. Consequently, in practical applications, big data-driven configuration optimization models may not accurately reflect real-world conditions, leading to suboptimal allocation of energy storage capacity.
Zhang et al. 6 proposed a strategy to address the challenge of daytime power supply. Taking an actual charging station as a case study, a detailed component-level analysis of the charging station was conducted through fine-grained modeling to verify the model’s effectiveness and robustness. The variable characteristics and influencing factors of schedulable capacity were studied from four dimensions: lighting conditions, typical electric vehicle load scenarios, scheduling interval duration, and centralized storage configuration. However, the study did not adequately account for the dynamic characteristics of weather forecast errors and variations in load demand. The static assumptions in weather models led to significant discrepancies between predictions and actual PV power generation. For instance, actual weather conditions may suddenly involve cloud accumulation, causing a sharp decrease in solar irradiance, which static weather models could not capture in a timely manner, resulting in inaccurate PV power generation forecasts. Meanwhile, a spatiotemporal distribution model of charging load that overlooked the randomness of user behavior could yield energy storage capacity configurations inconsistent with actual demand. User charging behavior was highly stochastic, with factors such as charging time and energy demand subject to constant change. However, existing models did not fully incorporate these factors, leading to energy storage capacity configurations that failed to satisfy actual requirements. Errors were introduced in the calculation of schedulable capacity, which may be adversely affected by uncertainties in actual operation, thereby compromising system performance.
In summary, existing research methods exhibit limitations in accurately adapting models to complex operational environments, which stems from insufficient consideration of the dynamic characteristics of uncertain factors when addressing capacity configuration problems in integrated photovoltaic-storage-charging systems (PSCSs). Therefore, algorithms capable of effectively handling multi-objective optimization problems while accounting for the impact of uncertain factors are required to solve the capacity allocation problem of such integrated systems.
Multi-objective optimization algorithms can simultaneously balance and coordinate multiple objectives, identifying optimal or near-optimal solutions that satisfy all requirements, thereby providing an approach to solve the capacity allocation problem of integrated PSCSs. As a novel swarm intelligence optimization algorithm, the Artificial Hummingbird Algorithm (AHA) offers significant advantages. This algorithm simulates hummingbird foraging strategies, employing guided, territorial, and migratory foraging behaviors to locate optimal solutions within the search space. It exhibits characteristics such as rapid convergence speed and strong global search capability. Compared with traditional algorithms such as particle swarm optimization and quantum-behaved particle swarm optimization, the AHA demonstrates superior adaptability in handling complex multi-objective optimization problems. Traditional particle swarm optimization algorithms are prone to becoming trapped in local optima during the search process, particularly when addressing capacity configuration problems in integrated PSCSs with multiple conflicting objectives, where they often fail to identify global optima. Through its unique foraging behavior mechanism, the AHA can effectively escape local optima and perform global exploration for optimal solutions, enhancing the possibility of discovering globally optimal capacity allocation schemes. Furthermore, the AHA possesses distinctive advantages in addressing uncertain factors, as it can dynamically adjust search strategies to adapt to variations in weather conditions and user behavior. For the capacity allocation problem of integrated PSCSs, the Multi-Objective Artificial Hummingbird Algorithm (MOAHA) can fully leverage its advantages to identify optimal capacity allocation schemes satisfying all target criteria. The MOAHA-based optimal capacity configuration method for integrated PSCSs proposed in this study fully utilizes the advantages of multi-objective collaborative optimization while overcoming inherent limitations of traditional single-objective methods. This method develops a comprehensive model integrating PV output characteristics, energy storage battery degradation modes, and electric vehicle dynamic loads. It particularly emphasizes the impact of key parameters such as charge-discharge cycle times and DOD on energy storage lifespan, significantly enhancing the model’s engineering applicability. Simultaneously, an electric vehicle model incorporating dynamic variables including charging start time, daily mileage, and energy consumption per unit distance is established. The OpenDSS platform is utilized to achieve co-simulation of maximum power point tracking and energy storage degradation, effectively improving the model’s adaptability across different scenarios.
2. Capacity Degradation Model and Mathematical Model of Charging Demand for Integrated Photovoltaic-Storage-Charging System
Through detailed characterization of the structure of the integrated PSCS, including the working principle of the PV system, the capacity degradation model of the energy storage battery, and the mathematical model of charging demand, this study establishes a theoretical foundation and provides data support for the design and optimization of the integrated PV-storage-charging system.
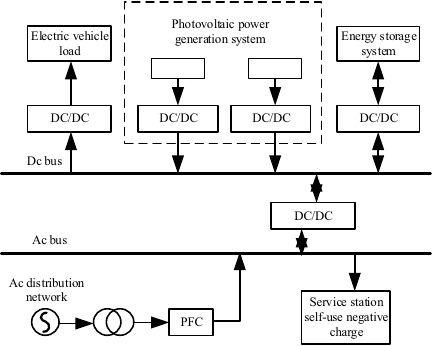
Fig. 1. Structure of the integrated photovoltaic-storage-charging system (PSCS).
2.1. Structure of the Integrated Photovoltaic-Storage-Charging System
Unlike electric vehicles in urban environments, those operating on expressways typically utilize DC fast-charging (with charging durations ranging from 12 minutes to 1 hour) to alleviate range anxiety. In contrast to AC charging, DC charging is inherently free from harmonic interference, resulting in superior power quality. Moreover, the DC architecture requires only a single voltage conversion stage between the PV array and the DC bus, thereby reducing both cost and energy losses. Consequently, a DC bus topology is adopted, as illustrated in Fig. 1.
A PV power generation system typically comprises solar cell arrays, inverters, AC distribution cabinets, solar tracking control systems, and other components. The PV generation model implemented in OpenDSS integrates a PV array with a PV inverter, where the inverter performs rapid maximum power point tracking (MPPT) for the PV panels. The DC power output from the PV array is determined by local solar irradiance and temperature variations. The calculation methodology is provided below.
In Eq. \(\eqref{eq:1}\), \(P_{\mathrm{dc}}(t)\) is the DC output power of the PV array at time \(t\) 7; \(P_{\mathrm{mpp}}\) denotes the maximum output power reference value under standard test conditions (25°C, 1 kW/m\(^2\) irradiance); \(P_{\mathrm{I}}(t)\) serves as the irradiance scaling factor relative to 1 kW/m\(^2\) at time \(t\); and \(P_{\mathrm{T}}(t)\) functions as the temperature characteristic scaling factor relative to 25°C at time \(t\).
PV system output power exhibits substantial uncertainty, which primarily manifests in the following aspects: the irradiance scaling factor is directly affected by dynamic environmental conditions including cloud cover, atmospheric transparency, and diurnal cycles, leading to power variations ranging from short-term minute-scale fluctuations to long-term changes. The temperature coefficient reflects the effect of module temperature on power generation efficiency; elevated ambient temperatures degrade the open-circuit voltage of PV cells. When heat dissipation becomes inadequate under high-temperature conditions, this effect is exacerbated, creating a negative feedback mechanism.
While inverter start-stop threshold control can suppress low-frequency oscillations, it may also introduce delays in the system’s response to rapid irradiance variations. When the actual power approaches the on/off threshold, the hysteresis associated with inverter state switching can induce a jitter phenomenon, thereby worsening output instability. Over prolonged operation, factors such as dust accumulation on PV panels, module degradation, and deterioration of inverter IGBT module performance may cause deviations from the initial design parameters, leading to discrepancies between theoretical calculations and actual output. Furthermore, irradiance non-uniformity across sub-arrays in large-scale PV arrays can result in overall output being lower than predicted values based on uniform irradiance assumptions.
The PV inverter performs DC-AC power conversion while regulating both power factor and output power thresholds. To mitigate inverter cycling caused by irradiance and temperature uncertainties, the model implements a defined operating power range for inverter activation, with specific implementation procedures detailed in Eqs. \(\eqref{eq:2}\) and \(\eqref{eq:3}\).
In Eqs. \(\eqref{eq:2}\) and \(\eqref{eq:3}\), \(P_{\mathrm{ac}}(t)\) represents the AC power at time \(t\); \(E\) denotes the inverter conversion efficiency; \(S_{\mathrm{Status}}(t)\) indicates the inverter operating state; \(C_{\mathrm{cutin}}\) specifies the percentage of the inverter’s rated value when open; \(C_{\mathrm{cutout}}\) defines the percentage of the inverter’s rated value when off; and \(S\) corresponds to the inverter’s rated capacity.
2.2. Capacity Degradation Model of Energy Storage Batteries
The performance degradation of the energy storage battery is further investigated within the integrated PSCS framework. As the battery undergoes repeated charge-discharge cycles, its internal aging process progresses, manifested through increasing internal resistance and continuous capacity fade. As expressed in Eq. \(\eqref{eq:4}\), industry standards typically consider an energy storage battery to reach end-of-life when its available capacity degrades to 80% of rated capacity or when internal resistance doubles its initial value, at which point the battery is either retired or repurposed for cascade utilization.
In Eq. \(\eqref{eq:4}\), \(S_{\mathrm{end}}\) denotes the available capacity of the energy storage battery at retirement, \(S_{\mathrm{rated}}\) represents the rated capacity of the energy storage battery, \(R_{\mathrm{end}}\) signifies the internal resistance of the energy storage battery at retirement, with \(R_{\mathrm{ini}}\) being the initial internal resistance of the energy storage battery 8. Based on capacity degradation and internal resistance growth characteristics, this study proposes two State of Health (SOH) models for energy storage batteries:
In Eq. \(\eqref{eq:5}\), \(S_{\mathrm{OHC}}\) represents the SOH of the energy storage battery based on available capacity, \(S_{\mathrm{present}}\) denotes the current available capacity, \(S_{\mathrm{OHR}}\) characterizes the SOH with internal resistance as the evaluation metric 9, and \(R_{\mathrm{present}}\) specifies the current internal resistance. The energy storage battery reaches end-of-life when either \(S_{\mathrm{OHC}}\) declines to 80% or \(S_{\mathrm{OHR}}\) deteriorates to 0%. This study adopts \(S_{\mathrm{OHC}}\) as the primary SOH assessment criterion for energy storage batteries.
The capacity decay rate of ESSs is closely related to the number of charge-discharge cycles, DOD, operating temperature, and charge-discharge current ratio. In practical applications, temperature and charge-discharge power significantly impact battery life degradation. Although battery operating temperature is partially controllable, it may still fluctuate under different environmental conditions. For example, in high-temperature summer environments, battery operating temperature may increase, accelerating internal chemical reactions and consequently affecting lifespan; in low-temperature winter environments, battery internal resistance increases while charge-discharge efficiency decreases, similarly impacting battery longevity. Furthermore, the energy storage power is not entirely constant within the specified output range, and different charge-discharge power levels exert distinct effects on battery lifespan.
To simulate actual conditions more accurately, the effects of temperature and charge-discharge power are comprehensively considered. For temperature influence, a temperature coefficient \(\alpha(T)\) is introduced, which is a function of temperature \(T\) obtained by fitting experimental data. For charge-discharge power influence, a power function \(\beta(P)\) is introduced, which is a function of charge-discharge power \(P\). Based on experimental data and subsequent normalization processing, the derived characteristic curve (Fig. 2) demonstrates excellent fitting accuracy with the modified Eq. \(\eqref{eq:6}\).
In Eqs. \(\eqref{eq:6}\)–\(\eqref{eq:8}\), \(L\) represents the degree of life loss of the energy storage battery; \(N\) is the number of charge-discharge cycles; \(\mathit{DOD}\) is the depth of discharge; \(T\) is the working temperature, and \(\alpha(T)\) is the temperature coefficient; \(P\) is the charge-discharge power, and \(\beta(P)\) is the power coefficient. \(L_{t}\) measures the degree of life loss within the \(t\)-th cycle (reflecting the temporal evolution of battery health status), where \(L_{0} = 0\) indicates that the battery is in a brand-new state and \(L = 1\) indicates the end-of-life state. Eq. \(\eqref{eq:7}\) is the differential form of Eq. \(\eqref{eq:6}\), while Eq. \(\eqref{eq:8}\) provides its discretized equivalent expression. To simplify the model, \(L\) is segmented and linearized, where the slopes of each linear segment are defined.
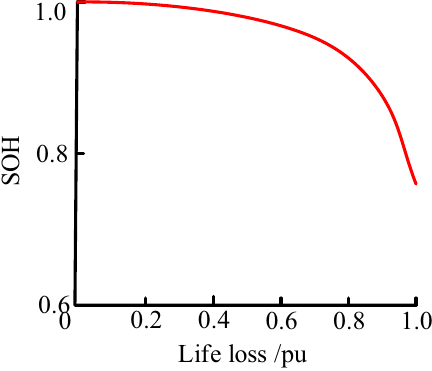
Fig. 2. Relationship between energy-storage SOH and life loss.
Figure 2 shows the relationship curve between energy storage SOH and lifespan loss. The graph indicates that as the degree of life loss (Life loss/pu) increases, the SOH of the energy storage battery gradually decreases. During the initial stage of lifespan loss, the SOH decreases at a relatively slow rate; however, when lifespan loss reaches a certain level, the SOH decline rate accelerates significantly. This demonstrates that energy storage battery performance degradation intensifies during later lifespan stages, necessitating enhanced attention to battery condition monitoring and maintenance. This curve is significant for evaluating the service life and performance status of energy storage batteries. In practical applications, the battery’s remaining life can be predicted based on this curve, enabling rational planning of battery replacement or maintenance schedules to ensure stable operation of the integrated PSCS.
2.3. Mathematical Model of Charging Demand
Building upon the energy storage battery capacity degradation model, this study establishes a charging demand mathematical model that incorporates critical parameters including charging duration, charging power, and charging quantity, while systematically analyzing the interrelationships among these parameters, user requirements, and grid operating conditions.
The performance of electric vehicles is a key factor affecting charging demand characteristics. The developed electric vehicle model fully considers various situations in practical scenarios, with behavioral parameters derived from actual research data on urban electric vehicle users. The survey covers different types of electric vehicle users including private cars, buses, and logistics vehicles. User information such as charging start time and daily mileage is collected through questionnaires, vehicle data recording, and other methods. After statistical analysis of extensive sample data, parameter values for different vehicle types are obtained, including the following key parameters:
(1) Initial charging time (\(t_{s}\)): The initial charging time depends on the user’s driving pattern, and the vehicle may start charging at any time within 24 hours. A vehicle classification mechanism is introduced to categorize electric vehicles into private cars, buses, and logistics vehicles, and the independent charging time distribution models for each category are developed. This method overcomes the limitations of single-vehicle-type assumptions and can more accurately characterize practical charging time characteristics. Historical data analysis reveals during the fitting process that the initial charging time follows a mixed distribution combining normal and lognormal distributions. For private cars, their initial charging time better conforms to a normal distribution; for buses and logistics vehicles, owing to their relatively fixed operating schedules, the initial charging time better follows a lognormal distribution.
In Eq. \(\eqref{eq:9}\), \(\mu_{s}\) and \(\sigma_{s}\) are the expectation and standard deviation of the initial charging time, respectively 10; and \(\mu_{s}\) and \(\sigma_{s}\) vary according to the driving characteristics of different vehicle types.
(2) Daily mileage (\(s\)): The daily driving range of electric vehicles directly affects their daily energy consumption, which subsequently influences their charging demand. Historical data analysis indicates that the daily mileage distribution of electric vehicles exhibits diverse characteristics, with significant distributional variations across different vehicle types. The daily mileage distribution of private cars is relatively dispersed, whereas the daily mileage of buses and logistics vehicles is relatively concentrated.
In Eq. \(\eqref{eq:10}\), \(\mu_D\) and \(\sigma_D\) are the expectation and standard deviation of \(\ln s\) 11, respectively, which vary according to the driving characteristics of different vehicle types.
(3) Charging duration (\(T_{c}\)): The charging duration is calculated according to the following formula based on the daily mileage. In practice, charging methods are not limited to constant-power mode, with various approaches such as fast charging and slow charging available. Fast charging can replenish substantial electrical energy in a short period but may impact battery longevity; slow charging requires longer duration but causes less battery degradation. Therefore, the model incorporates both fast-charging and slow-charging modes.
In Eq. \(\eqref{eq:11}\), \(W_1\) represents the energy consumption of the EV per kilometer [kWh/km], \(P_c\) denotes the charging power [kW], and \(\eta\) indicates the charging efficiency (typically 0.9). Energy-intensive vehicles require extended recharge durations, while high-power charging infrastructure can significantly reduce charging time. However, inefficient charging processes may negate these power-related advantages. The developed model elucidates the coupling mechanisms among vehicle usage patterns, charging facility performance, and system efficiency, thereby establishing a quantitative foundation for optimizing energy storage configuration and achieving supply-demand balance.
Based on the preceding analysis, charging duration exhibits a positive correlation with driving distance. Due to the consideration of both fast-charging and slow-charging modes, the distribution of charging duration becomes more complex. For fast-charging mode, the charging duration \(T_c\) is relatively short with a concentrated distribution; for slow-charging mode, the charging duration is longer with a more dispersed distribution.
In Eq. \(\eqref{eq:12}\), \(\mu_{T_{c}} = \ln[W/(\eta p_{c})] + \mu_{D}\) represents the expectation of \(T_{c}\), and \(\sigma_{T_{c}}\) denotes the standard deviation of \(T_{c}\) 12.
(4) Charging power: Most electric vehicles are charged with constant voltage and current. For computational convenience, this paper models the electric vehicle charging process using constant power (where the charging power remains fixed at \(P_c\)). An electric vehicle has two possible states during a day: charging (denoted by \(Y\)) and not charging (denoted by \(N\)). The 24-hour period is discretized into 1440 time intervals, with the charging probability defined as follows:
In Eqs. \(\eqref{eq:13}\) and \(\eqref{eq:14}\), \(F_{\mathit{sTc}}\) denotes the joint probability distribution function of the initial charging time \(t_s\) and the charging time \(T_c\). Given that \(t_s\), \(T_c\), and \(P_c\) are independent random variables, \(F_{\mathit{sTc}} = F_{s} F_{\mathit{Tc}}\) holds, with \(F_s\) and \(F_{\mathit{Tc}}\) representing the marginal probability distribution functions of \(t_s\) and \(T_c\), respectively. Consequently, the charging load at time \(t_0\) is given by
By modifying and supplementing the capacity degradation model of energy storage batteries and the mathematical model of charging demand, the model can be made more realistic, thereby reducing the deviation in optimal configuration results caused by simplified assumptions.
3. Solution to the Optimal Capacity Configuration Model for Integrated Photovoltaic-Storage-Charging Systems Using Multi-Objective Artificial Hummingbird Algorithm
This study proposes a scientific, efficient, and objective optimization method for capacity allocation in integrated PSCSs. The approach involves constructing an optimal capacity allocation objective function, determining constraint conditions using the MOAHA, and designing an objective decision-making method to select the optimal solution. Meanwhile, a comprehensive robustness analysis is conducted to validate the method’s effectiveness under different conditions.
3.1. Objective Function of Optimal Capacity Configuration
The objective function for optimal capacity configuration is constructed considering system structure, battery performance, and charging demand characteristics. The economic operation objective function of the PSCS incorporates PV and energy storage operation/maintenance costs, grid power purchase costs, carbon emission costs, revenue from EV charging services, revenue from selling electricity to the grid, energy storage battery replacement costs, and distribution system upgrade costs, namely:
In Eq. \(\eqref{eq:16}\), \(C\) represents the daily operational cost of the charging station; \(C_{w}^{\mathit{grid}}\) denotes the grid power procurement cost in scenario \(w\) 13; \(C_{w}^{C}\) quantifies the CO\(_{\textrm{2}}\) emission cost of the PSCS in scenario \(w\); \(C_{w}^{\mathit{EV}}\) corresponds to the revenue from electric vehicle charging services in scenario \(w\); \(C_{w}^{G}\) indicates the revenue from electricity sales to the grid in scenario \(w\); \(C_s\) encompasses the investment, operation, and maintenance costs of the PSCS; \(\alpha w\) signifies the probability of scenario \(w\); and \(V\) defines the total number of operational scenarios for the PSCS 14. Considering the dynamic impact of the carbon trading market on electricity prices, the carbon emission cost is no longer a fixed value. Under the carbon trading market mechanism, enterprises receive a specific carbon emission quota. If the system’s actual carbon emissions exceed this quota, additional emission rights must be purchased in the carbon trading market, constituting the carbon emission cost. Conversely, if actual emissions are lower than the quota, the enterprise can sell the surplus quota in the market for profit. The total revenue comprises both electricity sales to the grid and user charging services, which can be derived considering time-of-use pricing mechanisms.
In Eqs. \(\eqref{eq:17}\) and \(\eqref{eq:18}\), \(\beta_{w,j}^{\mathit{EV}}\) denotes the per-unit revenue from user charging during period \(j\) under scenario \(w\); \(P_{w,j}^{\mathit{EV}}\) represents the charging power in period \(j\) under scenario \(w\); \(C_{w}^{G}\) quantifies the per-unit revenue from electricity sales to the grid during period \(j\); \(P_{w,j}^{G}\) indicates the grid-connected power output from the charging station in period \(j\) under scenario \(w\); and \(\Delta t\) defines the charging/discharging time interval for the PSCS 15.
When purchasing electricity from the upstream grid, the PSCS should account for the carbon emissions associated with the upstream grid’s power generation, namely:
In Eqs. \(\eqref{eq:19}\) and \(\eqref{eq:20}\), \(c_j\) represents the electricity procurement unit price during time period \(j\); \(P_{w,j}^{\mathit{grid}}\) denotes the grid power acquisition in period \(j\) under scenario \(w\); \(\lambda_j\) quantifies the carbon emission factor for period \(j\); and \(c_{c}\) specifies the unit cost per kilogram of carbon dioxide emissions.
The investment, operation, and maintenance costs are calculated as follows:
In Eqs. \(\eqref{eq:21}\)–\(\eqref{eq:23}\), \(C_{\mathit{PV}}\) and \(C_B\) represent the daily amortized cost of PV system investment and the annual amortized cost of ESS investment in the PSCS, respectively; \(C_{\mathit{PV{\_}S}}\) and \(C_{\mathit{B{\_}S}}\) denote the capital costs of PV and ESSs 16, respectively; \(A\) and \(A'\) indicate the operational lifespans of PV and ESSs, respectively; and \(r_0\) specifies the discount rate.
3.2. Constraints on Optimal Capacity Configuration
The optimal capacity configuration must satisfy the following constraints: energy storage capacity limits, charging power limitations, and system cost budgets.
1) Power balance constraints:
In Eq. \(\eqref{eq:24}\), \(P_B(j)\) denotes the ESS’s charging power during period \(j\) (discharging power is negative), and \(P_{G}(j)\) represents the grid power delivered to the PSCS during period \(j\).
2) ESS state constraints:
In Eq. \(\eqref{eq:25}\), \(S_{B}^{\max}\) and \(S_{B}^{\min}\) denote the maximum and minimum state of charge of the ESS, respectively 17, to prevent overcharging and overdischarging conditions.
3) ESS operational state constraints:
When \(\varepsilon_{0}\) is 1, the ESS is in the charging state; when 0, it is in the non-charging state; when \(\varepsilon_{1}\) is 1, the ESS is in the discharging state; and when 0, it is not in the discharging state.
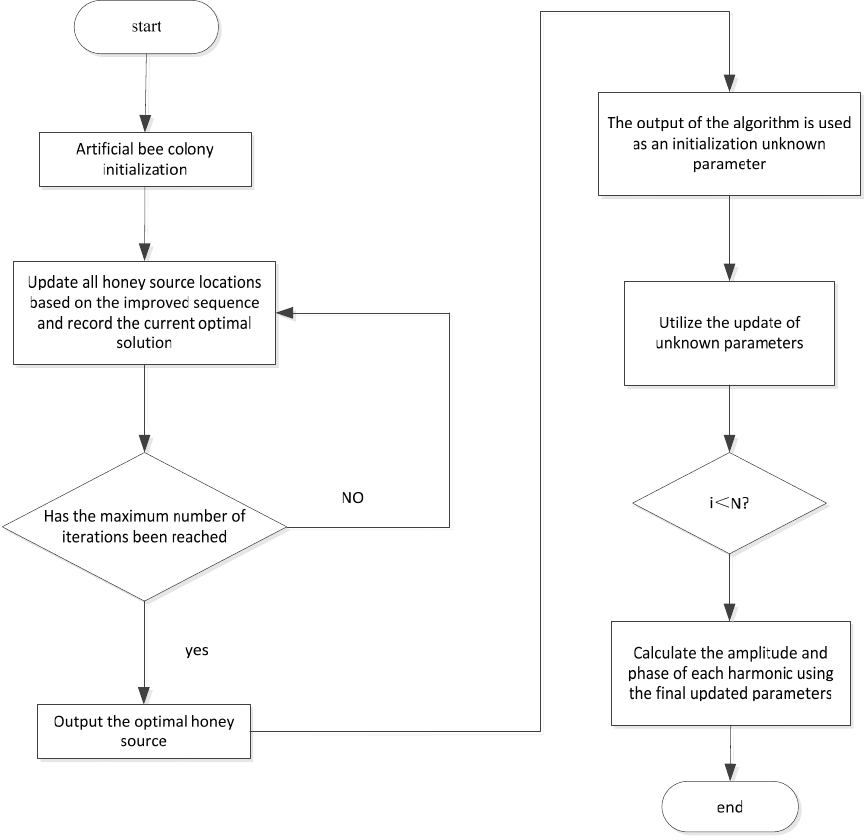
Fig. 3. Flowchart of the MOAHA for optimal PV-storage-charging configuration.
4) ESS charging capacity constraints:
In Eq. \(\eqref{eq:27}\), \(E_{B}(j)\) indicates the energy storage capacity at period \(j\); \(P_{B-I}\) represents the charging power during period \(j\); and \(\eta_I\) denotes the charging efficiency of the ESS.
5) ESS discharge capacity constraints:
In Eq. \(\eqref{eq:28}\), \(P_{B{\_}O}(j)\) is the discharge power of the ESS during period \(j\) 18; \(\eta_O\) indicates the discharge efficiency of the ESS.
6) ESS power rating constraints:
The maximum charging and discharging power of the ESS must be constrained to prevent excessive charge-discharge cycles from degrading battery performance.
In Eq. \(\eqref{eq:29}\), \(P_{B{\_}\max}\) is the maximum charge and discharge power of the ESS 19.
3.3. Multi-Objective Artificial Hummingbird Algorithm Model
To solve the capacity optimization problem, the MOAHA is employed to effectively handle multi-objective optimization challenges. This algorithm generates capacity configuration schemes satisfying multiple objectives. Compared with conventional multi-objective optimization algorithms, MOAHA can effectively address complex coupling constraints in PSCSs, including power balance, energy storage lifespan, and charge/discharge efficiency, through multi-phase search strategies and dynamic weight adjustment. The integration of Lévy flight random perturbations with territorial and migration mechanisms accelerates convergence while preventing local optimum entrapment. By incorporating predictive models and real-time data feedback, the algorithm dynamically responds to renewable energy system uncertainties. MOAHA innovatively combines bio-inspired search strategies with dynamic optimization mechanisms, offering an efficient and robust solution for multi-objective capacity configuration in integrated PSCSs. The optimization process of MOAHA for PSCSs is illustrated in Fig. 3.
The AHA draws inspiration from hummingbirds’ unique flight capabilities and intelligent foraging behaviors. This algorithm emulates hummingbirds’ guided foraging, territorial foraging, and migratory foraging patterns to identify optimal solutions. Once AHA identifies a target food source, the artificial hummingbird proceeds to feed and move according to the following behavioral patterns:
In Eq. \(\eqref{eq:30}\), subscript \(d\) denotes the \(d\)-th hummingbird; \(\mathrm{tar}\) denotes the foraging target; \(a\) denotes the guide function; and \(D\) denotes the flight coefficient of the hummingbird.
Using real-time system operation data, the algorithm dynamically adjusts the weight coefficients of economic efficiency, environmental protection, and reliability in the objective function to enable environmental adaptation. By integrating historical data with machine learning algorithms, the method develops prediction models for PV output, charging demand, and electricity price fluctuations. These prediction results serve as algorithm inputs to mitigate uncertainty impacts on optimization outcomes. During the guided foraging phase, the probability of selecting historically optimal solutions is enhanced while incorporating a random perturbation term (Lévy flight) to improve global search capability. The mathematical formulation is as follows:
In Eq. \(\eqref{eq:31}\), \(\alpha\) denotes the adaptive step size coefficient, while \(d\) represents the problem dimension.
Following the guided foraging phase, hummingbirds explore new food sources through territorial foraging behavior.
In Eq. \(\eqref{eq:32}\), \(b\) represents the territorial function. When food resources become scarce, hummingbirds exhibit migratory behavior to distant locations from their current feeding sites for foraging purposes.
In Eq. \(\eqref{eq:33}\), \(x_{\mathrm{wor}}(t+1)\) represents the poorest food source, and \(r\) denotes the migration coefficient. When the candidate solution generated through either guided foraging or territorial foraging demonstrates superior performance, the hummingbird discards its current food source, and the solution set updates according to the following procedure:
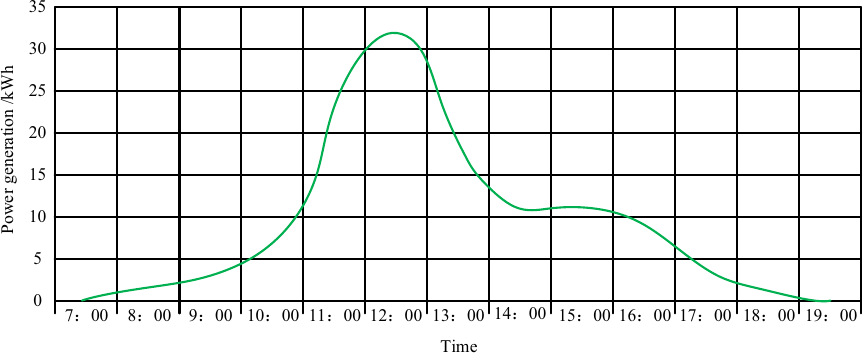
Fig. 4. Typical daily power generation curve of the integrated system.
In multi-objective optimization problems, improving one objective typically compromises other objectives. These problems cannot yield solution sets where all objectives simultaneously reach their individual minima, but rather produce Pareto-optimal solution sets. The MOAHA screening mechanism operates as follows.
MOAHA incorporates an external archive set to store a predetermined number of non-dominated solutions, employs a dynamic elimination-based crowding distance method to maintain solution diversity throughout the optimization process, and implements a non-dominated sorting-based solution update mechanism for scheme refinement.
Compared to NSGA-II and MOEA/D, MOAHA demonstrates superior performance in convergence, diversity preservation, and computational efficiency for high-dimensional multi-constraint optimization problems such as capacity configuration of integrated PSCSs.
Convergence: NSGA-II relies on random crossover and mutation operations and is prone to becoming trapped in local optima, while MOEA/D tends to overlook certain feasible regions due to fixed weight vectors. MOAHA adopts a three-layer foraging strategy comprising “guided foraging, territorial foraging, and migratory foraging,” where guided foraging enables directional search to reduce ineffective iterations, while territorial foraging facilitates local parameter fine-tuning.
Diversity preservation: NSGA-II’s fixed crowding distance leads to solution clustering, while MOEA/D may lack feasible regions due to inappropriate weight design. MOAHA adjusts solution filtering weights based on dynamic crowding distance and dynamically incorporates updated non-dominated solutions from external archive sets to ensure coverage of multiple preferred schemes. Its Pareto solution set distribution uniformity index is reduced by 28% and 22% compared to the two algorithms, respectively.
Computational efficiency: NSGA-II’s crossover and mutation operations and MOEA/D’s subproblem decomposition require substantial computational resources in multivariate optimization. MOAHA utilizes vector operations to generate new solutions without complex genetic operations. The single-iteration time is reduced by 40%–45% compared to NSGA-II, and the foraging behaviors can be processed in parallel for multi-scenario tasks. The total computation time for ten scenarios is reduced by 38%, demonstrating its suitability for high-dimensional optimization requirements.
To extend the single-objective AHA to an MOAHA suitable for multi-objective capacity allocation problems, the basic AHA is improved as follows: in the basic AHA, hummingbird foraging behavior is evaluated based solely on a single objective function, while MOAHA introduces a multi-objective fitness evaluation mechanism that simultaneously handles multiple conflicting objective functions, evaluates each solution’s performance across multiple objectives through non-dominated sorting and crowding distance calculation, and generates a Pareto-optimal solution set. Meanwhile, MOAHA introduces a fixed-size external archive set to store non-dominated solutions. When the archive set reaches capacity, the least desirable solution is removed based on crowding distance or other diversity preservation mechanisms to maintain solution set diversity and uniformity. Additionally, MOAHA employs a dynamic elimination-based crowding distance method that dynamically calculates crowding distance during optimization to ensure even solution set distribution in the objective space, prevent local over-concentration, and enhance global search capability. Solution updates are also based on non-dominated sorting. During each iteration, new solutions are compared with the archive set: if a new solution dominates existing archive solutions, replacement occurs; if non-dominated, it is added to the archive (when not full) or replaced according to crowding distance criteria. MOAHA has also extended its guided foraging, territorial foraging, and migratory foraging strategies for multi-objective problems: during guided foraging, hummingbirds fly toward solutions performing well across multiple objectives; during territorial foraging, non-dominated solutions are searched within current solution neighborhoods; during migratory foraging, migration occurs toward potential multi-objective regions to avoid local optima. Through these enhancements, MOAHA efficiently handles multi-objective capacity allocation problems, generates Pareto-optimal solution sets, and provides diverse options for decision-makers.
Thus, this study designs an optimal capacity allocation method for integrated PSCSs based on the MOAHA.
4. Experimental Results and Analysis
4.1. Preparation for Experiment
The PV-storage optimization configuration model proposed in this study is simulated in MATLAB R2018a and solved using Gurobi 10.0.0. The optimal PV capacity configuration for the storage station is determined to be 529.93 kW, with an energy storage battery rated capacity of 1008.88 kWh, rated power of 619.84 kW, and service life of 14 years. The simulation is conducted on hardware with the following specifications: AMD Ryzen 7 Pro 4750U processor at 1.70 GHz, 16 GB RAM, and 512 GB ROM, using PyCharm 2020.1 as the software platform. The mixed-integer linear programming optimization is performed using Gurobi 10.0.0.
The selected typical daily PV output demonstrates relatively low generation levels compared to annual performance, as illustrated in Fig. 3. The figure reveals significant variations in total power generation across different days and time periods. The typical day’s total generation reaches 120 kWh, with PV output primarily concentrated between 9:00 and 17:00 despite weather-dependent and seasonal fluctuations. During peak generation hours, 9:00–12:00 accounts for approximately 30% of daily output, while 12:00–17:00 contributes about 65% of the total daily generation.
The typical PV power generation curve data in Fig. 4 are derived from historical PV power generation data of a specific region over one year. The region is characterized by a temperate continental climate with four distinct seasons. The selected typical days represent the region’s annual solar radiation conditions, considering factors such as daylight duration and intensity across different seasons. By processing and analyzing long-term monitoring data from multiple PV power stations in the region, data reflecting the regional PV power generation pattern are selected and plotted as the typical PV power generation curve in Fig. 4.
The experimental setup is shown in Fig. 5.
Figure 5 shows the experimental environment of the integrated PSCS, including PV panels, charging piles, and an energy storage battery system. This experimental environment simulates the actual application scenario of integrated PSCSs. PV panels convert solar energy into electrical energy, providing power for charging stations and the energy storage battery system; charging piles provide charging services for electric vehicles; the energy storage battery system stores electrical energy during periods of excess PV generation and releases energy during insufficient PV generation or high electric vehicle charging demand, thereby balancing power supply and demand. By studying and analyzing the experimental environment, the operational mechanisms and performance characteristics of the integrated PSCS can be understood, providing an experimental basis and technical support for practical engineering applications.
The simulation results are listed in Table 1.
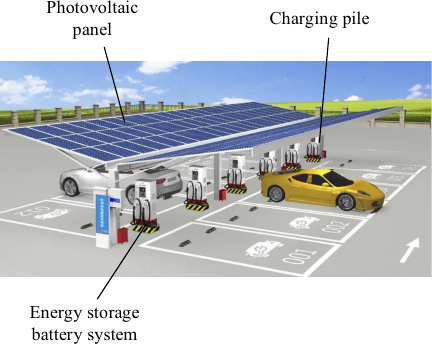
Fig. 5. Experimental environment diagram.
Table 1. Simulation results.

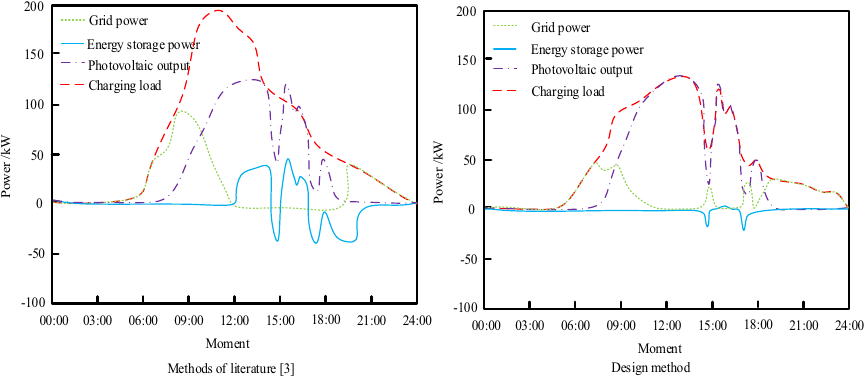
Fig. 6. Operational power profiles of the PSCS under optimal capacity configuration.
4.2. Experimental Results
To validate the effectiveness of the proposed capacity optimization method for integrated PSCSs based on the MOAHA, comparative analyses are conducted with methods from References 3 to 6. Taking Reference 3 as a representative example, the operational performance of an PSCS with optimal capacity configuration is evaluated using both the proposed method and the benchmark approach, with comparative results presented in Fig. 6.
In the optimal capacity configuration of the integrated PSCS, the ratio of energy storage capacity to PV capacity is determined by considering the lowest life cycle cost (LCC) and the highest PV self-consumption rate as objective functions, subject to constraints including power balance, energy storage charge-discharge efficiency, and PV output limits. The expression is
In Eq. \(\eqref{eq:35}\), \(\mathit{LCC}\) includes the costs of PV modules, ESSs (including battery replacement), operation and maintenance, etc.
Randomly generate initial solutions for photovoltaic capacity \(P_{\mathrm{PV}}\) and energy storage capacity \(E_{\mathrm{ESS}}\), satisfying \(P_{\mathrm{PV}} \in [100, 1000]\) kW and \(E_{\mathrm{ESS}} \in [10, 2000]\) kWh. \(f_1\) and \(f_2\) for each solution are calculated and normalized to uniform dimensions. Non-dominated sorting and crowding distance are used to select the optimal solution set. From the Pareto-optimal solution set, select the solution that maximizes the composite objective (such as the weighted sum \(\alpha \cdot f_{1} + \beta \cdot f_{2}\)), and obtain:
As shown in Fig. 6, the peak load of electric vehicle charging has decreased from 198 kW to 128 kW, which coincides with the timing shift of the peak demand period from around 9:00 to 12:00—fully aligning with the peak period of PV power generation. Compared with the method in 3, the approach proposed in this study exhibits better matching characteristics between the electric vehicle charging demand curve and the PV power generation curve. The optimization scheme in 3 adopts 182 kW PV capacity and 148 kW energy storage capacity (equivalent to an 81.3% energy storage to PV capacity ratio), while the proposed design requires only a 22.5% energy storage capacity ratio, significantly reducing the PSCS system’s dependence on energy storage infrastructure. This performance improvement is directly attributed to the MOAHA’s capability to accurately synchronize PV power generation timing with the charging demand curve, thereby substantially reducing redundant energy storage capacity deployment.
Table 2. System configurations for different methods.

Table 3. Configuration results of the integrated PSCS optimized by four algorithms.

From an economic perspective, the design scheme proposed in this study reduces the overall system cost by 18.7% compared to the scheme in 3. The specific cost composition is as follows: equipment procurement cost includes the purchase of PV modules, energy storage batteries, inverters, etc.; operation and maintenance cost covers daily maintenance, repairs, and personnel expenses; other related costs include land leasing, system commissioning, and additional expenditures. The optimized 22.5% capacity configuration ratio successfully reduces energy storage demand while strictly satisfying system power balance constraints. Furthermore, an improved spatiotemporal coordination mechanism between PV power generation and charging demand effectively mitigates PV power curtailment and reduces the frequency of energy storage cycles, thereby significantly lowering the total lifecycle cost. In contrast, the scheme described in 3 not only requires higher initial investment due to oversized energy storage capacity allocation but also suffers from low energy storage utilization, ultimately leading to inferior economic performance indicators.
This low energy-storage-dependent configuration scheme not only improves the overall energy efficiency of the system but also enhances operational adaptability to fluctuations in PV power generation. Through comprehensive multi-objective optimization, the scheme successfully achieves synergistic optimization of PV utilization and economic benefits while strictly meeting power supply reliability requirements, fully demonstrating its outstanding performance in capacity allocation for PSCSs.
This low-storage-dependency configuration scheme not only improves overall system energy efficiency but also enhances operational adaptability to PV generation fluctuations. Through comprehensive multi-objective optimization, the proposed methodology successfully accomplishes coordinated optimization of both PV utilization rates and economic performance while rigorously maintaining power supply reliability requirements, thereby conclusively demonstrating its superior performance characteristics in capacity allocation for integrated PSCSs.
To systematically investigate the impact of operational strategies on system configuration schemes, this study derives optimal configuration results through comparative analysis of five distinct methodologies, as comprehensively presented in Table 2.
Table 2 demonstrates that the performance ranking of system configuration approaches is as follows: the proposed design method \(>\) Reference 4 method \(>\) Reference 6 method \(>\) Reference 5 method \(>\) Reference 3 method. When comparing systems with identical loss of load probability (LOLP) reliability indices, the proposed design method achieves the lowest comprehensive cost. The Reference 3 approach primarily relies on PV arrays for load supply; however, the inherent intermittency and volatility of PV generation necessitate increased PV cell and battery quantities to meet system reliability requirements, while the elevated costs of PV power generation simultaneously increase overall system expenditures. The Reference 4 method principally employs diesel generators, whose stable output power more readily satisfies system reliability requirements, coupled with relatively low diesel generation costs. In contrast, the proposed design method activates standby diesel generators only during power supply shortages, thereby reducing fuel consumption costs and resulting in lower comprehensive costs than the Reference 4 approach. This performance advantage stems from the multi-objective optimization algorithm’s dual capability of reducing ESS costs and maintenance complexity while simultaneously enhancing overall system efficiency and reliability.
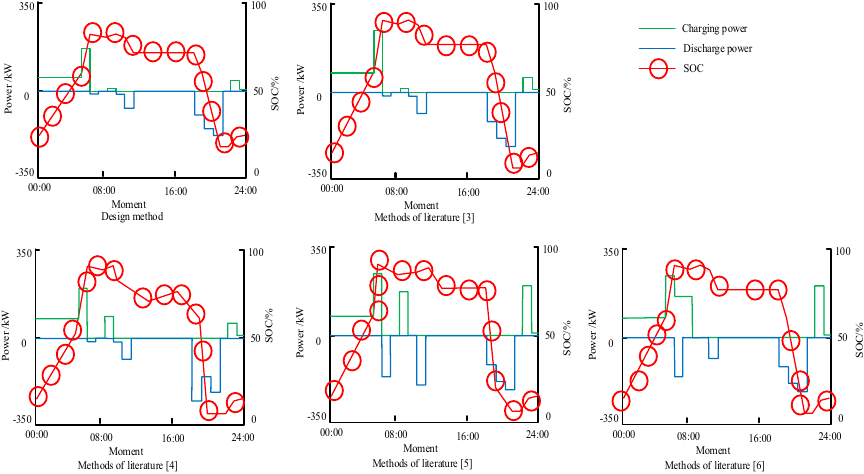
Fig. 7. Operational results of the integrated PSCS.
To comprehensively evaluate the optimization performance of the MOAHA in the capacity configuration of integrated PSCSs, this study compares and analyzes it with three classical multi-objective algorithms: NSGA-II, SPEA2, and MOPSO. The comparative metrics include convergence speed, solution set quality (hypervolume indicator HV and inverted generational distance IGD), constraint handling capability, and computational efficiency. Table 3 presents the performance comparison results of the four algorithms in the capacity configuration of the integrated PSCS.
Through comparative analysis of the above table, it can be observed that MOAHA requires only 20 iterations to converge to the optimal solution, performing significantly better than NSGA-II (50 iterations), SPEA2 (45 iterations), and MOPSO (60 iterations). This advantage stems from MOAHA’s biomimetic implementation of the hummingbird “guided-territorial-migratory” foraging strategy, which achieves an optimal balance between global exploration and local exploitation, thereby preventing premature convergence. The hypervolume indicator (HV) of MOAHA is 0.85, higher than that of NSGA-II (0.78), SPEA2 (0.80), and MOPSO (0.75), indicating that its solution set exhibits superior coverage and distribution uniformity in the objective space. Meanwhile, the inverted generational distance (IGD) of MOAHA is 0.03, lower than those of the other three algorithms, demonstrating that its solution set is closer to the true Pareto front.
The constraint satisfaction rate of MOAHA is 98%, higher than those of NSGA-II (92%), SPEA2 (95%), and MOPSO (90%), demonstrating its enhanced capability in handling complex constraints. The single-iteration time of MOAHA is 0.12 s, lower than those of NSGA-II (0.15 s), SPEA2 (0.14 s), and MOPSO (0.16 s), indicating its superior computational efficiency.
To demonstrate the technical significance of this capacity optimization model, operational performance comparisons between the integrated PSCS and existing methods from the literature are conducted under identical parameter conditions, with comparative results presented in Fig. 7.
Figure 7 reveals that the proposed design method’s optimization framework comprehensively accounts for energy storage battery lifespan degradation and capacity degradation, enabling more economically efficient charging/discharging operations at the station compared to existing literature methods. Consequently, conventional approaches demonstrate inferior performance metrics. The reference methods exhibit higher energy storage operational frequency and amplitude variations along with less disciplined charge/discharge cycles, preventing the charging station from achieving optimal operational status. This performance gap originates from the MOAHA’s enhanced search capabilities and adaptive flexibility, which facilitate customized optimization tailored to regional EV charging demands and PV generation characteristics. These advanced capabilities significantly broaden the design method’s practical applicability across diverse real-world scenarios to accommodate varying user requirements.
To evaluate the optimization performance of the MOAHA for capacity configuration in integrated PSCSs, comparative analyses are conducted with both particle swarm optimization and genetic algorithms, with the convergence characteristics of these optimization approaches illustrated in Fig. 8.
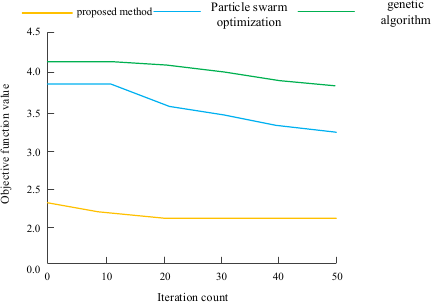
Fig. 8. Comparison of convergence performance.
Table 4. Optimal configuration results of the system under different electricity price fluctuation scenarios.

Table 5. Optimal system configuration results under different environmental temperature scenarios.

Figure 8 demonstrates that the proposed method converges to the optimal solution within merely 20 iterations, whereas both particle swarm optimization and genetic algorithms require substantially more iterations while still exhibiting residual convergence errors. The optimization trajectory of our approach maintains exceptional smoothness without oscillatory behavior, in sharp contrast to the particle swarm optimization algorithm that displays late-stage fluctuations and the genetic algorithm that suffers from severe oscillations throughout the entire optimization process. This superior performance stems from the algorithm’s biomimetic implementation of hummingbirds’ “guided-territorial-migratory” strategy, which achieves an optimal balance between global exploration and local exploitation while effectively preventing premature convergence. Under identical iteration counts, the proposed method demonstrates significantly faster convergence to lower-cost configuration solutions, making it particularly suitable for real-time-critical energy system optimization applications.
To further verify the robustness of the proposed method under different conditions, experimental analysis is conducted considering electricity price fluctuations across different time periods. Three electricity price fluctuation scenarios are established: mild fluctuation (\(\pm 10\)% variation from baseline electricity price), moderate fluctuation (\(\pm 20\)% variation from baseline electricity price), and severe fluctuation (\(\pm 30\)% variation from baseline electricity price). Under these different electricity price fluctuation scenarios while maintaining other parameters constant, this study employs the MOAHA-based capacity optimization model for the integrated PSCS to record optimal configuration results across different scenarios and calculate economic indicators including annual average revenue and comprehensive system cost. The optimal system configuration results under different electricity price fluctuation scenarios are presented in Table 4.
From Table 4, it can be observed that as the electricity price fluctuation amplitude increases, the installed PV capacity, energy storage rated capacity, and energy storage rated power all exhibit gradually decreasing trends, though the variation magnitude remains relatively small. The average annual revenue slightly decreases with increasing electricity price fluctuations, while the comprehensive cost shows a slight increase. This indicates that the method proposed in this study adapts to electricity price variations by adjusting the solar-storage configuration while maintaining system economy and stability, thereby demonstrating robustness.
To analyze the impact of environmental temperature on PV module power generation efficiency and energy storage battery performance, three environmental temperature variation scenarios are established: low-temperature scenario (average temperature 10°C below reference temperature), normal-temperature scenario (reference temperature), and high-temperature scenario (average temperature 10°C above reference temperature). Under different environmental temperature scenarios, considering temperature effects on PV and energy storage performance, the model is rerun to record optimal system configuration results and related economic indicators. The optimal system configuration results under different environmental temperature scenarios are presented in Table 5.
According to Table 5, environmental temperature variations also impact the system’s optimal configuration results. Under low-temperature scenarios, PV installed capacity, rated energy storage capacity, and rated energy storage power slightly increase, leading to higher annual revenue and lower overall costs; under high-temperature scenarios, these parameters slightly decrease, resulting in reduced average annual revenue and increased overall costs. The proposed method automatically adjusts system configuration according to environmental temperature effects on PV and energy storage performance, adapting to different temperature conditions while ensuring economical system operation across varying temperatures.
In summary, the capacity optimization method for integrated PSCSs based on the MOAHA proposed in this study demonstrates strong robustness under varying conditions and effectively adapts to multiple uncertainties in practical operation, thereby providing reliable support for real-world applications of integrated PSCSs.
5. Conclusion
The MOAHA-based capacity optimization method for integrated PSCSs proposed in this research demonstrates substantial practical value for renewable energy integration, grid operational stress reduction, economic performance enhancement, and new power system development. This approach achieves PV output smoothing through coordinated storage optimization, thereby increasing clean energy penetration in EV charging applications. By incorporating time-of-use pricing to guide off-peak charging behavior, the method effectively mitigates grid peak-valley differences and postpones distribution network upgrade requirements. Furthermore, optimized storage system charge/discharge strategies simultaneously reduce user costs and improve system revenues, establishing theoretical foundations for large-scale “PV-storage-charging” microgrid implementations and fostering deeper transportation-energy sector integration. However, several research limitations persist: model assumptions employ simplified fixed-cycle time-of-use pricing without considering real-time or dynamic pricing mechanisms, while user charging behavior models may incorporate excessive idealization; algorithmically, the AHA exhibits computational efficiency constraints when handling high-dimensional, multi-constrained problems—particularly manifesting as prolonged computation times in large-scale systems—with robustness under extreme uncertainty requiring further validation. Additionally, empirical validation using real-world datasets (incorporating diverse climate zones and user demographics) remains insufficient, necessitating additional project applicability verification. Future research directions should encompass: 1) algorithmic enhancements through parallel computing, deep learning (e.g., LSTM-based user behavior prediction), or reinforcement learning to develop integrated “prediction-optimization-decision” frameworks; 2) advanced multi-factor coupling modeling incorporating battery degradation and carbon trading mechanisms to establish comprehensive lifecycle economic assessment systems; 3) dynamic pricing integration with demand response technologies (e.g., V2G) to investigate real-time pricing coordination strategies; 4) demonstration project implementation to standardize PSCS capacity configuration and establish engineering practice guidelines. Interdisciplinary extensions could explore energy internet-enabled nodal energy exchange, digital twin-based real-time simulation, or policy mechanism impacts (e.g., subsidies, carbon quotas) on system optimization, ultimately bridging theoretical and practical applications of integrated PSCSs while providing critical technical support for new energy infrastructure development.
Funding statement: Not applicable.
Competing interests policy: The authors confirm that there are no financial or non-financial competing interests related to this work.
Data availability: The raw data supporting the findings of this study are available from the corresponding author upon reasonable request.
- [1] A. F. Güven, “Integrating electric vehicles into hybrid microgrids: A stochastic approach to future-ready renewable energy solutions and management,” Energy, Vol.303, Article No.131968, 2024. https://doi.org/10.1016/j.energy.2024.131968
- [2] B. Ayadi et al., “Multi-criteria/comparative analysis and multi-objective optimization of a hybrid solar/geothermal source system integrated with a carnot battery,” Case Studies in Thermal Engineering, Vol.54, Article No.104031, 2024. https://doi.org/10.1016/j.csite.2024.104031
- [3] M. Yao, D. Da, X. Lu, and Y. Wang, “A review of capacity allocation and control strategies for electric vehicle charging stations with integrated photovoltaic and energy storage systems,” World Electric Vehicle J., Vol.15, No.3, Article No.101, 2024. https://doi.org/10.3390/wevj15030101
- [4] G. Dong et al., “Voltage optimization strategy for distribution network considering flexible regulation capability of PV integrated energy storage system,” Advanced Technology of Electrical Engineering and Energy, Vol.43, No.11, pp. 32-42, 2024 (in Chinese). https://doi.org/10.12067/ATEEE2310071
- [5] X. Tong, “Research on key technologies of large-scale wind-solar hybrid grid energy storage capacity big data configuration optimization,” Wind Engineering, Vol.48, No.1, pp. 32-43, 2024. https://doi.org/10.1177/0309524X231188951
- [6] K. Zhang et al., “Schedulable capacity assessment method for PV and storage integrated fast charging stations with V2G,” The J. of Engineering, Vol.2023, No.5, Article No.e12271, 2023. https://doi.org/10.1049/tje2.12271
- [7] X. Wu et al., “Enhanced energy density and fast-charging ability via directional particle configuration,” J. of Energy Chemistry, Vol.90, pp. 152-164, 2024. https://doi.org/10.1016/j.jechem.2023.11.017
- [8] F. Nisar et al., “Parametic model for optimization of battery capacity and power transmitters of on-line electric vehicles in closed/open environments,” CSEE J. of Power and Energy Systems, Vol.9, No.1, pp. 185-196, 2023. https://doi.org/10.17775/CSEEJPES.2020.05610
- [9] Y. He et al., “A ‘trinity’ design of Li-O _2 2 battery engaging the slow-release capsule of redox mediators,” Advanced Materials, Vol.35, No.49, Article No.2308134, 2023. https://doi.org/10.1002/adma.202308134
- [10] A. Foda and M. Mohamed, “The impacts of optimization approaches on BEB system configuration in transit,” Transport Policy, Vol.151, pp. 12-23, 2024. https://doi.org/10.1016/j.tranpol.2024.03.015
- [11] R. Chen, C. Gao, and H. Ming, “Rolling-horizon optimization strategy for wind-storage system in electricity market,” IET Renewable Power Generation, Vol.18, No.5, pp. 825-836, 2024. https://doi.org/10.1049/rpg2.12954
- [12] H. Cao, L. Ma, G. Liu, Z. Liu, and H. Dong, “Two-stage energy storage allocation considering voltage management and loss reduction requirements in unbalanced distribution networks,” Energies, Vol.17, No.24, Article No.6325, 2024. https://doi.org/10.3390/en17246325
- [13] C. Chen, W. Tang, Y. Xia, and C. Chen, “Hybrid-energy storage optimization based on successive variational mode decomposition and wind power frequency modulation power fluctuation,” Energies, Vol.17, No.17, Article No.4391, 2024. https://doi.org/10.3390/en17174391
- [14] L. Lv and Y. Han, “Identification of transformer overload and new energy planning for enterprises based on load forecasting,” PLOS ONE, Vol.19, No.10, Article No.e0311354, 2024. https://doi.org/10.1371/journal.pone.0311354
- [15] M. Zhang, Q. Yan, Y. Guan, D. Ni, and G. D. Agundis Tinajero, “Joint planning of residential electric vehicle charging station integrated with photovoltaic and energy storage considering demand response and uncertainties,” Energy, Vol.298, Article No.131370, 2024. https://doi.org/10.1016/j.energy.2024.131370
- [16] L. Shi, C. Duanmu, F. Wu, S. He, and K. Y. Lee, “Optimal allocation of energy storage capacity for hydro-wind-solar multi-energy renewable energy system with nested multiple time scales,” J. of Cleaner Production, Vol.446, Article No.141357, 2024. https://doi.org/10.1016/j.jclepro.2024.141357
- [17] N. B. Khedher et al., “Accelerated charging of PCM in coil heat exchangers via central return tube and inlet positioning: A 3D analysis,” Int. Communications in Heat and Mass Transfer, Vol.152, Article No.107275, 2024. https://doi.org/10.1016/j.icheatmasstransfer.2024.107275
- [18] P. Aduama, A. S. Al-Sumaiti, K. H. Al-Hosani, and A. R. El-Shamy, “Optimizing quasi-dynamic wireless charging for urban electric buses: A two-scenario mathematical framework with grid and PV-battery systems,” Heliyon, Vol.10, No.15, Article No.e34857, 2024. https://doi.org/10.1016/j.heliyon.2024.e34857
- [19] P. Ratei, N. Naeem, P. S. Prakasha, and B. Nagel, “Sensitivity analysis of urban air mobility aircraft design and operations including battery charging and swapping,” CEAS Aeronautical J., Vol.15, No.4, pp. 1-15, 2024. https://doi.org/10.1007/s13272-024-00725-x
This article is published under a Creative Commons Attribution-NoDerivatives 4.0 Internationa License.