Research Paper:
Development of an Innovation Media Model Using Artificial Intelligence for Predicting Depression
Patcharin Boonsomthop†
 and Chutisant Kerdvibulvech
National Institute of Development Administration
148 Serithai Road, Klong-Chan, Bangkapi, Bangkok 10240, Thailand
†Corresponding author

This study aimed to develop innovative media using artificial intelligence (AI) to predict depression from social media texts. Utilizing natural language processing techniques and machine learning algorithms, the developed model focused on analyzing words, messages, or images that tend to indicate negative, neutral, or positive emotional states. Data were sourced from social media platforms such as Facebook, X (Twitter), and Instagram. These data were processed through sentiment analysis to categorize the messages into three levels of severity: severe, moderate, and mild. The predictive data were validated by experts from various fields, including computer science and information technology, psychology, and media studies, to ensure accuracy and reduce potential biases in the model. The findings indicated that the naïve Bayes classifier demonstrates the highest efficiency in predicting negative sentiment, achieving an average accuracy of 88.17% for training sets and 85.00% for testing sets. The F1-measure for negative messages reached 76.70%, reflecting the model’s strong capability to detect depression-related text. However, the model encountered limitations in predicting neutral messages, particularly those involving sarcasm or metaphorical expressions. This research highlights the potential of AI applications in predicting and managing depression on social media. The system can provide timely alerts to individuals at risk and recommend seeking professional psychiatric consultation, offering an effective approach for early detection and intervention in depressive disorders.
1. Introduction
Over the past decade, Thailand has seen an increase of over 200% in the number of psychiatric patients (from 1.3 million in 2015 to 2.9 million in 2023). In the first quarter of 2024, 17.20% (over 500,000 people) are at risk of depression and 10.63% (over 300,000 people) are at risk of suicide. This is partly due to increased time spent on digital media, leading to mental health issues, decreased happiness and motivation, feelings of loneliness, isolation, hopelessness, strained relationships, and increased suicidal thoughts 1,2. This aligns with research by 3,4, which states that continuous social media use for more than 5–6 hours a day, can lead to stress and social isolation. Exposure to online stimuli, cyberbullying, and posting negative comments or images reflecting sadness are dangerous signs of depression. In particular emotional expressions that may be ignored by the general public, without careful observation, one might not realize that the individual is suffering, often becoming aware only after the person has tragically succeeded in committing suicide 3,5,6.
Based on previous research studies, artificial intelligence (AI) has been utilized to detect words or hashtags on Twitter (#depress, #hopeless, #tired) or to analyze voice and text through machine learning (ML) systems, achieving more than 90% accuracy in predicting depression 7,8. However, these technologies still have limitations, including a lack of actual implementation and the absence of alert systems. In addition, most existing studies have primarily focused on comparing the performances of various AI models. For example, the demonstrated effectiveness of CNN-LSTM and TCN models in predicting depression based on students’ facial expressions, as well as ML and deep learning (DL) techniques for predicting depression through the analysis of various mental health conditions. Furthermore, hybrid models that combine ML and DL have achieved higher accuracy compared to traditional single-model approaches 9,10,11. Moreover, studies on Thai natural language processing (Thai-NLP) indicate that there is a significantly limited amount of research compared to other languages. For example, research has included comparisons of algorithms through text mining of Twitter data, proposing sentiment analysis models based on social media reviews on Facebook, and developing and evaluating quality prototypes of games aimed at enhancing the communication skills of individuals experiencing depression 12,13,14. These approaches primarily focus on model development, which has yet to be applied in real-world environments, with the goal of achieving scientific validation and social outcomes that encourage social media communication to show empathy. This can help individuals with depression feel valued and discover meaning in their lives. Moreover, Thai lacks specific domain-related corpora (especially emotional or symptom-related terminology), which are crucial resources for language processing 15. In addition, Thai language processing faces the challenge of word segmentation (Thai Tokenization) because of the absence of spaces between words, which results in difficulties in breaking words. This study aimed to develop innovations capable of predicting Thai words and emotional images to assist users in benefiting from social media interactions in their daily lives.
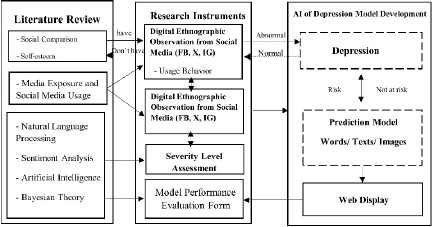
Fig. 1. Research conceptual framework.
This study examines relevant concepts to develop a tool for collecting data on words, messages, and images from platforms frequently used by individuals with depression, including Facebook, X, and Instagram. The collected data were categorized by severity and used as input to develop the most effective model for predicting depression in Thai language. The system was tested in a real environment on the X platform, and the results were displayed via a web interface. The system’s performance was evaluated by 30 experts to ensure reliability and accuracy. Additionally, incorporating human reviews and verification enhances the credibility of the system by increasing its trustworthiness. Moreover, the ability to classify the severity levels of text or images that indicate the risk of depression in the Thai language will improve precision and effectiveness when applied to Thai people in cyberspace who may be unknowingly experiencing depression. This helps prevent depression and reduces the risk of loss of life. Users feel as if they have friends listening to them and understanding their problems. In alignment with the survey findings from the New Ground organization regarding Thai youth opinions, it has been reported that the most desired gift from adults is listening to and understanding (25%), which is twice as much as receiving money (11%) 16. This is illustrated in the research framework shown in Fig. 1.
The research was guided by the following questions: 1) What is the nature of the prediction model developed using AI for words, messages, or images that indicate depression risk among social media users? 2) How accurate is the prediction system for screening individuals at risk for depression?
Scientific Contributions
The researcher has established the main themes of the research presentation as follows:
-
1)
Development a machine learning-based depression prediction model to predict words, messages, or images that indicate the risk of depression among social media users, with alert notification capabilities.
-
2)
Evaluation of the accuracy of the depression prediction model in screening individuals at risk of depression on social media.
This paper is organized as follows. Section 2: literature review, Section 3: research methodology, Section 4: research results, Section 5: discussion, and Section 6: conclusion.
2. Literature Review
This research survey encompassed concepts related to social media usage in connection with depression and the application of AI. These serve as foundational guidelines for the development of innovative media models capable of predicting depression through data derived from social media platforms.
2.1. Concept Related to Social Network Usage and Depression
Reference 17 found that individuals experiencing depression used social media to learn from others’ experiences and share personal stories. Similarly, reference 18 indicated that social media use among adolescents aged up to 25 years provides benefits; although it does not directly reduce psychological symptoms, users perceive social media as a safe space where they can seek information and find encouragement through online media. Conversely, this study shows that social media platforms have become spaces where researchers can infer what individuals are facing and identify barriers that prevent users from seeking mental health treatment. These insights were gathered by analyzing posts, shares, and comment interactions. However, excessive and continuous use of social media has been shown to negatively impact mental health and increase the risk of depression 19,20. According to 21, high-volume social media usage, particularly Facebook, correlates with depressive symptoms. Therefore, the development of tools or strategies to mitigate these adverse effects is necessary. This study applied AI to predict the depression status of social media users, thereby enabling the prevention of potential negative impacts on Thai users. This aligns with the proposal of 20, which emphasizes the need for cautious and mindful use of social media. The focus should be on detecting depression through social media, particularly utilizing visual and spatial data. Collaboration between mental health experts and computer scientists is essential for improving the methods of identifying depression on social media platforms, thereby transforming social media into a safe space for discussing sensitive topics such as mental health disorders 22. To develop this AI model, the researcher utilized words, messages, and images to create tools for predicting depression. This serves as a social monitoring system that enhances alert notifications via the X accounts of users who post high-risk content, aiming to prevent individuals from unknowingly experiencing depression. This approach integrates communication science, innovative technology, and mental health to provide a comprehensive solution.
2.2. Concept of Natural Language Processing
NLP is a branch of AI that enables computers to understand, interpret, and process human languages used in daily communication 23. This involves segmenting the text or sentences and training the computer to comprehend their meanings. Subsequently, NLP analyzes the relationships within the data and processes this information to convey complex semantic content. Reference 24 developed a depression detection system based on the Weibo platform using web scraping techniques. This study compared several models, including support vector machine (SVM), naïve Bayes (NB), convolutional neural network (CNN), and XLNet. The experimental results indicated that XLNet, which was based on the transformer architecture, produced the most accurate outcomes. However, this model has limitations related to device memory capacity and training time. Achieving higher accuracy required longer training periods, and the dataset did not distinguish between severe and mild depressive states. Therefore, this study aims to address this gap by incorporating psychiatric expert assessments to classify the severity level of messages prior to training the model, thereby enhancing its accuracy. References 25,26 stated that transformer models are commonly trained on parallel corpora, which presents a limitation in requiring increased memory capacity with the length of the data 27. When collecting posts from individuals at risk for depression, lengthy data such as expressions of emotional distress regarding their symptoms or sharing feelings about their experiences may be encountered. Therefore, models that offer high efficiency with relatively short processing times were selected. According to 28, Transformer models require large volumes of data for training, posing challenges for scenarios with limited data. In this study, where data were collected from social media over the past three months, there was a higher risk of overfitting owing to the limited dataset size.
Reference 29 developed methods for detecting depression in Thai using three neural network algorithms: 1) BiLSTM, 2) Thai-BERT, and 3) WangchanBERTa. The results showed that WangchanBERTa, which utilizes the Newmm word segmentation technique, achieved the best performance, with an F1-score of 74.2%, recall of 74.2%, precision of 74.7%, and accuracy of 74.2%. Although this study tested recent language learning models, their performance scores may have been insufficient for real-world applications. Additionally, the limitations of transformer architectures, such as high resource consumption and long training times, have motivated researchers to explore alternative models that are more resource-efficient and faster. Reference 30 stated that the Bayes classifier demonstrated the highest accuracy in distinguishing depression from text on Twitter, because it yielded the most reliable results when tested on real-world datasets. Therefore, NB was chosen as the approach for developing the model. Similarly, reference 26 noted that although Transformers are newer models, their complex decision-making processes make it difficult to explain, interpret, and predict, which is an important consideration for practical applications such as medical diagnostics. In this study, because collaboration with psychiatrists is essential, the prediction results need to be presented in an understandable manner that does not place an additional burden or take extra time for psychiatrists to interpret. Therefore, the researcher anticipates that NB is more suitable, given the available data volume, resources, and processing time allocated for the study, and the researcher’s capacity. Conversely, reference 31 employed four models: extreme gradient boosting (XGB) classifier, random forest, logistic regression, and SVM. They found that the support vector machine (SVM) and logistic regression produced more accurate depression predictions on Twitter when applied to existing datasets. Among these, logistic regression demonstrated higher accuracy than SVM and required less processing time, making it suitable for deployment in real-world scenarios. The results of this study indicate that different algorithms may exhibit varying levels of performance depending on the specific context. Therefore, it is essential to conduct testing within the research context to identify the model that offers the best performance, thereby ensuring optimal outcomes for subsequent R&D.
2.3. Concept of Sentiment Analysis
Sentiment analysis involves the examination of emotions expressed in textual data and is utilized to understand public opinions about daily life and various topics 31. Because emotions influence decision-making, detecting emotional states is a scientific approach that provides humans with an advantage by understanding how to approach or communicate with others, especially among groups at risk of depression 32. Therefore, detecting emotional sensitivity related to depression through words, messages, or images posted by users on social media can enhance the understanding between humans and computers, leading to greater empathy and improved detection of at-risk users.
Sentiment analysis categorized depression-related messages into positive (positive words), neutral (neutral words), and negative (negative words) 33. Python was used to process these classifications, which often involve multi-dimensional sentiments that simultaneously encompass both positive and negative aspects. Reference34 explained that the process involves segmenting text into individual words (using the PyThaiNLP library) and then analyzing the relationships between words and existing documents in vector form. The researcher developed the model using the NB algorithm (employing NLTK), which processes the input text by segmenting it into words and then applying the trained model to output a classification, such as the sentiment of the text. Example: “สู้ ๆ นะคะ คนเก่งทุก ๆ คนเลย #โรคซึมเศร้า” is a positive message, while “ต้องให้แตกสลายอีกกี่ครั้งหรอเราถึงจะได้จากไปโดยไม่รู้สึกผิดสักที #โรคซึมเศร้า #ครอบครัวไม่ใช่เซฟโซน” is a negative message, and so on.
This approach facilitates the analysis of textual messages and images to determine whether the expressed emotion is positive, negative, or neutral among users at risk of depression. Some studies have combined sentiment analysis and emotion detection within a single model to extract in-depth insights from opinionated content 32. For example, reference 8 used AI to predict depression on Twitter by detecting hashtags such as #depress, #hopeless, #nervous, #worthless, #tired, etc., posted daily. However, this method primarily compares levels of depression across days and cannot accurately identify individuals who are truly at risk for depression. Similarly, reference 7 applied ML to predict depression through voice analysis, showing that AI can make accurate predictions; however, it requires large amounts of voice data, must be supervised by medical professionals, and does not provide alerts to at-risk individuals to encourage self-awareness or prompt treatment. Additionally, reference 35 developed a system for detecting potentially depressive sentences on X by comparing the accuracies of two algorithms, which achieved a prediction accuracy of over 94%. This recommendation suggests that depression should be studied at the individual level to improve accuracy in predicting depression status. Therefore, this study aims to address this gap by developing a system capable of sending alerts to each user’s X account when it detects that the user has posted words, messages, or images indicating a high risk.
2.4. Knowledge of Artificial Intelligence Systems
A model refers to a set of mathematical or probabilistic relationships between different variables and is commonly known as machine learning 36,37. This enables computers to learn patterns and discover relationships within data to facilitate predictions or decision-making. Data are typically divided into training and test sets according to specified proportions, such as \(60 {:} 40\) or \(70 {:} 30\). The average accuracy tends to increase as the size of the training set increases 38, as cited in 39. Raw data for text classification using various neural network algorithms, such as NB, logistic regression, and SVM, are often complex and unstructured. Therefore, preprocessing steps are necessary, including data cleaning, tokenization into groups, removing meaningless words (stop words), reducing words to their root forms, and converting words into vector representations of numbers (text vectorization) to enable machines to understand textual meanings. After preprocessing, the performance of the model is evaluated by measuring prediction accuracy. If the results are unsatisfactory, then parameter tuning or alternative algorithms can be employed 29. For example, in 40 depression was predicted using user posts. Data were transformed into vectors using a CountVectorizer and TF-IDF Vectorizer, then trained with ML techniques such as NB, SVM, decision trees, random forest, and \(K\)-nearest neighbors (KNN). The words were processed using a dictionary to determine positive or negative sentiments. The data quality was further enhanced by removing special characters and unnecessary symbols using regular expressions, and preprocessing techniques such as stop-word removal, lemmatization, and tokenization were applied. This aligns with the research procedure use in the present study. However, if the training data for the model are of poor quality or insufficient quantity, it may lead to issues related to data imbalance. To address this issue, reference 41 proposed ERNIE 3.0 Hybrid Prompt-Suicide, which utilizes ERNIE 3.0—a language model capable of enhanced knowledge integration—designed to detect suicidal intent through a prompt-based classification suitable for resource-limited settings (mitigating overfitting issues with small datasets). The approach follows the “pre-train, prompt, predict” methodology, developing hybrid template prompts that transform original data into formats with unfilled slots. This method achieves an accuracy of 87.6%. The model exemplifies the application of advanced AI and DL techniques to improve performance in low-resource scenarios. However, this approach requires the integration of electronic health records (EHR) data. Because of the researcher did not utilize health data or involve patients due to ethical restrictions on human research in Thailand, this study proposes methods for detecting depression through users’ social media activity as an alternative.
For the Thai language, reference 42 developed a Thai depression dataset and compared it with four DL models. They used PyThaiNLP for sentence segmentation, divided the data into training, validation, and test sets, and applied ThaiVec for word embedding. The results showed that Thai BERT achieved the highest performance, with an overall accuracy of 77.53%.
Additionally, reference 43 predicted depression signals in Thai tweets by collecting data via the TweePy library from hashtags such as #depression, #depressivedisorder, and #suicide, totaling 3,100 messages. Data labeling was performed by mental health experts, followed by data cleaning using PyThaiNLP. Oversampling was applied using the SMOTE technique. The study found that the LSTM \(+\) ReLU model offered good performance and accuracy and was then implemented in a prototype web application for model testing. However, these studies collected fewer data points and used different models. Therefore, this approach provides a basis for conducting research in the Thai language, where the optimal predictive model for identifying messages at risk for depression needs to be tested. The results help determine the extent to which the findings differ from previous research outcomes.
From the previous discussion, it is clear that before deploying a model in real-world applications, its performance must be evaluated to identify the most effective model for predicting depression. Common evaluation metrics include accuracy, precision, recall, and F1-score 36. Additionally, cross-validation can be performed using test data to assess the model’s performance under conditions that closely resemble actual usage 29. Generally, classification models are evaluated using a confusion matrix, which is a \(2\times 2\) table displaying the ability of the model to distinguish between classes, as shown in Table 1.
In Table 1, TP refers to the model predicting “depressed” when the actual outcome is “depressed.” TN indicates the model predicting “not depressed” when the actual outcome is “not depressed.” FP occurs when the model predicts “depressed” but the actual outcome is “not depressed.” FN means the model predicts “not depressed” but the actual outcome is “depressed.” These values were calculated using the formulas listed in Table 2.
Table 1. Confusion matrix classification.
|
Actual values Predicted values |
Positive (1) (depressed) |
Negative (0) (not depressed) |
|---|---|---|
| Positive (1) (depressed) |
True positive (TP) (depressed) |
False positive (FP) (not depressed) |
| Negative (0) (not depressed) |
False negative (FN) (depressed) |
True negative (TN) (not depressed) |
Table 2. Formulas for calculating model performance.
| \(\quad \textbf{Accuracy}=\dfrac{\textrm{TP}+\textrm{TN}}{\textrm{TP}+\textrm{TN}+\textrm{FP}+\textrm{FN}}\) |
| \(\quad \textbf{Precision}=\dfrac{\textrm{TP}}{\textrm{TP}+\textrm{FP}}\) |
| \(\quad \textbf{Recall}=\dfrac{\textrm{TP}}{\textrm{TP}+\textrm{FN}}\) |
| \(\quad \textbf{F1-measure}=2\times \dfrac{\textrm{Precision}\times\textrm{Recall}}{\textrm{Precision}+\textrm{Recall}}\) |
Typically, models that predict “Yes” with only slight confidence tend to have high recall but low precision, while models that predict “Yes” only when they are highly confident tend to have low recall but high precision. Frequent positive predictions can result in numerous false positive, whereas frequent negative predictions can result in numerous false negative. Therefore, increasing the threshold in the model enhances the testing accuracy but can also reduce recall. In such cases, selecting an appropriate threshold involves determining a balanced trade-off between precision and recall 36.
2.5. Bayesian Theory
Bayesian theory involves mathematical equations that utilize probability and statistics for computation. It is used in conjunction with neural networks to estimate parameters based on the likelihoods of different parameter occurrences. The fundamental principle of NB is to count (frequency) occurrences of items, calculate their probabilities, and compare them. The data used for training, including features (independent variables: \(x\)) and targets (dependent variable: \(y\)), should be suitable for classification or categorization into groups 37. According to 44, Bayesian models represent graphs that effectively describe the joint probability distributions of multiple random variables. They can capture conditional, dependencies clearly, thereby providing advantages over general classification models. These models can incorporate expert opinions into their graphical structures, generate interpretable predictions, provide uncertainty alerts, and handle missing data naturally. This has led the researchers to consider Bayesian methods as a feasible approach for predicting depression Bayesian methods have been found to effectively capture complex relationships between symptoms and various factors associated with depression. They demonstrated high performance in addressing misdiagnosis issues based on the DSM-V and ICD-10 criteria for predicting depression in Nigeria 45. Similarly, the risk prediction model for depression (PDRM) developed in 46, which compared prediction results with outpatient data diagnosed with depression, showed that the recall values were 0.92 for NB, 0.86 for logistic regression, and 0.84 for SVM, indicating a strong predictive capability. The aforementioned study indicate that Bayesian methods can be effectively integrated into existing clinical practices, rendering them viable AI models for further development. Therefore, this approach was adopted as a guiding framework for the development process. Reference 47 analyzed opinions related to depression on Instagram using NB and developed an application that visualized analysis reports in a graphical format. They employed a lexicon-based technique to label data. The results indicated that the NB performed effectively, achieving an accuracy rate of 82.55%. The study provides a foundation for presenting prediction results through a web interface, making it easier for experts to interpret and understand the data.
In the context of Thai research, reference 48 developed a sentiment analysis model for monkeypox misinformation on X, utilizing BERT for classification. Although capable of analyzing sentiments, this model demonstrated lower accuracy, precision, and recall than models employing NB. Meanwhile, reference 49 applied NB for text classification to analyze tourists’ emotions toward visited locations and found that NB delivered good performance with a simple working procedure relative to other methods. Additionally, reference 50 used NB to classify rubber tree species with unknown varieties and achieved an accuracy of 98.02%, indicating a high level of precision. However, these studies rarely report the use of NB to predict depression, highlighting a gap in the current research landscape. These studies demonstrated that NB possesses notable potential, exhibiting good performance and high efficiency. This makes it suitable for testing and practical application in real-world scenarios. According to 37, NB offers several advantages, including a simple learning process and quick comprehension, low computational resource requirements, rapid output generation, flexibility in adding or removing data samples, support for both continuous (e.g., \(x_1, x_2,\ldots\)) and discrete data, immunity to overfitting, easy management of missing data, and the ability to handle large volumes of data efficiently. However, a notable disadvantage is that if the predicted value does not appear in the training data, the frequency will be zero, which can lead to prediction errors.
Based on a review of the above research concepts, the researcher designed a flowchart illustrating the research process to facilitate the study, as shown in Fig. 2.

Fig. 2. The research process.
3. Research Methodology
3.1. Population and Sample Group
The researcher divided the study into two groups:
-
1)
Social media utilized by individuals at risk of depression to express their feelings through words, messages, or images, totaling 15,043 posts on three platforms:
-
1.1)
Facebook:
-
Facebook Groups: The top five Thai depression-related groups with the largest membership are “If you have depression, we are friends,” “Depression,” “Depression, panic, bipolar, we will fight together” (Thailand Mental Health Support), “Recommendations for depression, bipolar disorder, schizophrenia, other psychiatric conditions,” “Depression relief without medication” 51 with 2,150 posts.
-
Facebook Pages: The top five Thai pages with the most followers or likes are “Mental health consultation page,” “Messages from depression patients,” “Depression, dear friend,” “Absorbing without getting depressed,” “When I got sick with depression” 52, totaling 574 posts. The combined number of posts from these sources was 2,724.
-
-
1.2)
X selected tweets based on the most recent (latest) hashtags and those with the highest number of likes or retweets (top) each day. Specifically, negative tweets were collected from #โรคซึมเศร้า (#depression) and #ซึมเศร้า (#depressed), totaling 9,497 tweets, while positive tweets were gathered from #คนเก่ง (#talented), #ความสุข (#happiness), #ซึมเศร้าเพื่อนรัก (#depression my dear friend), #มีความสุข (#joyful), #สนุกสนาน (#fun), #สู้ต่อไป (#keep going), #สู้นะ (#cheer up), #ให้กำลังใจ (#support), and #ฮีลใจ (#healing) amounting to 1,594 tweets. The total number of tweets collected was 11,091.
-
1.3)
Instagram selected posts based on images uploaded from various accounts with the hashtags #โรคซึมเศร้า (#depression) and #ซึมเศร้า (#depressed) 53, totaling 1,228 posts.
-
1.1)
-
2)
Experts practicing in government or private sector organizations in Thailand and possessing expertise in the fields of psychology, information technology/innovation, and communication sciences, evaluated the accuracy of the predictions. These professionals or academics have at least five years of practical experience and hold academic positions at the assistant professor level or higher, with doctoral degrees or equivalent academic qualifications. Purposive sampling was used to select 30 individuals based on the purpose of the study. This sampling was conducted through simple random selection focused on purposeful criteria 54,55.
3.2. Research Procedure
This study aims to develop an AI model to predict depression based on social media usage. The implementation proceeded according to the following steps:
-
1)
Data were collected retrospectively over the past three months from the specified hashtags. Screenshots were used to extract words, messages, and images for the analysis. Keywords or phrases commonly posted by at-risk groups were identified, and messages were categorized accordingly. The number of posts in each category was then counted to support further analyses.
-
2)
The collected data were reviewed by three psychiatrists who independently assessed and categorized the messages, including rating the severity levels of the words. To reduce the risk of bias and enhance the reliability of the findings, a triangulation approach was employed, specifically interdisciplinary triangulation, in which the multiple expert opinions were compared and synthesized to achieve a consensus, ensuring more robust validity of the categorization and severity assessments.
-
3)
Sentiment analysis involves categorizing words, messages, and images into three emotional groups: positive, neutral, and negative 33.
-
4)
The steps for developing the AI system are as follows:
-
4.1)
Preparing the data for analysis: Data collection involved retrieving both positive and negative tweets, which were then organized into a DataFrame format using the Pandas library. The NLTK library in Python was used to analyze the data. The accuracy of the data was verified and validated by three experts to ensure the reliable identification of words or messages indicative of depression, thereby enhancing the effectiveness of the analysis.
-
4.2)
Cleaning the data: The process begins with word segmentation and analyzes the relationships between words and a lexicon stored in vector form. Non-informative data, such as URLs, special symbols, numbers, and punctuation, were removed. Slang and its abbreviations were expanded into their full forms, and emojis and smiley faces were replaced with their corresponding true emotional expressions instead of being discarded. The images were classified into positive, negative, or neutral categories. These steps were performed by the researcher and validated for accuracy by a programmer.
-
4.3)
Normalization: Words were transformed into canonical forms to standardize and group synonymous terms by reducing them to their root or base forms. This process employs techniques such as stemming and lemmatization. The steps were performed by the researcher, and the accuracy was subsequently verified by a programmer.
-
4.4)
Building and evaluating model: Text data were transformed into feature vectors using CountVectorizer from the scikit-learn library, which converts text into a frequency-based vector representing how often each term appears. Important parameters such as “min_df” are applied to filter out terms that occur less than the specified threshold, while “max_features” is used to select only the most frequent words. Subsequently, a Gaussian NB model was employed to classify the texts based on these vectors.
-
4.5)
Performance evaluation: The hold-out validation method was employed by randomly splitting the entire dataset into two parts: 70% for the training set and 30% for the testing set. This was implemented using the “train_test_split()” function from the scikit-learn library, with the “random_state” parameter set to ensure reproducibility of results. This approach increases the reliability of the model performance evaluation and reduces bias from random data splitting. Additionally, we applied \(k\)-fold cross-validation with \(k\) set to 5, which is a widely accepted standard in ML research. This process involvs dividing the complete dataset into five folds. The model was trained over five iterations, each time using four folds for training and one fold for testing, rotating through all folds until each fold served as a test set. In this study, TfidfVectorizer was combined with multinomial NB within a pipeline, and cross-validation was performed using the “cross_val_score()” function from scikit-learn. The results showed an average accuracy of 75.42%, with similar accuracy across all folds, indicating that the model was stable (robust) and reproducible.
-
4.6)
Deploy and diagnose depression: The trained model is deployed to predict real-world data on X, as this platform does not impose restrictions related to data privacy. If continuous negative tweets are detected over a period of more than two weeks, indicating a potential risk of depression 56, the system automatically sends a notification to the user advising them to consult a mental health professional.
-
4.1)
-
5)
The accuracy of the system is evaluated by comparing its performance metrics with assessments provided by experts. The research process is illustrated in Fig. 2.
3.3. Data Collection
-
1)
Documents, theories, research studies, and various media were reviewed to establish the conceptual framework of this study.
-
2)
Data were collected through observation of digital ethnography across the three platforms, recorded, and organized in Microsoft Excel. Non-participant observation was employed to avoid disturbing the environment of the sample group and prevent sensitive mental health issues among individuals at risk of depression. This approach minimizes potential bias related to demographic factors such as age, sex, or background. In total, 15,043 posts were collected.
-
3)
The categorization and severity of the words were classified into three levels. To reduce expert bias, the severity assessment is based on the criteria established by 57, which categorizes depression risk among suicidal patients into three levels: low, moderate, and high (based on depression assessment scores (\(\mathrm{9Q} \ge 7\)) and suicide risk evaluation (\(\mathrm{8Q} \ge 1\))). This classification aims to align psychiatrists’ evaluations (3 levels) with the three groups used in sentiment analysis inputs: positive (1), neutral (0), and negative (\(-1\)) 33. Adopting standardized criteria helps minimize errors related to probabilistic predictions, thereby enhancing the accuracy and reliability of the model’s predictions, presenting data in tabular format.
-
4)
The validity of the AI evaluation form was assessed using the index of item objective congruence (IOC) by consulting three experts in fields related to information technology, innovation, and communication arts prior to data collection. The IOC values ranged from 0.66 to 1.00, which meets the content validity criteria 58. The reliability of the assessment tool, it was tested by at least one psychologist. The expert conducted evaluation trials, and if the responses were consistent across all items, with answers aligned in the same direction and without challenges, the form was deemed reliable for use in the assessment.
3.4. Data Analysis
The researcher compiled a list of keywords and phrases frequently posted by individuals at risk of depression. These data were analyzed and synthesized through classification and organization using typology and taxonomy, along with inductive analytical methods. The analysis followed a predetermined observational framework to draw conclusions. The information provided to psychiatrists for expert assessment used a rating scale system—an interval scale widely employed in social science research—designed to develop questionnaires, interview formats, and attitude or characteristic measurement tools 59. The severity was rated as follows:
-
Low or no severity
-
Moderate severity
-
High severity
Score interpretation was based on threshold criteria by calculating the mean across all assessment sets, with scores ranging from 1 to 3. The mean scores were categorized into three levels using the criteria established in 60 and cited in 61:
-
Scores between 2.36 and 3.00 indicate high severity
-
Scores between 1.68 and 2.35 indicate moderate severity
-
Scores between 1.00 and 1.67 indicate low or no severity
Data from all 30 assessment sets were coded and processed using statistical analysis software. Descriptive statistics, including means and standard deviations, were calculated to summarize the data. Inferential statistics were employed to compare the differences between more than two variables using one-way ANOVA, while pairwise comparisons were conducted using the least significant difference (LSD) test. An analysis of the intraclass correlation coefficient (ICC) among expert raters yielded a value of 0.973, indicating excellent inter-rater reliability and high consistency among evaluators 62.
3.5. Data Collection
The system developers collected training data from Facebook, X, and Instagram, totaling 15,043 posts, using digital ethnographic observation. The data were filtered from Thai users who tagged #depression #depressive disorder in the Thai language through the TweePy tool and retrieved via user IDs. The obtained data consisted of user IDs, tweet content, and posting timestamps, categorized into negative, neutral, and positive words, referencing the Thai sentiment lexicon database from 34, which is an open-source resource for system developers. This list is presented in Table 3.
Table 3. Sample words or phrases expressing emotions.
| Positive words | Neutral words | Negative words |
|---|---|---|
| ขอบคุณ (Thank you) | นิ่ง (Calm) | ช่างเลวจริงๆ (Really terrible) |
| สู้เสมอ (Always try) | เสมอ (Constant) | ผลงานย่ำแย่จนใกล้ตกชั้น (Near relegation with poor performance) |
| โคตรสนุก (Super fun) | อ่อ (Oh) | ปวดหัวแท้ล้า (Headache, exhausted) |
| น่ารัก (Cute) | เงียบ (Quiet) | ขี้เกียจล้านตัว (Lazy as hell) |
| ขอบคุณทุกคน (Thank you everyone) | โอเค (Okay) | แย่ว่ะ (Awful) |
| รอยยิ้มในความทรงจำ (Smile in memory) | รับรู้(Perceive) | อำลานี้ไม่เจออีกน่ะ (Farewell, won’t see again) |
| ความทรงจำที่ดีเหลือเกิน (Very good memories) | จับ (Catch) | เวลาเหนื่อยนี่บ่นใครบ้าง (Who complains when tired?) |
4. Result
4.1. Results of Developing the Predictive Model for Words, Messages, or Images that Indicate Risk of Depression, Created Using Artificial Intelligence
Step 1: Preparing the Data for Analysis
The researcher compiled positive and negative texts into a single DataFrame using the Pandas library, consisting of 5,400 rows. The dataset was divided into 2,400 rows of positive tweets and 3,000 rows of negative tweets. The confidence values were encoded binarily: 0 indicated positive confidence and 1 indicated negative confidence, as illustrated in Fig. 3.
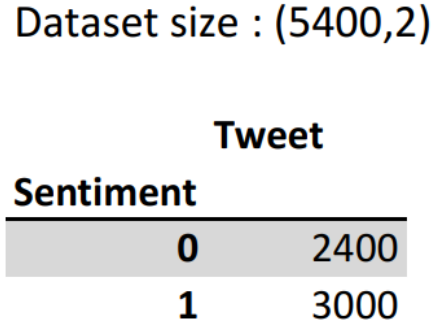
Fig. 3. Data frame of positive and negative texts.
The researcher retrieved data from X using user ID, ensuring that the collected data could not be linked to individual identities. Therefore, it was not necessary to obtain permission from the original tweet owners for data use to comply with the Personal Data Protection Act (PDPA) regulation. Tweets were selected without specific temporal restrictions, focusing solely on those containing the hashtags #โรคซึมเศร้า (#depression) and #ซึมเศร้า (#depress). Data were collected using the TweePy tool.
Step 2: Cleaning Data
This process involves removing all URLs from the dataset and eliminating excessive text elements such as punctuation, numbers, and special characters. The “retweet” part is also deleted to reduce processing time, as larger datasets require longer model training times. For example:
-
.*เราโดนคุณพ่อเราทำร้ายร่างกายค่ะ .*\r?\n (I was physically assaulted by my father.)
-
.*เราอยากดำเนินคดีกับคุณพ่อเพราะเราไม่ได้โดน.*\r?\n (I want to file a legal complaint against my father because I was not assaulted.)
-
ทำไมพอคนรอบข้างรู้ว่าเราเป็นซึมเศร้าทุกคนก็เริ่มเปลี่ยนไป ทำเหมือนกับว่าเราป่วย จริงๆเราก็แค่คนๆนึงที่เวลาเราเสียใจเราจะเสียใจมากกว่าคนอื ่นแค่นั้นเ อง เราแค่ต้องการให้คนรอบข้างปฏิบัติกับเราในแบบเดิม ไม่ใช่ Fade .*\r?\n (Why does everyone around us start to change once they learn that we are depressed? It’s as if we are ill. In fact, I am just a normal person who, when feeling sad, experiences deeper sorrow than others. I only want those around me to treat me the same as before, not to fade away.)
Approximately 40% of the originally collected data remained after cleaning. Next, create a test dataset by tagging each sentence as either “pos” or “neg” in the format [(sentence, pos or neg)]. Then, word segmentation was performed using the PyThaiNLP library version 4.1, employing the “pythainlp.tokenize.Tokenizer” class, for example: “ขอกำลังใจหน่อยได้ไหมครับทุกคน รู้สึกเหนื่อยเหลือเกิน” นำมาตัดคำจะได้ ‘ขอ’ ‘กำลังใจ’ ‘หน่อย’ ‘ได้’ ‘ไหม’ ‘ครับ’ ‘ทุกคน’ ‘รู้สึก’ ‘เหนื่อย’ ‘เหลือเกิน’.
The vocabulary data of the system will display the features as follows: [(‘โอ,’ ‘เค,’ ‘พวก,’ ‘เรา,’ ‘รัก,’ ‘ภาษา,’ ‘บ้าน,’ ‘เกิด,’ ‘pos’)].
All words were analyzed to determine their relationships with existing documents and converted them into numerical feature vectors based on word probability and frequency counts within a Bag-of-Words (BoW) model. All unique words in the dataset were used to create a dictionary, disregarding the order of the words. Each word is assigned a unique code, and each element in the vector represents the number of times the word appears in the text. For the “feature_set,” the data consists of word vectors, which are transformed into a format with a specified number of variables, as illustrated in Fig. 4.
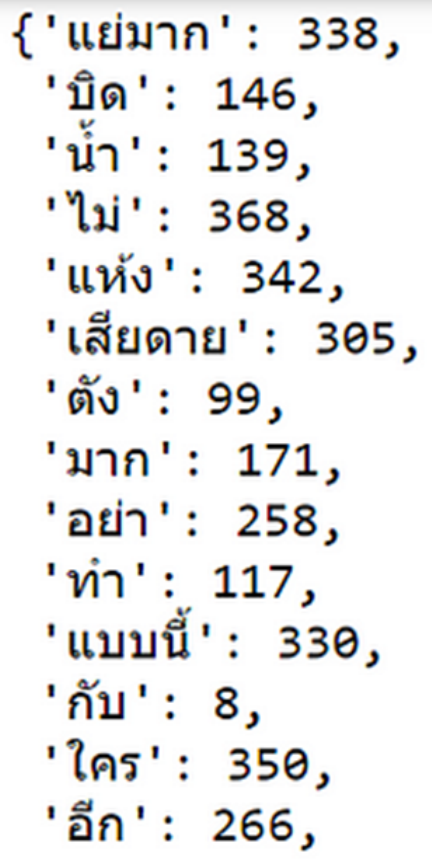
Fig. 4. Conversion of Thai words into numerical vectors.
A BoW is constructed as a table, in which each row represents a text sample, each column corresponds to a unique word in the vocabulary, and each cell contains the frequency of that word in the respective text. An example of this is shown in Fig. 5.
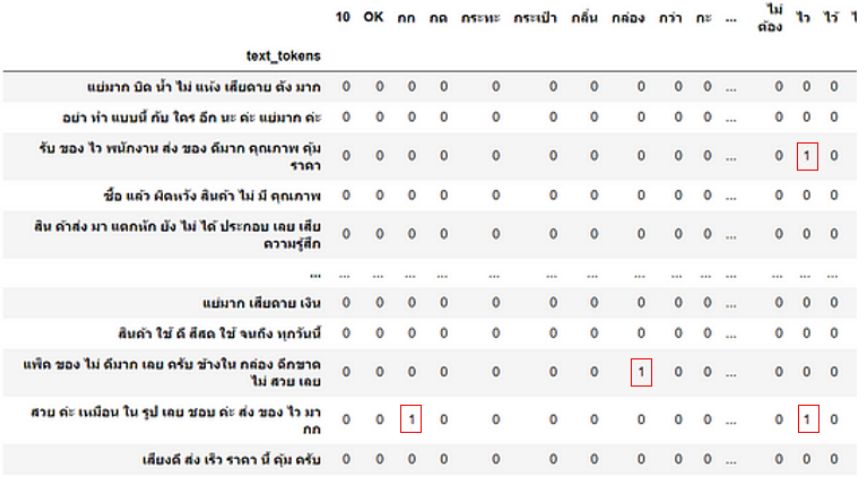
Fig. 5. BoW table showing word frequencies in the texts.
Step 3: Normalization of Data
This step involves processing vocabulary words, abbreviations, and misspelled words by converting them into their full forms to accurately capture their meanings. For example:
โรงบาล >> โรงพยาบาล (hospital)
อารม >> อารมณ์ (emotion)
เหนคนตาย >> เห็นคนตาย (seeing someone die)
หวัดดี >> สวัสดี (hello)
 >> หน้าเศร้า (sad face/unhappy appearance)
: >> ยิ้ม (smile)
 >> ยกมือไหว้ (respectful greeting)
??? >> สงสัย (uncertainty/doubt)
 >> น้ำตาหยดบนหน้า (teardrops on the face/crying)
Step 4: Building the Model
Using CountVectorizer from the scikit-learn library in Python, the text data were transformed into vectors based on the frequency (count) of each word across all texts. The parameters used in the CountVectorizer are as follows:
-
min_df: Excludes words whose document frequency is below a specified threshold during vocabulary creation.
-
max_features: If not specified, the vocabulary includes the top max_feature_words ranked by frequency in the dataset.
Subsequently, each model type was tested to identify the one that demonstrated the best prediction performance. The detailed results of these tests are listed in Table 4.
Based on the results in Table 4, the NB classifier demonstrates the highest performance. Therefore, the NB classifier was selected to predict words or messages that indicated the risk of depression among social media users.
Step 5: Model Performance Evaluation
The dataset is divided into training and test datasets. The data are processed using TF-IDF vectorization and then imported into the “MultinomialNB” module. A multinomial NB classifier object is created using the function “MultinomialNB().” Additionally, 10% of the entire dataset was set aside as a test set for evaluation. The results were as follows:
-
Positive tweets: 240 rows
-
Negative tweets: 300 rows
-
Neutral tweets: 0 rows
The “most informative features” were extracted from the model testing and analysis. These features are useful for predicting and classifying data, thereby enhancing our understanding of the learning models.
The three most frequently occurring words in the system were selected based on their highest probability of appearing in text data. For example:
“The ratio of positive (pos) to negative (neg) tweets was \(31.6:1.0\)."
This means that, when comparing the frequency of this word, the system predicts a cheerful (positive) sentiment in approximately 31.6 times more cases, whereas the system predicts depression (negative) in approximately 1 out of 31.6 cases.
““ขอให้” \(=\) True, \(\mathrm{pos:neg} =27.9:1.0\)"
This means that, based on the frequency ratio, the system encounters the word “ขอให้” in texts approximately 27.9 times more often in positive (cheerful) tweets than in negative (depressive) tweets. The system predicted positive sentiments (cheerfulness) in most cases, with a ratio of 27.9 to 1 compared to predicting depression (negative).
““คนเก่ง” \(=\) True, \(\mathrm{pos:neg} =21.7:1.0\)"
Table 4. Comparison of predictive performance.
| Types of models | Results of training the dataset | Results of testing the dataset |
|---|---|---|
| NB classifier | 88.17% | 85.00% |
| Bernoulli NB | 67.50% | 67.50% |
| Complement NB | 76.32% | 76.32% |
| Multinomial NB | 75.59% | 75.59% |
| KNN classifier | 62.35% | 62.35% |
| Decision tree classifier | 69.73% | 69.73% |
| Random forest classifier | 66.60% | 66.60% |
| Logistic regression | 72.20% | 72.20% |
| AdaBoost classifier | 69.26% | 69.26% |
Similarly, this indicates that the word “คนเก่ง” appears approximately 21.7 times more frequently in positive tweets than in negative ones. The system tended to classify texts containing this word as beautiful (positive) rather than depressive (negative). Based on these analyses, a confusion matrix was create, as shown in Fig. 6.
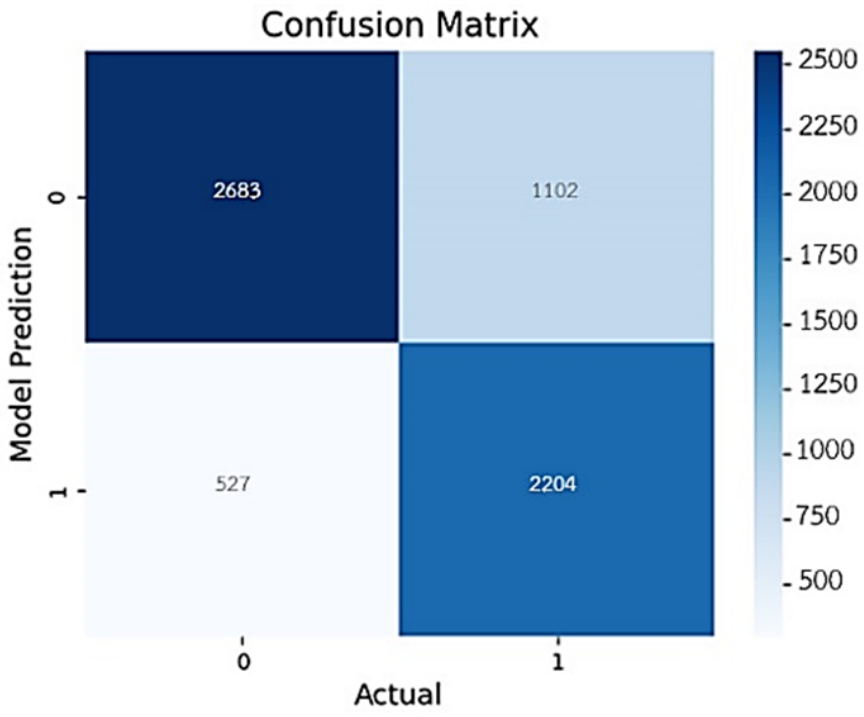
Fig. 6. Confusion matrix of the developed model.
The number of predictions made by the system was assessed by comparing the data with the confusion matrix of the developed model. These results can be used to evaluate the overall performance of the system across various metrics, as detailed in Table 5.
The results of the evaluation of the various performance metrics of the model developed by the researcher are summarized in Table 6.
Based on the results in Table 6, the accuracy of the training data for the model was 88.17%, whereas that of the test data was 75.00%.
An observation of the evaluation metrics reveals that, for the positive class (pos), precision is less than recall, whereas for the negative class (neg), precision exceeds recall. This indicates that the developed system demonstrates higher accuracy in predicting words or messages associated with depression in the negative class (neg) than in the positive class (pos). However, it is capable of covering more of the positive (pos) class, reflecting that the system is better at predicting words or messages that pose a risk for depression overall, especially because individuals at risk tend to post negative messages. The neg F1-measure was 76.70%.
Table 5. The number of data instances predicted by the model.
| Prediction neg | Prediction pos | |
|---|---|---|
| Actual neg | ⟨2683⟩ (TN) | ⟨1102⟩ (FP) |
| Actual pos | ⟨527⟩ (FN) | ⟨2204⟩ (TP) |
Table 6. Summary of model evaluation results.
| Test values | Evaluation results | Test values | Evaluation results |
|---|---|---|---|
| Accuracy with train data | 88.17% | ||
| Accuracy with test data | 75.00% | ||
| Positive class | Negative class | ||
| pos precision | 66.66% | neg precision | 83.58% |
| pos recall | 80.70% | neg recall | 70.88% |
| pos F1-measure | 73.01% | neg F1-measure | 76.70% |
Step 6: Deploy and Diagnose Depression
The model is deployed to predict and classify the emotional polarity of tweets over the past 14 days to determine datavariability and summarize whether the user exhibits symptoms consistent with depression, as illustrated in Figs. 7 and 8. The model was downloaded from https://github.com/aucifer16/AI-Depression-Prediction-Thai-NLP.
Fig. 7. The depression prediction model on GitHub.
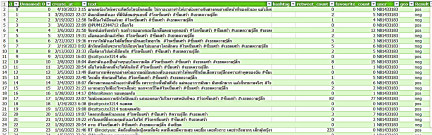
Fig. 8. System prediction results displayed in excel program.
When the system predicts that an individual is at risk for depression, it sends an alert to the user’s X account, as shown in Fig. 9.
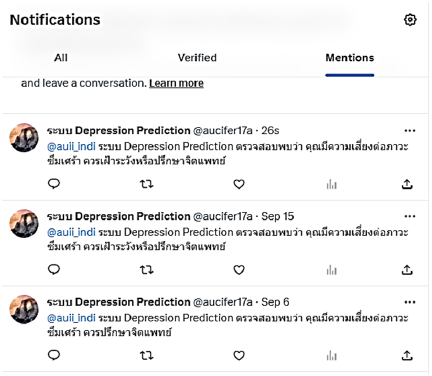
Fig. 9. Display of notification in X.
The researcher developed a web interface to present the data, facilitating easier understanding for general users without programming knowledge. The output pages are shown in Figs. 10 and 11.
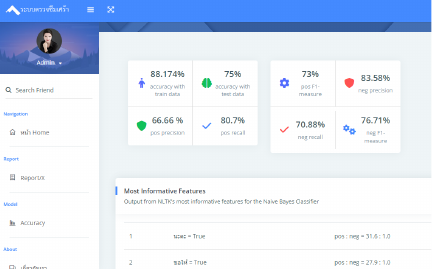
Fig. 10. System accuracy page.
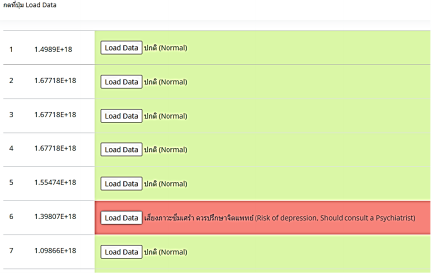
Fig. 11. User report page for individual ID results.
4.2. Evaluation Results of Prediction System’s Accuracy in Screening Individuals at Risk of Depression
The developed AI system was submitted to 30 experts for evaluation. The performance results are listed in Table 7.
Based on the data in Table 7, most experts rated the performance of the AI-developed media innovation model as high, with an overall mean score of 4.02, representing 80.40%. When comparing the four aspects, it was found that perceptions of security and privacy (security and privacy tests) received the highest rating, with a mean score of 4.11, or 82.20%. Conversely, the aspect with the lowest rating was the accuracy of prediction (precision test), which maintained a high level with a mean score of 3.95, or 79.00%.
5. Discussion
5.1. Results of Developing the Media Innovation Model
NLP and ML have demonstrated that the NB classifier is an effective algorithm for analyzing words or messages that reflect depressive states. The developed model can classify texts into positive (\(+1\)), neutral (0), and negative (\(-1\)) categories. The accuracy of the training dataset was 88.17%, while that of the test dataset was 85.00%. These findings indicate a high capacity for the efficient detection of negative messages. In addition, the F1-measure for negative (depressive) messages was 76.70%, confirming the effectiveness of the model in identifying such texts.
The development process of this model aligns with the research conducted by 64, which employed sentiment analysis to evaluate emotional intensities from texts, videos, and audio, categorizing severity into three levels: severe, moderate, and mild. Similar to the model developed in this study, such categorization helps improve prediction accuracy in identifying negative messages related to depression.
The data processing steps, including URL removal, surveillance management, and transforming words into vectors using the BoW and TF-IDF techniques, contribute to enhancing the accuracy of the model. These procedures are consistent with 40,65, which utilized data cleaning and transformation methods to effectively analyze depression-related texts. Moreover, reference 66 demonstrated that applying TF-IDF and vectorization significantly increases the effectiveness of the model in accurately predicting negative sentiments.
Compared to other models such as KNN, decision tree, random forest, logistic regression, and AdaBoost, the NB classifier demonstrated superior performance, especially in identifying negative data, which is a key characteristic of individuals with depression. However, reference 67 employed time-series forecasting methods to predict influenza outbreaks on Twitter using autoregressive integrated moving average (ARIMA) and Holt–Winters exponential smoothing (HWES) models. These findings indicate that ARIMA can rapidly detect influenza outbreaks in their early stages. Nevertheless, time-series models require a stationary time series, and the data utilized must exhibit stability. Furthermore, the aforementioned study employed tweet data spanning more than two years to ensure model robustness and reliability. This approach may be suitable for predicting chronic depression in patients with psychiatric disorders; however, researchers should allocate a longer period for data collection. This may not be appropriate for treating early stage depressive symptoms that require prompt intervention. A study by 68 further confirmed that NB is well-suited for classifying negative texts and performs effectively with small and less complex datasets.
These results indicate that the model can be practically applied, particularly on the X platform, where user messages often reflect emotional states. Early notifications seeking medical advice can help mitigate the impact of depression at an early stage.
However, the accuracy of the model in identifying positive messages remained low, primarily because the training data were skewed toward negative messages. This highlights the need to increase the volume of positive data during the training process to improve the overall model coverage. This analysis also opens opportunities for future development by utilizing more diverse and comprehensive data that capture all dimensions of users’ emotions and sentiments on social media platforms. An important consideration for real-world applications is the actual emotional states of individuals experiencing depression. In other words, there may be discrepancies between the messages expressed and an individual’s actual feelings. Some words may appear to indicate risk but are not truly risky, while others may seem neutral or harmless yet carry significant risk, especially ambiguous or neutral expressions. This poses a challenge for AI systems that may struggle to accurately interpret human emotions or nuanced language. A possible solution to improve the performance of such automated systems is to include a notification or clearly stated message to users, such as: “This system serves only as a preliminary screening tool, and the results generated by artificial intelligence may be subject to error. If users have concerns, they are advised to retake the depression risk assessment before deciding to seek professional medical treatment.” In practical applications, if such a predictive system is to be implemented, psychiatrists or mental health professionals should review the AI-generated results before delivering alert messages to individuals at risk of depression. This is to mitigate the possibility of misclassification or unintended risk due to AI hallucination—cases in which the system encounters messages or language patterns not included in the training data.
A comparable issue was identified in the study by 69, which reported that sentiment analysis using VADER and TextBlob was not well-suited for data in the Malay language. These limitations stem from the fact that most algorithms were trained primarily on English data, resulting in poor recognition of Malay language expressions. In addition, the size of the Malay language training dataset was insufficient. Therefore, the authors recommended experimenting with alternative or hybrid ML techniques and suggested that increasing the volume of training data, particularly for DL models, could significantly improve prediction accuracy.
Table 7. Mean and standard deviation of expert opinions on the performance of the AI media innovation model.
| Performance of the media innovation model | Level of opinion | |
|---|---|---|
| \(\boldsymbol{\bar{x}}\) | S.D. | |
| 1. Accuracy of the model for predicting words or images from social media developed using AI with NLP (accuracy test) | 4.01 (High) | 0.936 |
| 1.1 Accuracy in processing the Thai language of the model (e.g., the ability to interpret text and understand Thai language content from social media). | 4.03 (High) | 1.080 |
| 1.2 Accuracy in predicting positive text. | 4.19 (High) | 1.138 |
| 1.3 Accuracy in predicting negative text. | 4.00 (High) | 1.183 |
| 1.4 Accuracy in predicting neutral text. | 3.84 (High) | 1.003 |
| 1.5 Accuracy of the results (prediction outcomes) derived from the processing in the social media text prediction model. | 4.03 (High) | 1.048 |
| 1.6 Accuracy of the notification result delivery from the social media text prediction model. | 3.97 (High) | 1.080 |
| 2. The precision in predicting depression using the model for forecasting words or images from social media developed with AI through NL (precision test) | 3.95 (High) | 1.010 |
| 2.1 The forecasting model demonstrates accuracy in predicting words or images from social media that are not indicative of a risk for depression. | 3.74 (High) | 1.237 |
| 2.2 The forecasting model demonstrates accuracy in predicting words or images from social media that indicate a risk for depression. | 4.03 (High) | 1.224 |
| 2.3 Overall, the forecasting model for words or messages from social media demonstrates accuracy in predicting depression when compared to the test results from experts. | 4.00 (High) | 1.033 |
| 2.4 The accuracy of the reporting results from the forecasting model for words or images from social media can assist in screening individuals at risk of depression. | 4.06 (High) | 0.929 |
| 3. On the comprehensiveness and functionality of the developed words or images prediction model from social media using AI with NLP (functional and recall test) | 4.00 (High) | 0.879 |
| 3.1 The words or images prediction model from social media is easy to process. | 4.13 (High) | 0.846 |
| 3.2 The words or images prediction model from social media is fast in processing. | 4.23 (High) | 0.762 |
| 3.3 The words or images prediction model from social media is reliable in displaying the results. | 3.81 (High) | 1.302 |
| 3.4 The words or images prediction model from social media is suitable for assisting in the preliminary screening of depression risk for social media users. | 4.06 (High) | 1.181 |
| 3.5 The comprehensiveness of data access in the words or images prediction model from social media is appropriate for social media users (e.g., text collection and management, consideration of privacy and ethics, sending notification results to X, etc.). | 4.03 (High) | 0.948 |
| 3.6 The comprehensiveness of depression prediction in the developed words or images prediction model from social media compared to actual operational systems (e.g., preliminary text processing, analysis and result prediction, reporting results, etc.). | 3.77 (High) | 1.055 |
| 4. On security and privacy test | 4.11 (High) | 0.777 |
| 4.1 The retrieval of data through ID codes helps protect personal information and ensures the security of user confidentiality on social media. | 4.13 (High) | 0.991 |
| 4.2 The developed words or images prediction model from social media is secure against attacks (data hacking). | 4.03 (High) | 0.875 |
| 4.3 Sending notification results to X helps create a protective measure against the risk of social media users falling into depression. | 4.19 (High) | 0.792 |
| Overall | 4.02 (High) | 0.845 |
| The interpretation criteria [63] are as follows: 4.21–5.00: The highest level 3.41–4.20: High level 2.61–3.40: Moderate level 1.81–2.60: Low level 1.00–1.80: The lowest level |
||
5.2. Evaluation of Prediction Model’s Accuracy
Utilizing AI and NLP to analyze words, messages, or images from social media, revealed an average score of 4.01 (equivalent to 80.20%), indicating good performance. However, expert assessments from various fields have revealed different perspectives. Experts in information technology and computer science rated the model’s performance highest (mean score of 4.38), whereas experts in psychology and psychiatry assigned lower scores (mean score of 3.33). This discrepancy is attributed to the limitations of the model in predicting neutral messages, which yielded the lowest accuracy rate of 76.80%.
Identified issues include the model’s inaccuracy in detecting mildly negative emotional expressions, such as “สิ้นหวัง (hopeless)” or “หมดหวัง (despair),” which often result in high false negatives. This finding aligns with 65, which noted that the NB model has limitations in identifying subtle negative sentiments. Furthermore, the complexity of texts containing sarcasm, metaphors, or emojis complicates the prediction of neutral sentiments. This challenge is supported by 35, which emphasized that figurative language and symbolic emotional expressions on social media remain significant obstacles for AI-based models.
Nevertheless, the model demonstrated high accuracy in detecting explicit expressions, such as “อยากตาย (I want to die),” and correctly classified messages unrelated to depression, reflecting its capability when processing clearly defined inputs. However, to enhance the overall performance of the model, we recommend improving the handling of neutral expressions and expanding the keyword databases associated with depressive states. This recommendation is consistent with 68, which suggested that incorporating a more diverse dataset would help mitigate the limitations in recognizing emotionally complex messages.
6. Conclusion
This study found that the NB classifier is an effective algorithm for analyzing negative words or messages that reflect depressive symptoms, demonstrating better performance on negative data than other models. This is particularly relevant, given that negative expressions are a key characteristic of individuals experiencing depression. However, the accuracy of the model in classifying positive messages remains relatively low, primarily because of the imbalance in the training data, which consists largely of negative content. To improve the model’s performance, it is necessary to include more positive expressions, figurative language, emotional cues, and neutral terms in the training process. This recommendation aligns with the expert evaluations of the accuracy of the model, indicating that the model would benefit from the inclusion of a more diverse dataset. Such an enhancement would help address the limitations of detecting emotionally complex messages, particularly those involving sarcasm, metaphors, or the use of emojis.
Moreover, in practical applications, it is recommended that the system be used in conjunction with standardized depression-screening tools or clinical diagnostic data to ensure comprehensive and accurate results. To further enhance the efficiency of the AI system and reduce its limitations, financial support is essential for system development, as many AI platforms entail usage fees that may pose access barriers. Additionally, ethical concerns regarding access to personal data, such as those governed by the PDPA, remain unresolved, particularly on platforms with strong data protection protocols, such as Facebook and LINE.
Furthermore, limited access to medical data and collaboration with psychiatrists continue to pose challenges for researchers outside the public health sector. Therefore, it is imperative to involve psychiatrists or clinical psychologists as advisers or co-researchers at the beginning of the research process. Given the vulnerability of individuals with depression, such collaboration ensures that the resulting research aligns with the needs of psychiatric practice and increases the applicability and ethical integrity of the system in real-world mental health contexts.
- [1] P. Wongvachrapaiboon, “In 2024, 17.20% of Thai people are at risk of depression, and 15.48% experience high stress; highlighting the case of a “pharmacist” facing pressure,” 2024 (in Thai). https://www.hfocus.org/content/2024/11/32116 [Accessed May 20, 2025]
- [2] A. Nabi, M. A. Dar, M. A. Dar, and Z. Maqbool, “Depression Diagnosis with Artificial Intelligence: A Bibliometric Analysis,” J. for ReAttach Therapy and Developmental Diversities, Vol.6, No.7s, pp. 1063-1072, 2023. https://doi.org/10.53555/jrtdd.v6i7s.2791
- [3] K. U. Philips, “The Future of Feeling: Building Empathy in a Tech-Obsessed World,” Little A, 2021.
- [4] Y. Wongpiriyansant, “Build mindfulness, heal the mind, fight COVID-19,” Nanmeebooks, 2020.
- [5] Y.-H. Lin and L. Pai, “When depressy strikes, hold it tight,” Eurasian, 2017.
- [6] K. Khamkliang, “Feeling down? You can get through it,” Nation Books, 2020.
- [7] B. Yalamanchili, N. S. Kota, M. S. Abbaraju, V. S. S. Nadella, and S. V. Alluri, “Real-time Acoustic based Depression Detection using Machine Learning Techniques,” 2020 Int. Conf. on Emerging Trends in Information Technology and Engineering (ic-ETITE), 2020. https://doi.org/10.1109/ic-ETITE47903.2020.394
- [8] S. T. Sadasivuni and Y. Zhang, “A New Method for Discovering Daily Depression from Tweets to Monitor People’s Depression Status,” 2020 IEEE Int. Conf. on Humanized Computing and Communication with Artificial Intelligence (HCCAI), pp. 47-50, 2020. https://doi.org/10.1109/HCCAI49649.2020.00013
- [9] X. Chen, “Research on Depression Recognition Based on University Students’ Facial Expressions and Actions with the Assistance of Artificial Intelligence,” J. Adv. Comput. Intell. Intell. Inform., Vol.28, No.5, pp. 1126-1131, 2024. https://doi.org/10.20965/jaciii.2024.p1126
- [10] A. A. Jo, E. D. Raj, A. S. Vino, and P. K. Menon, “Exploring Explainable AI for Enhanced Depression Prediction in Mental Health,” 2024 First Int. Conf. on Innovations in Communications, Electrical and Computer Engineering (ICICEC), 2024. https://doi.org/10.1109/icicec62498.2024.10808414
- [11] N. R. Kanchapogu and S. N. Mohanty, “Enhancing Depression Predictive Models: A Comparative Study of Hybrid AI, Machine Learning and Deep Learning Techniques,” Research Square, 2024. https://doi.org/10.21203/rs.3.rs-3992742/v1
- [12] V. Nuipain, K. Plangklang, and S. Hanumas, “Depression risk prediction system using text mining techniques,” Proc. of the 20th National Conf. on Computing and Information Technology, pp. 42-47, 2024.
- [13] K. Fuangngam, N. Bhumpenpein, and S. Nuchitprasitchai, “A sentiment analysis model for double negative in Thai language,” Proc. of the 20th National Conf. on Computing and Information Technology, pp. 48-53, 2024.
- [14] P. Naphakorn, A. Bunteong, K. Sattratham, and K. Leknawa, “Development of a visual novel game prototype to enhance communication skills with individuals experiencing depression,” Proc. of the 21st National Conf. on Computing and Information Technology, 2025.
- [15] L. Mookdasanit, “Natural Language Processing,” Triple Group, 2022.
- [16] S. Rattanapojanart, “In 2024, 17.20% of Thai people are at risk of depression, and 15.48% experience high stress; highlighting the case of a “pharmacist” facing pressure,” 2024. https://www.hfocus.org/content/2024/11/32116 [Accessed May 20, 2025]
- [17] R. Kumar and D. Singh, “Effects of Social Media on Mental Health: A Review,” J. of Survey in Fisheries Sciences, Vol.10, Issue 1, pp. 3717-3721, 2023. https://doi.org/10.53555//sfs.v10i1.1658
- [18] B. Ridout and A. Campbell, “The Use of Social Networking Sites in Mental Health Interventions for Young People: Systematic Review,” J. of Medical Internet Research, Vol.20, No.12, Article No.12244, 2018. https://doi.org/10.2196/12244
- [19] P. Apakhajorn, “The reality of the online world: A truth that the government must pay attention to,” 2016 (in Thai). https://www.isranews.org/isranews/49987-a_49987.html [Accessed February 11, 2021]
- [20] O. Ulvi, A. Karamehic-Muratovic, M. Baghbanzadeh, A. Bashir, J. Smith, and U. Haque, “Social Media Use and Mental Health: A Global Analysis,” Epidemiologia, Vol.3, Issue 1, pp. 11-25, 2022. https://doi.org/10.3390/epidemiologia3010002
- [21] T. Ikbal, “A Comprehensive Evaluation of the Impact of Social Media on Mental Health Reveals Noteworthy Effects,” Praxis Int. J. of Social Science and Literature, Vol.6, Issue 8, pp. 64-72, 2023. https://doi.org/10.51879/pijssl/060807
- [22] A. Aldkheel and L. Zhou, “Depression Detection on Social Media: A Classification Framework and Research Challenges and Opportunities,” J. of Healthcare Informatics Research, Vol.8, pp. 88-120, 2024. https://doi.org/10.1007/s41666-023-00152-3
- [23] SAS Software, “Natural Language Processing: Definition and Importance,” 2021 (in Thai). https://www.sas.com/th_th/insights/analytics/what-is-natural-language-processing-nlp.html [Accessed November 16, 2021]
- [24] Y. Zhou, “Depression Prediction Model Based on NLP,” Applied and Computational Engineering, Vol.109, No.1, pp. 109-112, 2024. https://doi.org/10.54254/2755-2721/109/20241284
- [25] P. Nakwijit, “Understanding transformer [Part III],” 2020 (in Thai). https://medium.com/@chameleontk/-transformer-part-iii-2f36fb256f0c [Accessed September 10, 2024]
- [26] Quora, “Which are the weaknesses of transformers in deep learning?,” 2024. https://www.quora.com/Which-are-the-weaknesses-of-transformers-in-deep-learning [Accessed September 10, 2024]
- [27] A. Vaswani et al., “Attention is all you need,” Proc. of the 31st Int. Conf. on Neural Information Processing Systems (NIPS’17), pp. 6000-6010, 2017.
- [28] J. Zhang et al., “Data augmentation for transformer-based neural networks in speech translation,” IEEE Int. Conf. on Acoustics, Speech and Signal Processing (ICASSP), pp. 6309-6331, 2020.
- [29] J. Ardharn, “Text-based depression detection on social media using deep learning,” A Master’s Project for Master of Science, Faculty of Science, Srinakharinwirot University, 2023.
- [30] D. Duernrubroem, C. Charoenphol, and J. Jiranukul, “A comparison of data mining structure efficiency for classifying depression from Twitter posting behavior,” Mahasarakham University J. of Science and Technology, Vol.39, No.3, pp. 331-343, 2016.
- [31] I. C. Obagbuwa, S. Danster, and O. C. Chibaya, “Supervised machine learning models for depression sentiment analysis,” Frontiers in Artificial Intelligence, Vol.6, 2023. https://doi.org/10.3389/frai.2023.1230649
- [32] L. P. Hung and S. Alias, “Beyond Sentiment Analysis: A Review of Recent Trends in Text Based Sentiment Analysis and Emotion Detection,” J. Adv. Comput. Intell. Intell. Inform., Vol.27, No.1, pp. 84-95, 2023. https://doi.org/10.20965/jaciii.2023.p0084
- [33] N. V. Babu and E. G. M. Kanaga, “Sentiment Analysis in Social Media Data for Depression Detection Using Artificial Intelligence: A Review,” SN Computer Science, Vol.3, Article No.74, 2022. https://doi.org/10.1007/s42979-021-00958-1
- [34] W. Phatthiyaphaibun, “Thai Sentiment Text,” 2017. https://github.com/pythainlp/lexicon-thai/tree/master/ข้อความ [Accessed March 1, 2022]
- [35] S. R. Kamite and V. B. Kamble, “Detection of Depression in Social Media via Twitter Using Machine learning Approach,” 2020 Int. Conf. on Smart Innovations in Design, Environment, Management, Planning and Computing (ICSIDEMPC), pp. 122-125, 2020. https://doi.org/10.1109/ICSIDEMPC49020.2020.9299641
- [36] J. Jingjit and V. Asawaranun, “Learning data science principles with Python (1st ed.),” Core Function, 2020.
- [37] B. Pasilatetsang, “Creating learning for AI with Python machine learning,” SE-ED Education, 2021.
- [38] N. Charoenkiattiboon, “Using data mining techniques to assist in academic advising for higher education,” Master’s thesis of Computer Sciences, Silpakorn University, 2007.
- [39] T. Wannaprapha, “Using data mining techniques for screening people successfully in undergraduate studies of educational technology,” Master’s thesis of Engineering, College of Innovation Technology and Engineering, Dhurakij Pundit University, 2021.
- [40] M. Keerthiga et al., “Machine Learning-based Depression Prediction using Social Media Feeds,” 2023 Int. Conf. on Inventive Computation Technologies (ICICT), pp. 863-869, 2023. https://doi.org/10.1109/ICICT57646.2023.10134427
- [41] Y. He, L. Ji, R. Qian, and W. Gu, “A Text-Based Suicide Detection Model Using Hybrid Prompt Tuning in Few-Shot Scenarios,” J. Adv. Comput. Intell. Intell. Inform., Vol.29, No.3, pp. 649-658, 2025. https://doi.org/10.20965/jaciii.2025.p0649
- [42] M. Hämäläinen, P. Patpong, K. Alnajjar, N. Partanen, and J. Rueter, “Detecting Depression in Thai Blog Posts: A Dataset and a Baseline,” Proc. of the 7th Workshop on Noisy User-generated Text (W-NUT 2021), pp. 20-25, 2021. https://doi.org/10.18653/v1/2021.wnut-1.3
- [43] S. Mahasiriakalayot, T. Senivongse, and N. Taephant, “Predicting Signs of Depression from Twitter Messages,” 2022 19th Int. Joint Conf. on Computer Science and Software Engineering (JCSSE), 2022. https://doi.org/10.1109/JCSSE54890.2022.9836287
- [44] S. Fara, O. Hickey, A. L. Georgescu, S. Goria, E. Molimpakis, and N. Cummins, “Bayesian networks for the robust and unbiased prediction of depression and its symptoms utilizing speech and multimodal data,” 2022.
- [45] B. Ojeme and A. Mbogho, “Predictive Strength of Bayesian Networks for Diagnosis of Depressive Disorders,” I. Czarnowski et al. (Eds.), “Intelligent Decision Technologies 2016,” Smart Innovation, Systems and Technologies (SIST), Vol.56, pp. 373-382, Springer, 2016. https://doi.org/10.1007/978-3-319-39630-9_31
- [46] M. F. Guiñazú, M. González, R. B. Ruiz, V. Hernández, S. B. Diez, and J. D. Velásquez, “A novel depression risk prediction model based on data fusion from Chilean National Health Surveys to diagnose risk depression among patients with mood disorders,” Information Fusion, Vol.100, Article No.101960, 2023. https://doi.org/10.1016/j.inffus.2023.101960
- [47] V. A. S. Putri, A. V. Vitianingsih, R. Hamidan, A. L. Maukar, and N. T. Pratitis, “Sentiment Analysis on Social Media Instagram of Depression Issues Using Naïve Bayes Method,” J. Inovtek Polbeng Seri Informatika, Vol.9, No.2, pp. 802-813, 2024. https://doi.org/10.35314/spchsk42
- [48] P. Panluck and P. Boonrawd, “Sentiment analysis for monkeypox outbreak using BERT model,” Proc. of the 20th National Conf. on Computing and Information Technology, pp. 78-83, 2024.
- [49] C. Wongsin, N. Srikarnjanaperd, and J. Polpinij, “Automatic feeling analysis from opinion text,” Proc. of the 11th National Conf. on Computing and Information Technology, 2015.
- [50] W. Thurachon, W. Sumethawatthanaphong, and N. Songsook, “Classification system para rubber varieties using Naïve Bayes,” Proc. of the 10th National Conf. on Computing and Information Technology, 2014.
- [51] Facebook1, “Depression,” 2022. https://www.facebook.com/search/pages?q=ซึมเศร้า [Accessed February 15, 2022]
- [52] Facebook2, “Depression,” 2022. https://www.facebook.com/search/groups?q=ซึมเศร้า [Accessed February 15, 2022]
- [53] Instagram, “#Depression,” 2022. https://www.instagram.com/explore/tags/โรคซึมเศร้า/ [Accessed February 15, 2022]
- [54] M. Q. Patton, “How to Use Qualitative Methods in Evaluation,” Sage Publications, 1987.
- [55] C. Photisita, “The art and science of qualitative research (4th ed.),” Institute for Population and Social Research, Mahidol University, 2009.
- [56] MedPark Hospital, “Depression Test,” 2025 (in Thai). https://www.medparkhospital.com/disease-and-treatment/depression-tests [Accessed May 20, 2025]
- [57] Department of Mental Health, Ministry of Public Health, “Guidelines for provincial monitoring and surveillance of depression (3rd Revised Edition, 2014),” 2014. https://vjlh.go.th/booking/upload_file2/2450661385f86a43f9e92d.pdf [Accessed May 20, 2025]
- [58] P. Pasunon, “Validity of questionnaire for social science research,” J. of Social Sciences Srinakarinwirot University, Vol.18, pp. 375-396, 2015.
- [59] S. Piboon, “Development of rating scale tools in research,” 2009 (in Thai). https://www.gotoknow.org/posts/238980 [Accessed December 28, 2021]
- [60] J. W. Best, “Research in Education (3rd ed.),” Prentice-Hall, Inc., 1977.
- [61] P. Sirisuwan, “The effect of health promotion program for preventing new diabetes cases in Singhok Subdistrict, Kaset Wisai District, Roi Et Province,” Boromarajonani College of Nursing Surin, Vol.8, No.1, pp. 45-58, 2018.
- [62] T. K. Koo and M. Y. Li, “A Guideline of Selecting and Reporting Intraclass Correlation Coefficients for Reliability Research,” J. of Chiropractic Medicine, Vol.15, Issue 2, pp. 155-163, 2016. https://doi.org/10.1016/j.jcm.2016.02.012
- [63] J. M. Fisher, “First grader’s perception of their learning: A qualitative study of motivation for literacy,” Dissertation Abstract International, Vol.59, No.6, Article No.1903-A, 1998.
- [64] S. Jalukar, A. Ratnaparkhi, P. Shinde, S. Kunkulol, and V. Kulkarni, “Sentiment Analysis for Depression Detection,” Int. J. of Trendy Research in Engineering and Technology, Vol.6, Issue 3, pp. 17-22, 2022. https://doi.org/10.54473/IJTRET.2022.6305
- [65] M. Deshpande and V. Rao, “Depression detection using emotion artificial intelligence,” 2017 Int. Conf. on Intelligent Sustainable Systems (ICISS), pp. 858-862, 2017. https://doi.org/10.1109/ISS1.2017.8389299
- [66] P. M. Jadhav, Sonia, and A. N. Kulkarni, “Depression Predicting Model For Social Media User’s Emotions Using Deep Learning Methods,” Mathematics and Applied Sciences, Vol.44, No.S8, pp. 194-201, 2023. https://doi.org/10.53555/jaz.v44iS8.3538
- [67] G. Zhu, L. Li, Y. Zheng, X. Zhang, and H. Zou, “Forecasting Influenza Based on Autoregressive Moving Average and Holt-Winters Exponential Smoothing Models,” J. Adv. Comput. Intell. Intell. Inform., Vol.25, No.1, pp. 138-144, 2021. https://doi.org/10.20965/jaciii.2021.p0138
- [68] M. Usman, S. Haris, and A. C. M. Fong, “Prediction of Depression Using Machine Learning Techniques: A Review of Existing Literature,” 2020 IEEE 2nd Int. Workshop on System Biology and Biomedical Systems (SBBS), 2020. https://doi.org/10.1109/SBBS50483.2020.9314940
- [69] I. N. Joharee, N. N. W. N. Hashim, and N. S. M. Shah, “Sentiment Analysis and Text Classification for Depression Detection,” J. of Integrated and Advanced Engineering, Vol.3, No.1, pp. 65-78, 2023. https://doi.org/10.51662/jiae.v3i1.86
This article is published under a Creative Commons Attribution-NoDerivatives 4.0 Internationa License.