Research Paper:
Vanilla-YOLO: A Lightweight Algorithm for Breast Cancer Detection
Shu-Hua Li*,†, Mary Jane C. Samonte*, and Feng-Long Yan**
*School of Graduate Studies, Mapua University
658 Muralla Street, Intramuros, Manila 1002, Philippines
†Corresponding author
**School of Computer and Software, Dalian Neusoft University of Information
8 Software Park Road, Dalian 116023, China

As a receptor of breast cancer prognosis and treatment, human epidermal growth factor receptor 2 (HER-2) is closely associated with breast cancer occurrence and progression. Breast cancer lesions are characterized by irregular shapes, small lesion targets, and possible multi-target lesions with overlapping boundaries. Existing algorithms have partly improved the detection accuracy of breast cancer detection model. However, it still suffers from the issues of insufficient detection accuracy and slow detection speed of small and multi-target lesions and requires a huge mass of sample data for iteration during model training, which is demanding on datasets. To address this problem, an improved model is proposed in this paper based on YOLOv10. The model introduces VanillaNet, a lightweight backbone network that can significantly improve detection accuracy by reducing the network depth of the model to equalize detection speed and performance. In addition, the RefConv module is embedded into the C2f structure to further reduce channel redundancy and smooth out lossy situations. In the feature fusion network part, the introduction of a lightweight up-sampling operator content-aware feature reorganization CARAFE module enhances the quality and richness of output features, which effectively improves detection accuracy and speed. The accuracy of the improved model is 98.8%. Thus, the improved model is a significant advantage over mainstream models such as traditional faster region-based convolutional neural network (RCNN), YOLOv5, YOLOv7, YOLOv8, YOLOv10, and YOLOv12.
Improved YOLOv10 for breast cancer detection
1. Introduction
Breast cancer has become the most common cancer with high incidence and mortality rates worldwide 1. The traditional grading detection of breast cancer mainly relies on manual experience. This is time-consuming, laborsome, and susceptible to subjective factors, which causes unstable and inaccurate results. Some benign lesions are overassessed and invasively treated, while some malignant ones are underestimated and miss the optimal treatment time. Therefore, accurately detecting benign and malignant breast lesions is crucial for accurate diagnosis and follow-up treatment.
In the detection of breast cancer grading, human epidermal growth factor receptor 2 (HER-2) is a type of receptor that is strongly linked to the development and progression of breast cancer and serves as an important indicator of breast cancer prognosis and treatment 2. HER-2 classification testing is divided into four main categories: negative HER-2 (0), weakly positive HER-2 (\(1+\)), positive HER-2 (\(2+\)), and strongly positive HER-2 (\(3+\)). HER-2 breast cancer imaging for the assessment of classification mainly includes X-ray, ultrasound, and magnetic resonance imaging (MRI). Among them, MRI is one of the prominent non-invasive imaging techniques that breaks the traditional monomorphic diagnostic model by allowing for the quantitative and qualitative analysis of lesions. Fig. 1 shows an example of an MRI image of a breast cancer lesion. The position marked by the red ellipse in the first row is the lesion area. And MRI images in the second row show magnified detail of the lesions from the corresponding images in the first row. From which it can be observed that the small target is low-resolution and poorly characterized in the MRI image. The irregular shape of the lesion and the possible presence of multi-targeted lesions may result in failure to accurately identify them. In addition, there are many complicated scenes such as several confounding factors coexist, scars, architectural distortion, skin thickening, and implanting or foreign bodies that create artifacts and obscure posterior tissue. These complicated scenes make lesion detection and classification unusually difficult. Thus, MRI lesion detection in breast cancer remains a challenge, especially in small and multi-target lesions in complicated scenes.
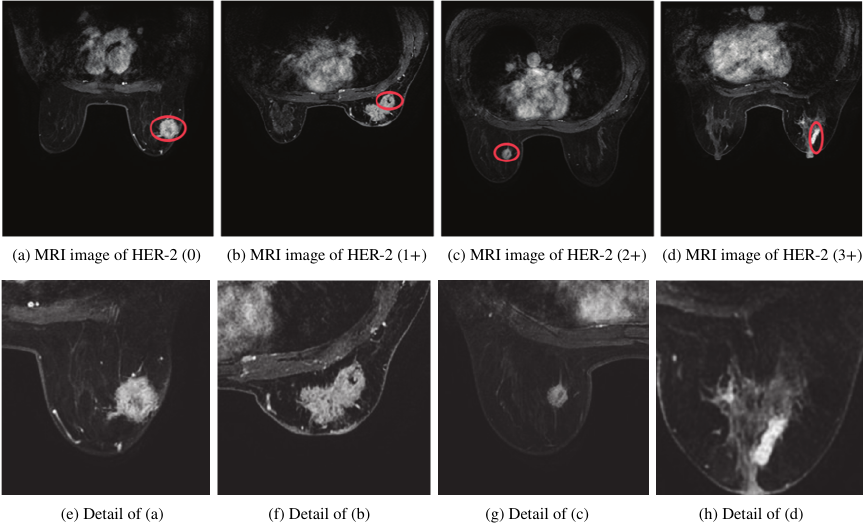
Fig. 1. Examples of lesions labelled in red color.
In the past few years, researchers have found that the design of deep convolutional neural networks can greatly improve the performance of image classification and target detection 3. Currently, deep learning networks for target detection are primarily categorized into one and two-stage detection models. Two-stage detection models generate a series of candidate regions first and then perform accurate classification. Such algorithms mainly encompass Faster region-based convolutional neural networks (R-CNN) and its improved algorithm 4,5. However, two-stage algorithms are inadequate for the detection of real-time scenes. During surgery it guides immediate excision decisions. Delays of even seconds can translate into missed lesions, repeated operations, or prolonged patient anxiety, making rapid model output an essential component of breast cancer detection. One-stage detection models can be predicted directly from original images. With better real-time prediction, one-stage detection models are more classic YOLO series algorithms such as YOLOv8, YOLOv10, and YOLOv13 [6–9].
Small and multi-target lesions have limited visual information, making it hard to extract discriminative features, which in turn makes it difficult for detection models to accurately locate and identify small targets. Sun et al. improved the accuracy of cancer classification using a computer algorithm based on 248 images obtained from a 3.0-T MRI scanner, achieving an algorithmic accuracy of 81.5% and a specificity (SP) of 94.7% 10. Rajeena P.P and Tehsin deployed a 32-layer CNN model for breast cancer imaging. Adopting dataset normalization with cropping algorithms, and data balance with rotation, flipping, and noise addition improve classification accuracy 11. Epimack et al. used the MIAS dataset with 207 images of benign tumors and 115 images of abnormal malignant tumors. The proposed algorithm employed a limited dataset and achieved the best results compared with previous work 12. Yang et al. detected the ultrasound images of breast tumors in an improved YOLO network. The algorithm used 659 breast tumor images as the initial dataset. The improved YOLO algorithm achieved an average accuracy of 80.5% 13. Alaa and Aly studied the integration of ALL-IDB1 and ALL image datasets. By integrating multiple datasets, the model was more generalizable in different samples. The deep learning model has high accuracy and reliability in detection, with an accuracy of 98% in YOLOv8s 14.
Among current mainstream models, YOLOv10 15 is the algorithm with higher accuracy and detection speed in target detection. It chooses YOLOv8 16 as the baseline model, which strikes a good balance between latency and accuracy. Additionally, YOLOv10 includes a lightweight classification header, spatial-channel decoupled down-sampling, ranked bootstrap-based block design, large kernel convolution, partially self-attentive modules, etc. Multi-scale feature fusion and dynamic anchor generation techniques are applied to continuously improve the performance of the model. The model has an average accuracy of 50% on large-scale datasets, and the frame rate per second reaches 60 frames per second (fps). Therefore, the model can realize fast detection while maintaining high accuracy.
To address the challenges of low detection accuracy and slow processing speed for small, multi-target lesions in complex scenarios, this paper proposes an enhanced model based on YOLOv10. The model introduces the VanillaNet backbone network 17, which reduces the network depth of the model to equalize detection speed and detection performance. Besides, the RefConv module is embedded into the C2f structure in the Neck section to further reduce channel redundancy and smooth out lossy situations. In the feature fusion network part, the introduction of a lightweight up-sampling operator content-aware feature reorganization CARAFE module improves the quality and richness of output features. Finally, Grad-CAM 18 was used to analyze the model recognition results. The model proposed in this paper can accurately capture various image features. Grad-CAM activation map can accurately locate a variety of targets, which improves the detection accuracy and speed of multiple targets in lesion images.
2. Methodology
Before training in YOLOv10, the images were preprocessed mainly to improve image clarity, enhance tumor features, and standardize images from different data sources in complicated scenes. The optimization formula is as follows.
In Eq. \(\eqref{eq:1}\), the gray level of a grayscale image can be viewed as a random variable in the interval \([0,L-1]\). Hence, it can be described by its probability density function (PDF), and the PDF of the output image grayscale \(s\) is obtained from the PDF of the input image grayscale \(r\) and the transformation \(T\).
In the equation, \(M \ast N\) represents the total number of image pixels; \({n}_{{k}}\) stands for the number of pixels with gray scale \({r}_{{k}}\); \(L\) denotes the number of possible gray levels of the image. It can be seen from Eq. \(\eqref{eq:2}\) that the gray value of the pixel in the output image can be obtained by mapping the pixel gray level \({r}_{{k}}\) in the input image to \({s}_{{k}}\).
In this model, the contrast is increased by widening the gray values of the image, and the histogram is normalized for subsequent processing to make the image clear for enhancement purposes. A comparison of the histogram of gray values before and after image enhancement is shown in Fig. 2. The horizontal axis is intensity value [px], and the vertical axis is pixel density number. The left side of figure shows the original image that concentrated at the lower end of the grayscale values, where this is not conducive to further analysis and processing. The right side of this figure shows the image obtained by histogram equalization. The equalized data have a wider dynamic range of gray values and stronger contrast. The enhanced image has richer details.
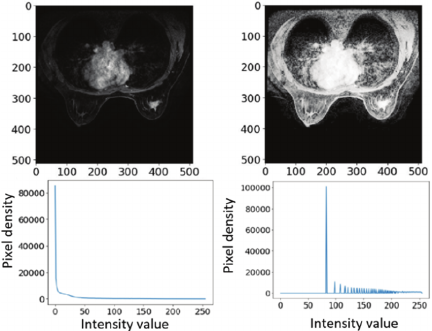
Fig. 2. Normalization of histograms for subsequent processing.
YOLOv10 boasts high recognition accuracy and fast recognition speed, with higher accuracy and speed in target detection. As shown in Fig. 3, it is original model structure that shows the information flow and core ideas 19. It contains multi-layer Conv, C2f, and SCDown modules, which optimize the learning efficiency and feature recognition ability of the network. Nevertheless, the convolution operation of multiple layers with different scales produces a large number of redundant feature maps, which may have some impact on the detection speed of the model 20.
To solve the issues of insufficient detection accuracy and slow detection speed of small and multi-target lesions in complex scenes, an improved model was put forward in this paper on the basis of YOLOv10.
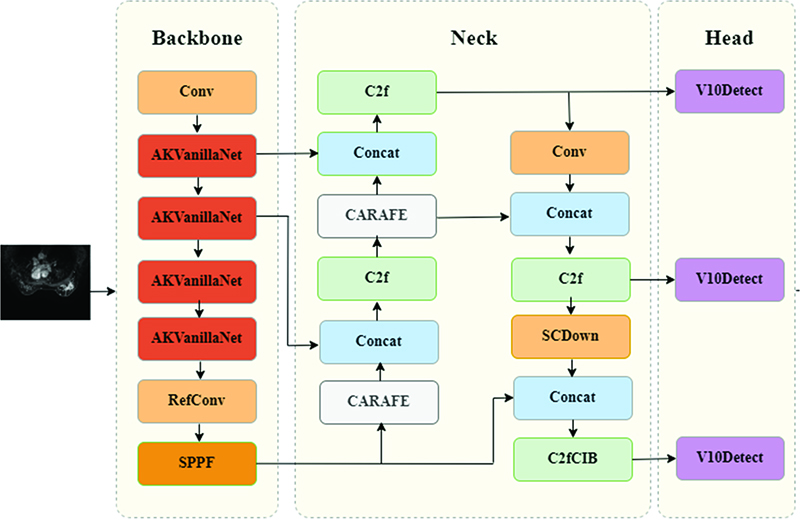
As shown in Fig. 4, the model introduces a new VanillaNet network in the backbone part, which reduces the network depth of the model to equalize detection speed and detection performance. Moreover, the RefConv module 21 is embedded into the C2f structure in the Neck part to further reduce channel redundancy and smooth out lossy situations. In the feature fusion network part, a lightweight up-sampling operator content-aware feature reorganization CARAFE module is introduced. CARAFE can adaptively select the optimal up-sampling strategy based on the local content of the image. This adaptability can greatly reduce blurring or artifacts and preserve more details, which significantly improves the quality and richness of output features, which effectively improves detection accuracy and speed.
To visualize the model results, model decisions were visualized. The model recognition results were analyzed by generating heat maps through the Grad-CAM network, which highlighted the regions in the input image that exert the greatest impact on the model prediction results. The proposed model can accurately capture various image features. The Grad-CAM activation map can accurately localize multiple targets, which improves the detection accuracy and speed of various targets in lesion images.
Fig. 3. Original model structure in YOLOv10.

Fig. 4. Improved YOLOv10 model structure.
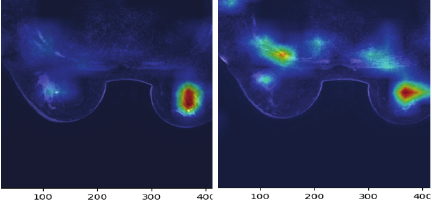
Fig. 5. Grad-CAM localization results.
The Grad-CAM localization results of breast cancer lesions are shown in Fig. 5. In our research, Grad-CAM was deployed in the end of backbone network and within the deep layers of Neck network. The result of test shows that Grad-CAM in deep layer of the Neck network performs well in YOLOv10, which can achieve the best balance between category discriminability and localization accuracy. As can be seen from the figure, the proposed model can accurately capture various image features, and the activation map intensity of its target location is significantly higher than that of other regions. The above phenomenon indicates that the model has the capacity to accurately capture various image features and localize various targets using Grad-CAM activation maps.
3. Experiments
3.1. Dataset Description and Experimental Setting
This retrospective study recruited nonspecific invasive cancer patients. The study has obtained ethical approval (Approval No. CBS-ZXYY-2025022801) and complies with all applicable regulations. Images were obtained with a 3.0-T magnetic resonance imaging scanner. A special coil was used to scan the breast. Patients were in the prone position with the head tilted forward and the double breasts naturally suspended in the coil. T1WI, T2WI, DWI, and 3D volume images of the breast (3D VIBRANT) were performed. The 3D VIBRANT scan parameters are as follows: TR 7.6 ms, TE 3.8 ms, layer thickness 1.2 mm, FOV 320 mm \(\times\) 320 mm, flip angle 15°, matrix \(288\times 288\). The contrast agent was injected into the antecubital vein through a high-pressure injector.
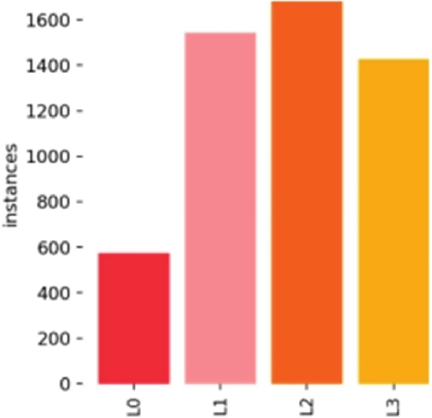
Fig. 6. Distribution of breast cancer instances.
The collected images are stored on the Darwin platform, a well-known medical data and artificial intelligence platform. To ensure consistency, the images were labelled by professional medical staff. And then we convert the medical irregular labeling to the maximum outer rectangle labeling for modeling. The image annotation is done using the annotation tool LabelImg. A grading system (L0 to L3) was applied to the breast cancer lesions in the images, based on HER-2 status: L0 for benign HER-2 negative (0), L1 for weakly positive (\(1+\)), L2 for positive (\(2+\)), and L3 for strongly positive (\(3+\)). 138 patient data were tracked and organized. And multiple images for each patient totals 5177 instances. As shown in Fig. 6, the number of suspected abnormal instances of breast cancer in this study was 573, 1,532, 1,657, and 1,415, respectively.
In order to ensure the data consistent and improve the model performance, we repeated the entire patient-wise randomization. During preprocessing, every slice was resized for data argument to increase intra-patient variability without duplicating subjects. Finally, we performed 5-fold stratified cross validation inside the training set for hyper-parameter tuning, ensuring that each fold still respected patient boundaries.
A plot of the size-density distribution of suspected anomalous instances is presented in Fig. 7, where the \(x\)- and \(y\)-axes represent information on the width and height of lesions respectively. Lesion sizes are distributed over a range of lengths from 0–100 px, with a majority of anomalous instances measuring less than 32 px. That means our experimental data is mainly composed of small lesions. In this plot, the number of intervals used for kernel density estimation is set to 10. The data in the right color swatch show that the highest target density is found in the range of 0–32 px.
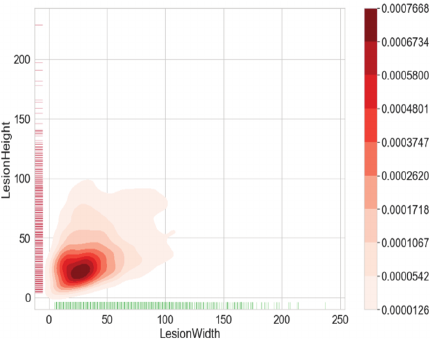
Fig. 7. Diagram of the distribution density of lesion sizes.
3.2. Experimental Process
The experimental platform is Ubuntu14.0, and the graphic processing unit is NVIDIA TeslaV100. The data set was classified into training, validation, and test sets in the ratio of \(8:1:1\). We add data augmentation and modify loss function to solve the problem of uneven distribution. Data augmentation performs rotation, scaling, and other operations on minority categories to amplify samples, and remove features that have a significant impact on the distribution. The evaluation method of mAP was adopted during the experiment, and the maximum number of iterations of the model was set as 100,000. The dynamic learning rate was used in this paper. The initial learning rate was 0.0001, and the learning rate was reduced to 10% of the original learning rate when training rounds were 75,000 and 90,000 rounds. Due to the limitation of system performance, a larger batch size was not used in this experiment, but a smaller bit size was set as 24. The randomized arrangement of datasets was used in each iteration (epoch). Adjusting the training strategy and schedule as well as the learning rate can improve stability and results.
The deep learning algorithm in this experimental medical lesion diagnosis mainly accomplished lesion recognition. The main evaluation criteria for lesion recognition include: Eq. \(\eqref{eq:3}\) (accuracy) and Eq. \(\eqref{eq:4}\) (precision). In the formulas, TP represents the input that the model thinks as a positive sample and is actually a positive sample; FP stands for the input that the model thinks as a positive sample but is actually a negative sample; FN denotes the input that the model thinks as a negative sample but is actually a positive sample.
Table 1. Ablation experiment results of YOLOv10.

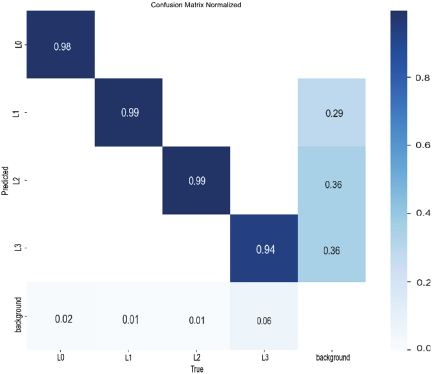
Fig. 8. Confusion matrix results in the proposed model.
The evaluation metrics used in this experiment were the accuracy of detection \(p\) [%], the weight of model, and the fps of images.
The results show that different modules have an impact on lesion detection, especially in improving the accuracy of cancer image classification. As illustrated in Table 1, the model detection rates are all above 91%. In terms of detection time, the frame rate per second satisfies the need for real-time detection.
The final model also introduces the VanillaNet network, RefConv, and CARAFE modules. Its accuracy reaches 98.8%, which is 5.2% higher than that of the benchmark model. The weights are reduced by 0.5 MB. Thus, the proposed detection model improves detection accuracy compared to the benchmark model and reduces the complexity of the model. The confusion matrix plot of the proposed model is demonstrated in Fig. 8. As seen from the confusion matrix, the model with the introduction of VanillaNet, RefConv, and CARAFE modules is tested better.
F1–confidence curve shows the score of the model at different confidence thresholds, which is a method of the model’s comprehensive consideration of accuracy and recall.
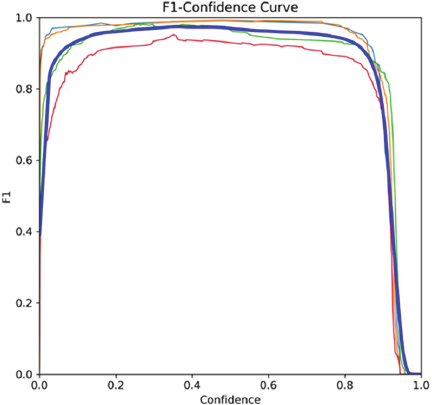
Fig. 9. F1–confidence curve in breast cancer diagnosis.
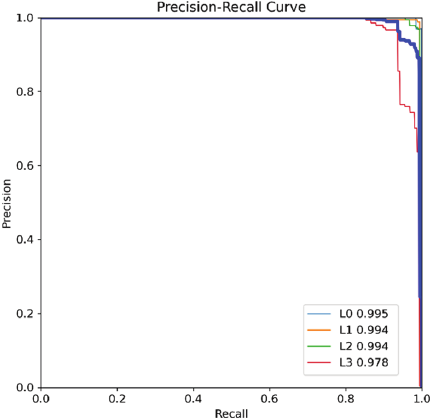
Fig. 10. Precision–recall curve in diagnosis of breast cancer.
Figure 9 shows F1–confidence curve in diagnosis of breast cancer. Through this curve, the optimal classification threshold can be identified, at which the model achieves the highest F1 score. From the curve, it can be seen that breast cancer diagnosis has relatively high F1 scores at most confidence thresholds, indicating that the model performs well in detecting these common targets.
Figure 10 presents precision–recall curve for breast cancer diagnosis. The curve reflects the model’s performance in identifying cancer patients, maintaining higher accuracy at high recall rates. This indicates fewer healthy individuals are misdiagnosed at the same missed diagnosis ratio.
Table 2. Comparison of the test results of the YOLOv10 network and current mainstream algorithms.

Table 3. Comparison of different lesion size groups in the proposed model.

4. Discussion
The model proposed in this study was tested simultaneously with current mainstream models such as Faster RCNN, YOLOv5, YOLOv7, YOLOv8, YOLOv10, and YOLOv12. These models were retrained from scratch on the target dataset using identical data splits, input resolutions, and augmentation policies. The tests focused on information such as accuracy, the number of layers of the model, the number of fps, and weights. The detection results of different models are displayed in Table 2.
It can be seen from Table 2 that the proposed method can be employed to improve detection accuracy, which has an average accuracy of 98.8%. Compared with YOLOv10s and YOLOv10m, the proposed model also shows significant advantages with an improved accuracy of 3.2% and 2.7%. Our model was 0.2% higher on recall, 0.5% higher on precision, 0.6% higher on F1-score compared with YOLOv12. At the same time, its fps reached 154, meeting the requirements of real-time performance. Thus, among the classical algorithms, our model is the most suitable for breast lesions detection and classification.
To evaluate the detection performance across lesions of varying sizes, we conducted experiments to assess the proposed model’s effectiveness in classifying smaller lesions. As shown in Table 3, Group 1 (the smaller lesions, majority of which do not exceed 32 pixels) achieved an accuracy of 98.2%, recall of 96.1%, precision of 97.6%, and F1 score of 98.0%. Compared to Group 2 (all lesions), the model demonstrated comparable discriminatory performance for smaller tumors, indicating its efficacy in detecting and classifying small-size lesions.
The detection results when the improved algorithm was used in this work are shown in Fig. 11. The proposed method works well in breast cancer detection, and the improved model is more capable of meeting the requirements of detecting electric breast cancer lesions in real-world scenarios. It can accurately detect L3 lesions and has high accuracy in detecting other levels of lesions.
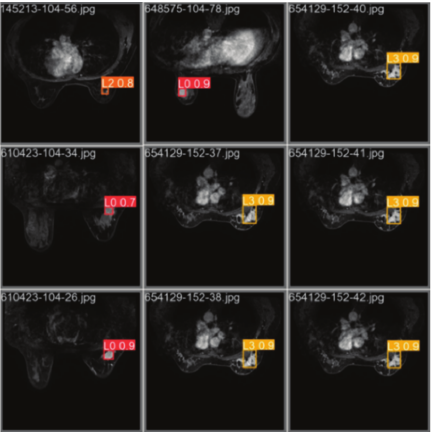
Fig. 11. Example results of breast cancer diagnosis.
5. Conclusions
To tackle the problems of insufficient detection accuracy and slow detection speed of small and multi-target lesions, an improved model was proposed in this paper based on YOLOv10. The model introduces a lightweight backbone network to reduce the network depth of the model. As a result, the detection speed and performance can reach an equilibrium state. The parameters and computational cost of the model are reduced. The RefConv module is embedded into the C2f structure in the Neck section to further reduce channel redundancy and smooth out lossy situations. In the feature fusion network part, introducing a light-weight up-sampling operator content-aware feature reorganization CARAFE module improves the quality and richness of output features and effectively raises detection accuracy and speed. The average accuracy of the method is 98.8%. The accuracy of the model is improved by 3.2% and 2.7% compared with that of YOLOv10s and YOLOv10m. The model is a significant advantage over mainstream models such as Faster RCNN, YOLOv5, YOLOv7, YOLOv8, YOLOv10, and YOLOv12.
In this paper, the overwhelming majority of lesions in our dataset is small size, the sample size for each size-based stratum is unfortunately limited at present. Consequently, it is difficult to provide stable, size-stratified detection accuracy or mAP results. In the next stage, we will focus on early detection of small-size lesion, conduct more in-depth comparative studies such as instance segmentation research, especially on the model performance research with different size of lesions, and apply the model to actual clinical practice.
- [1] D. Xavier, I. Miyawaki, C. A. C. Jorge et al., “Artificial intelligence for triaging of breast cancer screening mammograms and workload reduction: A meta-analysis of a deep learning software,” J. of Medical Screening, Vol.31, No.3, pp. 157-165, 2024. https://doi.org/10.1177/09691413231219952
- [2] H. S. Rugo et al., “185O Trastuzumab deruxtecan (T-DXd) vs treatment of physician’s choice (TPC) in patients (pts) with HER2-low unresectable and/or metastatic breast cancer (mBC): A detailed safety analysis of the randomized, phase III DESTINY-Breast04 trial,” ESMO Open, Vol.8, No.1, Article No.101374, 2023. https://doi.org/10.1016/j.esmoop.2023.101374
- [3] Y. Yang et al., “A new nomogram for predicting the malignant diagnosis of breast imaging reporting and data system (BI-RADS) ultrasonography category 4A lesions in women with dense breast tissue in the diagnostic setting,” Quant. Imaging Med. Surg., Vol.11, No.7, pp. 3005-3017, 2021. https://doi.org/10.21037/qims-20-1203
- [4] S. Ren et al., “Faster R-CNN: Towards real-time object detection with region proposal networks,” Proc. of the 29th Int. Conf. on Neural Information Processing Systems, pp. 91-99, 2015.
- [5] J. Xu, H. Ren, S. Cai, and X. Zhang, “An improved faster R-CNN algorithm for assisted detection of lung nodules,” Computers in Biology and Medicine, Vol.153, Article No.106470, 2023. https://doi.org/10.1016/j.compbiomed.2022.106470
- [6] J. Redmon, S. Cdivvala, R. Cgirshick et al., “You Only Look Once: Unified, real-time object detection,” Proc. of 2016 IEEE Conf. on Computer Vision and Pattern Recognition, pp. 779-788, 2016. https://doi.org/10.1109/CVPR.2016.91
- [7] C.-Y. Wang, A. Bochkovskiy, and H.-Y. M. Liao, “YOLOv7: Trainable bag-of-freebies sets new state-of-the-art for real-time object detectors,” 2023 IEEE/CVF Conf. on Computer Vision and Pattern Recognition (CVPR), pp. 7464-7475, 2023. https://doi.org/10.1109/CVPR52729.2023.00721
- [8] Y. Tian, Q. Ye, and D. Doermann, “YOLOv12: Attention-Centric Real-Time Object Detector,” arXiv:2502.12524, 2025. https://doi.org/10.48550/arXiv.2502.12524
- [9] M. Lei, S. Li, Y. Wu, H. Hu, Y. Zhou, X. Zheng, G. Ding, S. Du, Z. Wu, and Y. Gao, “YOLOv13: Real-Time Object Detection with Hypergraph-Enhanced Adaptive Visual Perception,” arXiv:2506.17733, 2025. https://doi.org/10.48550/arXiv.2506.17733
- [10] L. Sun, Y. Zhang, T. Liu et al., “A collaborative multi-task learning method for BI-RADS category 4 breast lesion segmentation and classification of MRI images,” Computer Methods and Programs in Biomedicine, Vol.240, Article No.107705, 2023. https://doi.org/10.1016/j.cmpb.2023.107705
- [11] F. Rajeena P.P and S. Tehsin, “A Framework for Breast Cancer Classification with Deep Features and Modified Grey Wolf Optimization,” Mathematics, Vol.13, No.8, Article No.1236, 2025. https://doi.org/10.3390/math13081236
- [12] M. Epimack, M. He, and M. Palme, “Deep learning mammography classification with a small set of data,” Current Medical Imaging, Vol.20, Article No.e110823219688, 2024. https://doi.org/10.2174/1573405620666230811142718
- [13] T. Yang, L. Yang, M. Yang et al., “Study on the application of YOLO algorithm based on improved YOLO network in the detection of ultrasound image for breast tumor,” China Medical Equipment, Vol.21, No.9, pp. 23-27, 2024.
- [14] A. Alaa and S. A. Aly, “Acute lymphoblastic leukemia diagnosis employing YOLOv11, YOLOv8, ResNet50, and inception-ResNet-v2 deep learning models,” arXiv:2502.09804v1, 2025. https://doi.org/10.48550/arXiv.2502.09804
- [15] A. Wang, H. Chen, L. H. Liu et al., “YOLOv10: Real time end-to-end object detection,” arXiv:2405.14458, 2024. https://doi.org/10.48550/arXiv.2405.14458
- [16] J. Terven, D.-M. Córdova-Esparza, J.-A. Romero-González et al., “A comprehensive review of YOLO architectures in computer vision: From YOLOv1 to YOLOv8 and YOLO-NAS,” Machine Learning and Knowledge Extraction, Vol.5, No.4, pp. 1680-1716, 2023. https://doi.org/10.3390/make5040083
- [17] H. Chen, Y. Wang, J. Guo, and D. Tao, “VanillaNet: The power of minimalism in deep learning,” arXiv:2305.12972, 2023. https://doi.org/10.48550/arXiv.2305.12972
- [18] M. Bachhawat, “Generalizing GradCAM for embedding networks,” arXiv:2402.00909, 2024. https://doi.org/10.48550/arXiv.2402.00909
- [19] X. Qiu, Y. Chen, W. Cai, M. Niu, and J. Li, “LD-YOLOv10: A Lightweight Target Detection Algorithm for Drone Scenarios Based on YOLOv10,” Electronics, Vol.13, No.16, Article No.3269, 2024. https://doi.org/10.3390/electronics13163269
- [20] Y. Si, X. Du, and Z. Su, “Research on improved YOLOv10 object detection algorithm,” Computer & Telecommunication, Vol.11, pp. 1-5, 2024.
- [21] Z. Cai, X. Ding, Q. Shen and X. Cao, “RefConv: Reparameterized refocusing convolution for powerful ConvNets,” IEEE Trans. on Neural Networks and Learning Systems, Vol.36, No.6, pp. 11617-11631, 2025. https://doi.org/10.1109/TNNLS.2025.3552654
This article is published under a Creative Commons Attribution-NoDerivatives 4.0 Internationa License.