Research Paper:
Applying Three-Arm Design for Assessing Distance Learning
Hsin-Neng Hsieh
 , Chien-Chou Chen
, and Hung-Yi Lu†
, Chien-Chou Chen
, and Hung-Yi Lu†
Department of Statistics and Information Science, Fu Jen Catholic University
No.510 Zhongzheng Rd., Xinzhuang Dist., New Taipei 242062, Taiwan
†Corresponding author

The COVID-19 pandemic has transformed teaching methods, shifting from traditional face-to-face teaching to distance learning. To explore the effectiveness of digital distance teaching in STEM subjects, this study uses mathematical statistics as a case study to analyze and compare student learning outcomes across three different digital distance teaching methods. While conventional assessment of differences in mean values among three sample groups often adopts analysis of variance (ANOVA), ANOVA requires adherence to two major assumptions: normality and homogeneity of variances, which may not be satisfied in practical applications. However, in clinical trials, superiority or noninferiority tests in a three-arm design are often conducted to confirm the effectiveness of a new drug compared to a control group (old drug or placebo). In a three-arm design, superiority or noninferiority tests can be applied under conditions of variance heterogeneity, which represents the primary distinction from the ANOVA approach. We employed superiority and noninferiority tests in the three-arm design to assess student learning effectiveness across three distance digital teaching methods, utilizing Fieller’s and bootstrap methods. An intensive simulation study revealed Fieller’s method performed satisfactorily. Fieller’s method both adequately controlled the empirical type I error rate and was uniformly more powerful than the bootstrap method. Accordingly, Fieller’s method yields stable test results in small samples, making it suitable for scenarios with limited sample sizes in educational settings. Finally, the proposed application methods are illustrated using real-world data.
Power of two methods in three-arm design
1. Introduction
Despite the disruptive effects of the COVID19 pandemic, conducting normal teaching and ensuring teaching quality remain essential tasks for universities. In response to the disruptions caused by the COVID-19 pandemic and its subsequent evolution into a post-pandemic educational landscape, both teaching strategies and student learning behaviors have undergone significant transformations. For personal instruction, teaching methods have changed from traditional face-to-face teaching to distance learning methods. Distance learning allows students to learn through digital tools and the internet at any time, thereby providing a solution to the limitations of time and space. However, to conduct effective digital learning, teachers must integrate learning concepts into the digital teaching content. To explore the effectiveness of distance teaching in mathematics and science subjects in the COVID-19 pandemic setting, this study explores statistical test procedure methods for evaluating students’ learning effectiveness using three types of distance learning in mathematical statistics.
In the field of education, analysis of variance (ANOVA) is often adopted to compare the learning effectiveness of various teaching methods. However, ANOVA must conform to the two statistical assumptions of normality and homogeneity of variance, which may not always be satisfied in practice. To compare the learning effectiveness of the three distance teaching methods on students, we applied a three-arm design to assess their learning outcomes.
Three-arm designs are often used in clinical trials. A three-arm design usually includes experimental, reference, and standard groups. In clinical pharmacies, when a placebo (standard group) is used, the purpose of drug development is to demonstrate that the treatment effect in the experimental group is superior to that in the active control group (reference group). Clinical medical researchers want to demonstrate that experimental treatments are superior to active controls. However, if the experimental treatment showed no statistically significant difference in efficacy compared with the control group but provided additional benefits, such as greater tolerability, improved safety, or enhanced convenience, its clinical value can be demonstrated through a noninferiority test (Tsai and Hsieh 1; Hsieh and Lu 2). The objective of a noninferiority test is to establish the efficacy of an experimental group compared to the reference group when the prespecified noninferiority margin is exceeded. In the three-arm design, many researchers have conducted studies related to noninferiority testing (D’Agostino et al. 3; Hauschke and Pigeot 4; Zhong et al. 5; Adjabui et al. 6). In a three-arm design noninferiority test, a comparison between the ratio of the mean difference between the experimental and standard groups and that between the reference and standard groups is critical (Pigeot et al. 7; Hasler et al. 8; Chang et al. 9). The testing problem regarding the ratio of differences in means was first formulated by Pigeot et al. 7. Assuming normality and variance homogeneity, Pigeot et al. 7 derived a statistical test procedure based on Fieller’s confidence interval 10. Furthermore, Pigeot et al. 7 considered a bootstrap percentile interval instead of Fieller’s method for cases where the assumption of normality did not hold 7. Additionally, under the variance heteroscedasticity assumption, Hasler et al. derived a testing procedure by employing Fieller’s method 8. For data from two treatment groups, Chen et al. 11 conducted a cost-effectiveness analysis with the estimates of the incremental cost-effectiveness ratio and its confidence interval based on Fieller’s method. Mahmoudi et al. 12 constructed a Fieller confidence interval for the ratio of the means in two independent populations.
Previous studies have shown that the three-arm design is primarily applied in biomedical research and rarely used in the field of educational research. Piccoli et al. 13 conceptualized learning effectiveness as observable changes in learners’ knowledge, skills, and attitudes following instructional engagement. In the context of higher education, it reflects not only cognitive development but also behavioral and attitudinal transformations as outcomes of formal education. This effectiveness is frequently assessed through learning outcomes that serve as practical indicators of academic evaluation. According to Boghikian-Whitby and Mortagy 14, learning outcomes, typically operationalized through tests, midterm and final exams, and final course grades, are widely adopted measures for this purpose. Noesgaard and Ørngreen 15 further highlighted that quantifying these outcomes is one of the most valid approaches to evaluating instructional effectiveness, enabling educators to determine whether their intended learning goals are being met. Among various performance indicators, the grade point average is commonly used to represent cognitive achievement 16. Gerholm et al. 17 employed a three-arm design to investigate the comparative effectiveness of different preschool teaching methodologies on the development of language, communication, and attention in children aged four to six. In a related effort to assess digital learning modalities, Lu and Hsieh 18 used noninferiority testing to evaluate the efficacy of asynchronous distance education. Therefore, in this study, assuming normality and under the assumption that the variances of the experimental, reference, and standard groups have heteroscedasticity, we applied Fieller’s and bootstrap methods to conduct the superiority and noninferiority test in a three-arm design to assess learning effectiveness under the three distance teaching methods.
The remainder of this paper is organized as follows: In the next section, the statistical problem is formulated, and we introduce the heuristic statistical testing procedure for the superiority and noninferiority test in a three-arm design using the bootstrap and Fieller’s methods. In the third section, the empirical type I error rate and power of the proposed testing procedures are examined under simulation studies and compared with those from the bootstrap and Fieller’s methods. These methods are illustrated using a numerical example in the fourth section. Finally, the discussion and conclusions are presented in the final section.
2. Methodology
Let \(X_{E,i}\), \(X_{R,j}\), \(X_{S,k}\) denote the grades of students when different distance teaching methods are used for the experimental, reference, and standard groups, respectively. Suppose that these random variables are mutually independent and normally distributed with means of \(\mu_E\), \(\mu_R\), and \(\mu_S\) and unknown variances of \(\sigma_E^2\), \(\sigma_R^2\), and \(\sigma_S^2\), respectively. That is, \(X_{E,i}{\sim} N(\mu_E,\sigma_E^2)\), \(i=1,\dots,n_E\); \(X_{R,j}{\sim} N(\mu_R,\sigma_R^2)\), \(j=1,\dots,n_R\); and \(X_{S,k}{\sim} N(\mu_S,\sigma_S^2)\), \(k=1,\dots,n_S\). The sample sizes \(n_E\), \(n_R\), and \(n_S\) are not necessarily assumed to be equal. We define \(\Delta\) as the mean difference between the reference and standard groups, that is, \(\Delta=\mu_R-\mu_S\). In addition, two variance ratios are introduced: \(\tau_R={\sigma_R^2}/{\sigma_E^2}\) and \(\tau_S={\sigma_S^2}/{\sigma_E^2}\). Without a loss of generality, higher scores represented better learning outcomes. First, the statistical testing problem for comparing the experimental and reference groups is provided by
In this study, we applied a superiority and noninferiority test to evaluate the learning effectiveness of the three distance teaching methods. For the statistical test procedure in (1), we use the bootstrap method and Fieller’s method to test the hypothesis. In the following subsections, we introduce the three-arm design superiority and noninferiority test using the bootstrap and Fieller’s methods.
2.1. Bootstrap Method
The bootstrap method (Efron and Tibshirani 20) has become a widely used technique for testing hypotheses and constructing confidence intervals, particularly when the underlying distribution is not normal or the distribution of sample statistics is not feasible. To test hypothesis (1), we conducted the following bootstrap method to evaluate the learning effectiveness of the three distance teaching methods.
-
Step 1:
Let \(\boldsymbol{x}_{E}=(x_{E,1},\ldots,x_{E,n_E})\), \(\boldsymbol{x}_{R}=(x_{R,1},\dots,x_{R,n_R})\), and \(\boldsymbol{x}_S=(x_{S,1},\dots,x_{S,n_S})\) denote the observation values of the grades of the students using different teaching methods for the experimental, reference, and standard groups, respectively. A bootstrap sample \(\boldsymbol{x}^{\ast b}=(\boldsymbol{x}_E^{\ast b},\boldsymbol{x}_R^{\ast b},\boldsymbol{x}_S^{\ast b})\) can be generated from the original sample \(\boldsymbol{x}=(\boldsymbol{x}_E,\boldsymbol{x}_R,\boldsymbol{x}_S)\) with the sample sizes \(n_E\), \(n_R\), and \(n_S\), respectively.
-
Step 2:
Calculate
\begin{equation*} \hat{\theta}^{\ast b}=\frac{\bar{x}_E^{\ast b}-\bar{x}_S^{\ast b}}{\bar{x}_R^{\ast b}-\bar{x}_S^{\ast b}}. \end{equation*} -
Step 3:
Repeat Steps 1 and 2 for \(\boldsymbol{b}=1,\dots,{B}\). Here \({B}\) denotes the number of bootstrap samples.
-
Step 4:
The \((1-\alpha)\) lower confidence limit for \(\theta=(\mu_E-\mu_S)/(\mu_R-\mu_S)\) is estimated using the \(\alpha\times 100\%\) quantile of the collection of \(B\) realized values of \(\hat{\theta}^{\ast b}\). Let \(L_{\hat{\theta}^{\ast b}}\) denote the estimate value of the lower confidence limit for \(\theta\).
-
(1)
Assuming \(\theta_0>1\), if \(L_{\hat{\theta}^{\ast b}}>\theta_0\), then the null hypothesis stated in Eq. \(\eqref{eq:1}\) is rejected. This outcome provides evidence in favor of a superiority claim, indicating that the teaching strategy applied in the experimental group is more effective in enhancing students’ learning performance than that employed in the reference group.
-
(2)
Assuming \(0.5<\theta_0<1\), if \(L_{\hat{\theta}^{\ast b}}>\theta_0\), then the null hypothesis in Eq. \(\eqref{eq:1}\) is rejected. Under these conditions, the results support a noninferiority assertion, suggesting that the instructional method used in the experimental group is not inferior to that of the reference group in terms of promoting learning outcomes.
-
(1)
2.2. Fieller’s Method
Assuming normality and that the variances of the experimental, reference, and standard groups are heteroscedastic, Hasler et al. 8 derived the confidence interval for \(\theta=(\mu_E-\mu_S)/(\mu_R-\mu_S)\) using Fieller’s method 10. We apply the lower confidence limit for \(\theta\) to test hypothesis (1). Let \(\bar{X}_E\), \(\bar{X}_R\), and \(\bar{X}_S\) denote the sample means of the experimental, reference, and standard groups, respectively. Furthermore, let \(S_E^2\), \(S_R^2\), and \(S_S^2\) be the corresponding sample variances, respectively. In this case, the \((1-\alpha)\) lower confidence limit for \(\theta=(\mu_E-\mu_S)/(\mu_R-\mu_S)\) is given by
For a given significance level \(\alpha\),
-
(1)
Assuming \(\theta_0>1\), if \(\hat{\theta}_L>\theta_0\), we reject the \(H_0\) of hypothesis test (1) and conclude that the experimental group is superior to the reference group.
-
(2)
Assume that \(0.5<\theta_0<1\), if \(\hat{\theta}_L>\theta_0\), we reject the \(H_0\) of test (1), indicating that the performance of the experimental group is not inferior to that of the reference group.
3. Simulation Study
The simulation study comprised the two scenarios presented in this section. The first simulation examined the finite sample properties of Fieller’s and bootstrap methods. The empirical type I error rate from Fieller’s method was compared with that from the bootstrap method in the first simulation. The second simulation assessed the performance of Fieller’s method in comparison with that of the bootstrap method.
Table 1. Type I error rates for testing noninferiority with noninferiority limit \(\theta_{0}\) chosen at 0.6 in case (i), \(\Delta =12\).

Table 2. Type I error rates for testing noninferiority with noninferiority limit \(\theta_{0}\) chosen at 0.6 in case (ii), \(\Delta=15\).

Table 3. Type I error rates for testing superiority with superiority limit \(\theta_{0}\) chosen at 1.25 in case (i), \(\Delta=12\).

Table 4. The type I error rates for testing superiority with superiority limit \(\theta_{0}\) chosen at 1.25 in case (ii), \(\Delta=15\).

3.1. Simulation Study I: Empirical Type I Error Rate
The noninferiority and superiority limits were fixed at \(\theta_0=0.6\) and \(\theta_0=1.25\), respectively, in this study. To explore the empirical type I error rate, we consider the following two cases: (i) \(\Delta=\mu_R-\mu_S=12\) and (ii) \(\Delta=\mu_R-\mu_S=15\). To maintain a balanced sample size under the three different distance teaching methods, we allocated \(1{:}1{:}1\) of the total sample size \(n\) into the experimental, reference, and standard groups. The total sample sizes were \(n=45\), 90, and 120. The population means of the reference and standard groups \((\mu_R,\mu_S)\) were set to \((80,68)\) and \((80,65)\), respectively. In all cases, the mean population of the experimental group was fixed at \(\mu_E=\theta_0\times \Delta+\mu_S\). \(\tau_R=\sigma_R^2/\sigma_E^2\) and \(\tau_S=\sigma_S^2/\sigma_E^2\) were defined. \(\tau_R\) and \(\tau_S\) were set to 0.5, 1.0, and 2.0, respectively. The variance of the experimental group (\(\sigma_E^2\)) was fixed at 100, and the variances of the reference (\(\sigma_R^2\)) and standard (\(\sigma_S^2\)) groups were equal to \(\tau_R\times \sigma_E^2\) and \(\tau_S\times \sigma_E^2\), respectively. For each combination of specified parameters, the simulation data were independently generated 5000 times. For each simulated dataset, we calculated the empirical type I error rates for each method. Under a nominal significance level of 0.05, the empirical type I error rate was computed as the proportion of 5000 simulated \(p\) values that were less than 0.05. Furthermore, if a testing procedure can adequately control the size at a nominal significance level of 0.05, the empirical sizes should be between 0.0440 and 0.0560. The simulation results are displayed in Tables 1–4.
Tables 1 and 2 present the results of type I error rates based on the ratio of the mean difference for assessing noninferiority in a three-arm design with a noninferiority limit of 0.6. By contrast, Tables 3 and 4 present the type I error rates from the superiority testing procedures, where a superiority margin of 1.25 was applied. The simulation results led to the following conclusions:
-
1.
Tables 1–4 present the three different sample sizes and two different \(\Delta\) values. From Tables 1–4, the ranges of type I error rates of Fieller’s method are given by \((0.0482,0.0542)\). All 108 (100%) type I error rates were between 0.0440 and 0.0560 using Fieller’s method, and most of them were close to the nominal value of 0.05. Therefore, the test procedure of the Fieller’s method can adequately maintain type I error rates close to the nominal level of 0.05.
-
2.
In addition, the ranges of the type I error rates of the bootstrap method in each table are given by \((0.0072,0.0734)\). Only 54 of the 108 (5%) type I error rates fell within 0.0440 and 0.0560. Hence, the hypothesis test procedure in Eq. \(\eqref{eq:1}\) using the bootstrap method is conservative.
-
3.
In summary, one can observe that under Fieller’s method, the type I error rates are closer to the nominal level when \(\tau_R\) and \(\tau_S\) are not too small. The contrast is sharper when the sample size is small (\(n=45\)). Furthermore, the bootstrap approach appears to exhibit a conservative tendency, particularly when \(\theta_0\) is 1.25, \(\tau_S=2\), and the sample size is relatively small. As a result, we conclude that, compared to the bootstrap method, the type I error rate can be maintained close to the nominal level when applying Fieller’s method.
3.2. Simulation Study II: Empirical Power
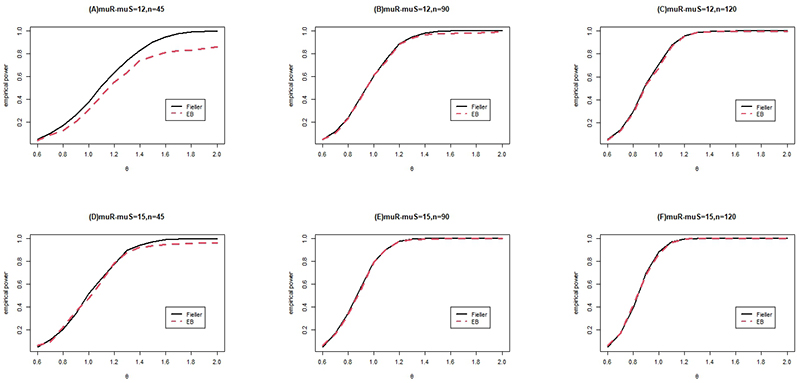
In this simulation, we considered two cases: \(\Delta=\mu_R-\mu_S=12\) and \(\Delta=\mu_R-\mu_S=15\). The total sample sizes were fixed at \(n=45\), 90, and 120. The noninferiority and superiority limits were fixed at \(\theta_0=0.6\) and \(\theta_0=1.25\), respectively. We compared the performance of Fieller’s method with that of the bootstrap method. We selected the same settings for the simulation parameters as those used in simulation study I. The resulting empirical power curves are shown in Figs. 1 and 2.
Figures 1 and 2 show that the Fieller method is more powerful than the bootstrap method, particularly when the sample size is small. In addition, the performance of the bootstrap method improves as the total sample size \(n\) increases. When the sample size is large, the empirical type I error rate and empirical power obtained when the bootstrap method is used are comparable to those obtained when Fieller’s method is used.
In addition, as illustrated in Figs. 1 and 2, the two methods perform similarly when the mean difference and total sample size are large. Furthermore, when the total sample size increased and the mean difference between the reference and standard groups was large in the simulation study, the performance of the bootstrap method was comparable to that of Fieller’s method.
4. Numerical Example
The dataset pertains to students’ learning effectiveness under three different distance teaching methods implemented in a mathematical statistics course at a private Taiwanese university in 2020. Owing to the impact of the COVID-19 pandemic, we explained to students at the beginning of the semester that the mathematical statistics course would be conducted using different types of digital remote teaching methods, which are based on the university’s COVID-19 measures online teaching manual (https://www.fju.edu.tw/ncov/file/20200213_3.pdf). Before the beginning of the mathematical statistics course, no difference in students’ knowledge and skills pertaining to mathematical statistics was observed in the pretest (\(p\)-value \(=0.988\)). The dataset was comprised of 51 students. We randomly assigned students into three groups: asynchronous online learning, synchronous online learning, and interactive computer-assisted teaching were employed in the first group (experimental group). Asynchronous and synchronous online learning were adopted for the second group (reference group), and asynchronous online learning was adopted for the third group (standard group). The experimental, reference, and standard groups comprised 17 students each.
The \(p\)-values of the Shapiro–Wilk normality test of students’ learning effectiveness in the experimental, reference, and standard groups were 0.157, 0.430, and 0.542, respectively. At the 5% significance level, the \(p\)-values of the Shapiro–Wilk normality test indicated that the normality assumption of the data was tenable. Furthermore, the average learning performance of students in the reference group was significantly better than that in the standard group (\(p\)-value \(=0.002\)) in the numerical example. Consequently, the dataset fulfilled the essential assumptions required for the sensitivity evaluation within a three-arm design structure. Moreover, the \(p\)-value of Levene’s homogeneity test of variance was 0.001. The dataset violated the assumption of homogeneity of variance in ANOVA. Although these data violated the homogeneity assumption of the ANOVA, we could still use a three-arm design to assess the learning outcomes of the students. The descriptive statistics and \(p\)-values of the Shapiro–Wilk normality test are presented in Table 5.
Fig. 1. Empirical power functions for sample sizes \(n=45\), 90, 120, \(n_E{:}n_R{:}n_S=1{:}1{:}1\), \(\Delta=\mu_R-\mu_S=12,15\), \(\theta_0=0.6\), and \(\alpha=0.05\).
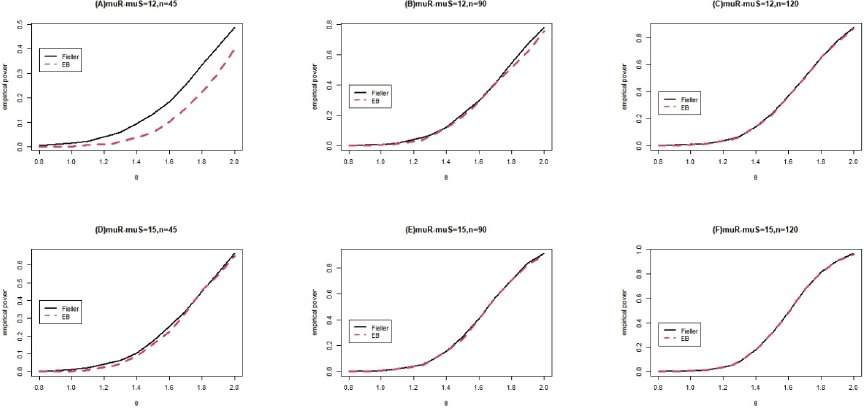
Fig. 2. Empirical power functions for sample sizes \(n=45\), 90, 120, \(n_E{:}n_R{:}n_S=1{:}1{:}1\), \(\Delta=\mu_R-\mu_S=12,15\), \(\theta_0=1.25\), and \(\alpha=0.05\).
Table 5. Lower 95% confidence limits for \((\theta_E-\theta_S)/(\theta_R-\theta_S)\) with superiority limit \(=1.25\) and noninferiority limit \(=0.6\), respectively.

In this numerical example, a three-arm design was employed to conduct both superiority and noninferiority tests by comparing the distance teaching method used in the experimental group with that applied in the reference group. If the primary objective is to evaluate whether the distance teaching approach implemented by the experimental group yields superior academic performance compared with the reference group, the threshold parameter \(\theta_0\) can be set to 1.25. This implies that the experimental group’s learning outcome must exceed 125% of the reference group’s performance to be considered significantly more effective. Conversely, if the aim is to determine whether the experimental group’s distance teaching method is at least not inferior to that of the reference group, \(\theta_0\) may be defined as 0.6. In this case, as long as the experimental group achieves at least 60% of the performance level of the reference group, the method may be regarded as noninferior. From Table 5, the lower 95% confidence limits for \((\theta_E-\theta_S)/(\theta_R-\theta_S)\) in Fieller’s and bootstrap methods were determined to be 0.6212 and 0.6453, respectively. The results of the two methods were similar and were less than \(\theta_0=1.25\). However, the results of Fieller’s and bootstrap methods were both greater than \(\theta_0=0.6\). Therefore, the hypothesis asserting the superiority of the experimental group, comprising asynchronous learning, synchronous online instruction, and interactive computer-assisted teaching, over the reference group, which utilized only asynchronous and synchronous online instruction, was not statistically supported at the \(\alpha=0.05\) level. However, the findings provide sufficient evidence to conclude that the experimental group’s distance learning approach is not inferior to that of the reference group at the same level of significance.
5. Discussion and Conclusions
In the context of distance learning, a teaching method demonstrating superiority indicates that its learning effectiveness is significantly better than that of alternative approaches. This evidence provides a strong rationale for allocating additional resources to further implement or expand teaching methods. In contrast, the noninferiority result suggests that the effectiveness of a given method is comparable to that of a standard or widely adopted approach. This finding is particularly valuable in educational practice, as a noninferior teaching method may still be preferable when it offers benefits such as lower costs, broader accessibility, and greater flexibility for diverse learners. By distinguishing between superiority and noninferiority, educators and policymakers can make evidence-based decisions that balance effectiveness and feasibility, thereby supporting more sustainable and context-sensitive teaching strategies. In this study, we employed Fieller’s and bootstrap methods to conduct superiority and noninferiority tests in a three-arm design to evaluate learning effectiveness under three different distance teaching methods. We apply the superiority and noninferiority tests in the three-arm design to research educational issues. Assuming normality and that the variances of the experimental, reference, and standard groups had heteroscedasticity, the simulation study revealed that Fieller’s method not only maintained a type I error rate that was close to the nominal level, but also provided sufficient power. Therefore, Fieller’s method can serve as an alternative to ANOVA to assess learning effectiveness across the three different distance teaching methods. Furthermore, Fieller’s method can be applied to situations where the data are heterogeneous, and the test results remain stable when the sample size is small. Hence, Fieller’s method is suitable for comparing the learning outcomes of students using a small sample size in a three-arm design.
The results of the superiority test of the numerical example demonstrate that the distance teaching method adopted for the experimental group is not significantly better than that adopted for the reference group in terms of the learning performance of students. A noninferiority test was employed to evaluate the distance teaching method of the experimental group and to verify whether the students’ learning effectiveness in the experimental group was noninferior to that in the reference group.
Furthermore, one limitation of Fieller’s method is that it requires application of the normality assumption to the experimental, reference, and standard groups. We suggest that the Shapiro–Wilk normality test be employed to verify whether the data follow the normality assumption. Furthermore, we recommend applying the power transformation approach of Box and Cox 21 to non-normal data. When the sample size is sufficiently large (e.g., the sample size is 120) and the data violate the normality assumption, the bootstrap method can also be utilized to evaluate the superiority and noninferiority of learning effectiveness using a three-arm design in the presence of heteroscedasticity. This study was conducted in the context of a summer course that used mathematical statistics. Consequently, the findings may not be directly generalizable to other courses, disciplines, student populations, or academic settings. Therefore, caution is advised when extrapolating these results to patients with different characteristics. The evaluation of student learning outcomes in this study was limited to the cognitive domain as measured through quantitative data analysis. No qualitative data, such as student interviews or reflective narratives, were collected to support or complement the findings. Therefore, the interpretations presented here are based solely on statistical evidence. Furthermore, certain external factors beyond the scope of this study, such as students’ socioeconomic backgrounds or individual learning behaviors, were not considered in the analysis, although they may have influenced academic performance. These unaccounted variables represent limitations of the current study. Future research should incorporate additional dimensions of learning, including skill acquisition and attitudinal change, to gain a more comprehensive understanding of student development.
- [1] W. P. Tsai and H. N. Hsieh, “Assessing superiority of the learning effectiveness in the three-arm design in the presence of heteroscedasticity,” 19th South East Asian Association for Institutional Research Annual Conf.: Transforming Intelligence into Action in IR, pp. 443-451, 2019.
- [2] H. N. Hsieh and H. Y. Lu, “The generalized inference on the ratio of mean differences for fraction retention noninferiority hypothesis,” PLOS ONE, Vol.15, No.6, Article No.e0234432, 2020. https://doi.org/10.1371/journal.pone.0234432
- [3] R. B. D’Agostino Sr., J. M. Massaro, and L. M. Sullivan, “Non-inferiority trials: Design concepts and issues – The encounters of academic consultants in statistics,” Statistics in Medicine, Vol.22, No.2, pp. 169-186, 2003. https://doi.org/10.1002/sim.1425
- [4] D. Hauschke and I. Pigeot, “Establishing efficacy of a new experimental treatment in the ‘Gold Standard’ Design,” Biometrical J., Vol.47, pp. 782-789, 2005. https://doi.org/10.1002/bimj.200510169
- [5] J. Zhong, M. J. Wen, K. S. Kwong, and S. H. Cheung, “Testing of non-inferiority and superiority for three-arm clinical studies with multiple experimental treatments,” Statistical Methods in Medical Research, Vol.27, pp. 1751-1765, 2018. https://doi.org/10.1177/0962280216668913
- [6] M. J. Adjabui, N. K. Howard, and M. Akamba, “Biostatistical assessment of mutagenicity studies: A stepwise confidence procedure,” J. of Probability and Statistics, Vol.2019, Article No.3249097, 2019. https://doi.org/10.1155/2019/3249097
- [7] I. Pigeot, J. Schäfer, and D. Hauschke, “Assessing non-inferiority of a new treatment in a three-arm clinical trial including a placebo,” Statistics in Medicine, Vol.22, pp. 883-899, 2003. https://doi.org/10.1002/sim.1450
- [8] M. Hasler, R. Vonk, and L. A. Hothorn, “Assessing non-inferiority of a new treatment in a three-arm trial in the presence of heteroscedasticity,” Statistics in Medicine, Vol.27, pp. 490-503, 2008. https://doi.org/10.1002/sim.3052
- [9] Y. W. Chang, Y. Tsong, X. Dong, and Z. Zhao, “Sample size determination for a three-arm equivalence trial of normality distributed responses,” J. of Biopharmaceutical Statistics, Vol.24, pp. 1190-1202, 2014. https://doi.org/10.1080/10543406.2014.948552
- [10] E. C. Fieller, “Some problems in interval estimation,” J. of the Royal Statistical Society, Series B, Vol.16, pp. 175-185, 1954. https://doi.org/10.1111/j.2517-6161.1954.tb00159.x
- [11] S. Chen, J. Rolfes, and H. Zhao, “Estimation of mean health care costs and incremental cost-effectiveness ratios with possibly censored data,” The Stata J., Vol.15, pp. 698-711, 2015. https://doi.org/10.1177/1536867X1501500305
- [12] M. R. Mahmoudi, J. Behboodian, and M. Maleki, “Large sample inference about the ratio of means in two independent populations,” J. of Statistical Theory and Applications, Vol.16, pp. 366-374, 2017. https://doi.org/10.2991/jsta.2017.16.3.8
- [13] G. Piccoli, R. Ahmad, and B. Ives, “Web-based virtual learning environment: A research framework and a preliminary assessment of effectiveness in basic IT skill training,” MIS Quarterly, Vol.25, No.4, pp. 401-426, 2001. https://doi.org/10.2307/3250989
- [14] S. Boghikian-Whitby and Y. Mortagy, “The effect of student background in e-learning – Longitudinal study,” Issues in Informing Science and Information Technology, Vol.5, pp. 107-126, 2008. https://doi.org/10.28945/3203
- [15] S. S. Noesgaard and R. Ørngreen, “The effectiveness of e-learning: An explorative and integrative review of the definitions, methodologies and factors that promote e-Learning effectiveness,” Electronic J. of e-Learning, Vol.13, No.4, pp. 277-289, 2015. https://academic-publishing.org/index.php/ejel/article/view/1735/1698
- [16] S. R. Hiltz and B. Wellman, “Asynchronous learning networks as a virtual classroom,” Communications of the ACM, Vol.40, No.9, pp. 44-49, 1997. https://doi.org/10.1145/260750.260764
- [17] T. Gerholm, T. Hörberg, S. Tonér, P. Kallioinen, S. Frankenberg, S. Kjällander, A. Palmer, and H. L. Taguchi, “A protocol for a three-arm cluster randomized controlled superiority trial investigating the effects of two pedagogical methodologies in Swedish preschool settings on language and communication, executive functions, auditive selective attention, socioemotional skills and early maths skills,” BMC Psychology, Vol.6, Article No.29, 2018. https://doi.org/10.1186/s40359-018-0239-y
- [18] H. Y. Lu and H. N. Hsieh, “Applying non-inferiority test to evaluate student learning effectiveness of asynchronous distance learning,” Psychological Testing, Vol.69, No.4, pp. 321-350, 2002.
- [19] S. C. Chow and J. P. Liu, “Design and Analysis of Bioavailability and Bioequivalence Studies (3rd Ed.),” CRC/Chapman and Hall, 2008.
- [20] B. Efron and R. J. Tibshirani, “An Introduction to the Bootstrap,” Chapman and Hall, 1994.
- [21] G. E. P. Box and D. R. Cox, “An analysis of transformations,” J. of the Royal Statistical Society, Series B, Vol.26, pp. 211-246, 1964. https://doi.org/10.1111/j.2517-6161.1964.tb00553.x
This article is published under a Creative Commons Attribution-NoDerivatives 4.0 Internationa License.