Paper:
Empirical Analyses of OLMAR Method for Financial Portfolio Selection in Stock Markets
Kazunori Umino*1, Takamasa Kikuchi*2, Masaaki Kunigami*1, Takashi Yamada*3, and Takao Terano*4,†
*1Tokyo Institute of Technology
4259 Nagatsuta-cho, Midori-ku, Yokohama, Kanagawa 226-8503, Japan
*2Keio University
4-1-1 Hiyoshi, Kohoku-ku, Yokohama, Kanagawa 223-8521, Japan
*3Yamaguchi University
1677-1 Yoshida, Yamaguchi-shi, Yamaguchi 753-8511, Japan
*4Chiba University of Commerce
1-3-1 Konodai, Ichikawa-shi, Chiba 272-8512, Japan
†Corresponding author

The OLMAR method, which stands for the on-line moving average reversion method, is reported to be one of the most powerful among portfolio selection algorithms in the stock markets. In this research, we use intensive statistical and simulation analyses of long-term data on stock market changes to uncover the secrets of why and when the superiority appears. We find that there have been long-lasting fluctuations in the stock markets and that the OLMAR method actively makes use of such characteristics. In this paper, we analyze long-term stock data from Japan and the United States. The analyses confirm the following points. 1) The OLMAR method yields superior returns. 2) By using the moving average divergence rate provided by the OLMAR method, it is possible to detect specific fluctuation characteristics in long-term stock data from Japan and the United States. 3) Superior returns cannot be obtained from data in which specific fluctuation characteristics have been corrected.
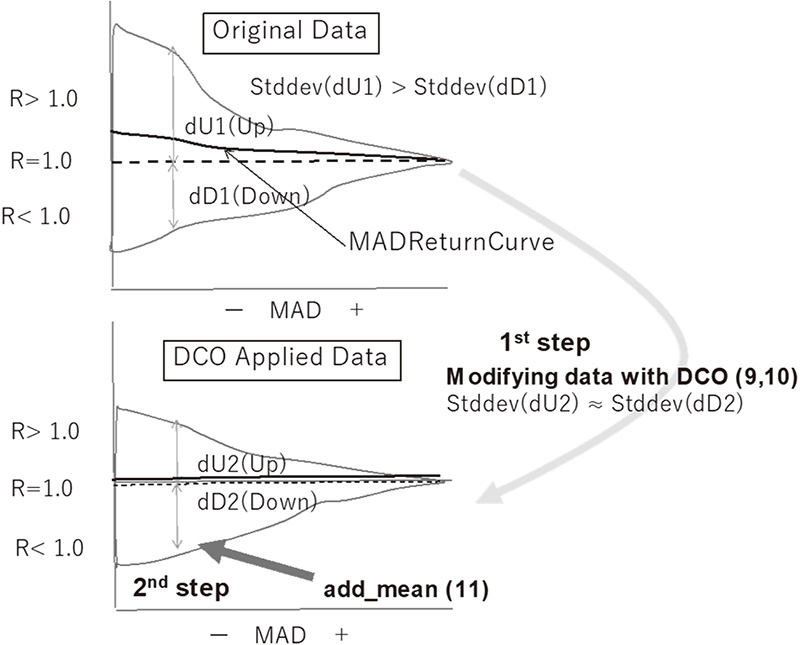
Conceptual diagram of DCO
- [1] B. Li and S. C. H. Hoi, “On-line portfolio selection with moving average reversion,” Proc. of the 29th Int. Conf. on Machine Learning (ICML’12), pp. 563-570, 2012.
- [2] B. Li et al., “Moving average reversion strategy for on-line portfolio selection,” Artificial Intelligence, Vol.222, pp. 104-123, 2015.
- [3] B. Li and S. C. H. Hoi, “Online portfolio selection: A survey,” ACM Computing Surveys (CSUR), Vol.46, No.3, Article No.35, 2014.
- [4] B. Li, D. Sahoo, and S. C. H. Hoi, “OLPS: a toolbox for on-line portfolio selection,” J. of Machine Learning Research, Vol.17, Article No.35, 2016.
- [5] F. M. Nyikosa, M. A. Osborne, and S. J. Roberts, “Adaptive Bayesian Optimisation for Online Portfolio Selection,” Workshop on Bayesian Optimization at NIPS, 2015.
- [6] S. H. Moon and Y. Yoon, “Genetic Mean Reversion Strategy for Online Portfolio Selection with Transaction Costs,” Mathematics, Vol.10, Issue 7, Article No.1073, 2022.
- [7] G. Li and W. Zhang, “Weighted Moving Average Passive Aggressive Algorithm for Online Portfolio Selection,” 2013 5th Int. Conf. on Intelligent Human-Machine Systems and Cybernetics, pp. 327-330, 2013.
- [8] L. Xiao et al., “Boosting Moving Average Reversion Strategy for Online Portfolio Selection: A Meta-Learning Approach,” S. Candan et al. (Eds.), “Database Systems for Advanced Applications (DASFAA 2017),” pp. 494-510, Springer, 2017.
- [9] Y. Kroll, H. Levy, and H. M. Markowitz, “Mean-variance versus direct utility maximization,” The J. of Finance, Vol.39, No.1, pp. 47-61, 1984.
- [10] B. Li, S. C. H. Hoi, and V. Gopalkrishnan, “Corn: Correlation-driven nonparametric learning approach for portfolio selection,” ACM Trans. on Intelligent Systems and Technology (TIST), Vol.2, No.3, Article No.21, 2011.
- [11] A. Agarwal et al., “Algorithms for portfolio management based on the newton method,” ACM Int. Conf. Series, Vol.148, pp. 9-16, 2006.
- [12] B. Qian and K. Rasheed, “Hurst exponent and financial market predictability,” Proc. of the 2nd IASTED Int. Conf. on Financial Engineering and Applications, pp. 203-209, 2004.
- [13] A. Carbone, G. Castelli, and H. E. Stanley, “Time-dependent Hurst exponent in financial time series,” Physica A: Statistical Mechanics and its Applications, Vol.344, No.1, pp. 267-271, 2004.
- [14] W. F. M. D. Bondt and R. H. Thaler, “Anomalies: A mean-reverting walk down Wall Street,” The J. of Economic Perspectives, Vol.3, No.1, pp. 189-202, 1989.
This article is published under a Creative Commons Attribution-NoDerivatives 4.0 Internationa License.