
Research Paper:
Extracting Distinctive Motion Patterns in Nut-Tightening and Nut-Loosening Tasks Based on Joint Angle and Principal Component Analysis
Taku Hayashi*, Kei Harada*,†
 , Koki Karube*, Masao Sugi**
, Munenori Kakehi***, and Tetsuo Yamada*
*Department of Informatics, The University of Electro-Communications
1-5-1 Chofugaoka, Chofu, Tokyo 182-8585, Japan
†Corresponding author
**Department of Mechanical Engineering and Intelligent Systems, The University of Electro-Communications
Chofu, Japan
***Faculty of Symbiotic Systems Science, Fukushima University
Fukushima, Japan

To improve training for manual assembly and disassembly tasks, it is essential to characterize changes in workers’ movements with task repetition. This study analyzed repeated nut-tightening and nut-loosening tasks using optical motion capture data collected from five workers. Workload-related postures were assessed using rapid upper limb assessment (RULA), and movement coordination was examined through principal component analysis (PCA) of six joint angles. The results indicated that the RULA grand score varied little across trials and lacked sufficient sensitivity to detect subtle changes associated with task repetition. By contrast, joint-angle statistics and PCA revealed evidence of both shared and task-specific changes in movement patterns. In particular, PCA indicated a common pattern of adaptation across tasks, alongside distinct changes in coordination during nut-tightening and nut-loosening. These findings suggest that multivariate motion analysis may inform proficiency assessment and the design of task-specific training for manual assembly and disassembly work.
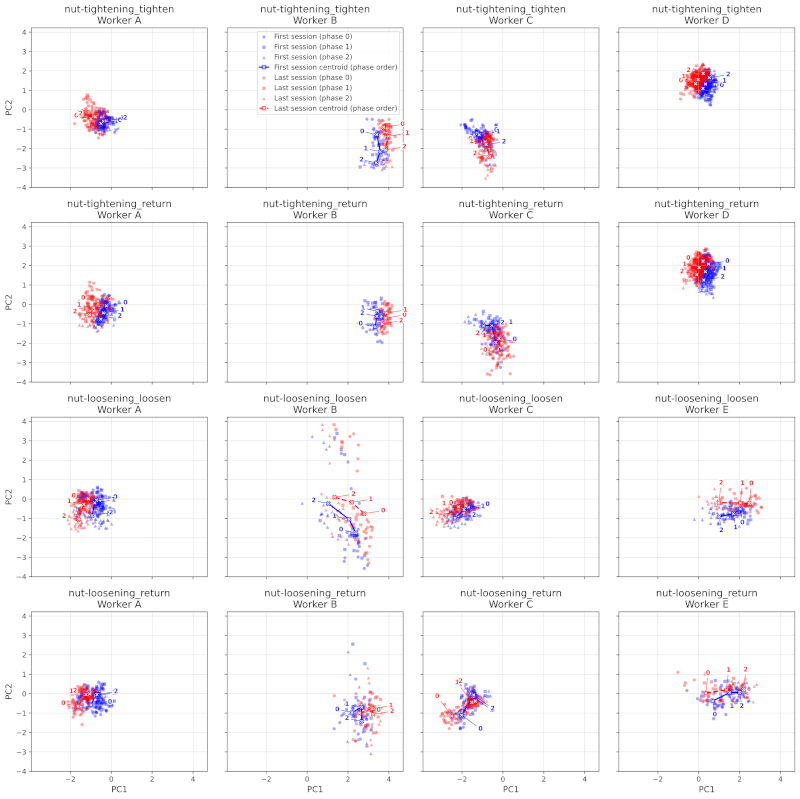
PC1 and PC2 for joint angles
1. Introduction
1.1. Background
Transitioning toward a circular economy is important for sustainable manufacturing and resource efficiency 1,2,3. In this context, the disassembly of end-of-life products and efficient assembly processes play essential roles, particularly in remanufacturing systems 4. However, many of these operations still rely on manual labor because automation remains challenging amid variations in products and operating conditions 5. This reliance on manual labor, coupled with labor shortages due to birthrate shortages, necessitates high operational efficiency. In such settings, a significant disparity in work efficiency often exists between skilled and novice workers, which directly affects overall productivity 6,7. Therefore, a clearer understanding of the relationship between work motion and learning effects is needed to enhance the efficiency of manual tasks.
1.2. Literature Review
Several studies have investigated worker proficiency and motion characteristics by using data-driven and motion-based approaches. Saeki et al. 8 quantified the intuition and skills of experienced workers in welding operations for die manufacturing by using motion capture to support skill transfer and human resource development. Sato et al. 9 evaluated aircraft wing polishing tasks using motion capture and multiple regression analysis to support the training of craftsmen and reduce the unevenness in finished products across different workshops. Kawane et al. 10 proposed an assembly motion analysis method that combined motion capture and machine learning to classify motion differences between experienced and inexperienced workers. In addition, Hayashi et al. 11 classified proficiency before and after learning in a nut-loosening task based on working time using machine learning techniques such as random forest and gradient boosting decision trees.
Furthermore, our previous study, Hayashi et al. 12, used optical motion capture to analyze proficiency differences in a disassembly task and showed that task repetition was associated with reduced variance in joint angles related to rapid upper limb assessment (RULA) 13 and shorter task completion times, although the RULA grand score itself showed no significant differences between skilled and novice workers. While ergonomic assessment systems, such as RULA, are widely recognized assessment methods used in ergonomic investigations to evaluate the physical workload of the neck, trunk, and upper limbs 13,14,15,16,17, previous applications have often been limited to assessing musculoskeletal disorder risks in specific occupational settings or validating muscle activity.
However, previous studies, including ours 12, have primarily examined assembly and disassembly as separate tasks. Although these tasks often involve similar physical motions, their similarities and differences in learning effects and motion characteristics remain insufficiently explored. Therefore, this study follows the analytical framework established in Hayashi et al. 12 and extends research area to compare disassembly and assembly tasks directly. By applying the same motion-based evaluation criteria to both processes, this study aims to identify the common and distinct characteristics of proficiency acquisition in these two fundamental manufacturing operations, nut-loosening and nut-tightening. This study is based on the hypothesis that as workers gain proficiency in a repetitive task, their posture becomes more stable, as reflected in reduced variance in joint angles. Therefore, this paper uses the variance of each joint angle as an indicator to evaluate task proficiency. In addition, although reductions in task completion time are a primary measure of learning during repetitive work, this study does not use this measure because the prolonged measurements required are difficult to conduct in an experimental setting. Furthermore, this study aims to break down the process by which joint angles influence learning effects.
1.3. Research Questions
Nut-loosening and nut-tightening tasks were selected as the primary research targets in this study. In mechanical assembly lines, fastening operations using screws and bolts account for approximately 38% of the total amount of work, and represent one of the most frequent operations in mechanical assembly processes 18. Accordingly, nut tightening constitutes a representative assembly task, and nut loosening is a fundamental operation in disassembly. Analyzing both tasks within a unified framework enables a direct comparison of learning-related changes between the assembly and disassembly tasks. Building upon our previous study on disassembly 12, this study aims to identify both common and distinct learning patterns across these symmetric operations.
This study aimed to clarify the learning-related changes in workload, posture, and movement coordination during repeated nut-loosening and nut-tightening tasks. Optical motion capture was employed to obtain joint angle data during task execution, and RULA was used to evaluate the workload-related posture characteristics. Furthermore, to capture learning-related changes that may not be sufficiently reflected in discrete RULA grand scores, principal component analysis (PCA) was applied to the joint angles that constitute the RULA assessment. PCA enables the extraction and visualization of the dominant movement coordination patterns and their changes with task repetition. The following research questions (RQs) were formulated:
-
RQ1:
Does RULA grand score vary between nut-loosening and nut-tightening tasks, and are these scores affected by task repetition?
-
RQ2:
What differences in joint angles derived from the RULA can be observed between the first and last ten trials, and which of these changes are common to both nut-loosening and nut-tightening tasks?
-
RQ3:
What differences are suggested by comparing the first and last ten trials in both the nut-loosening and nut-tightening tasks using PCA?
The remainder of this paper is organized as follows: Section 2 describes the experimental procedures, data acquisition using optical motion capture, and RULA and PCA methodologies. Section 3 presents the results of RULA and PCA. Section 4 discusses the learning-related similarities and differences between nut-loosening and nut-tightening tasks based on the extracted principal components. Section 5 presents the conclusions and outlines the directions for future research.
2. Method
2.1. Overview
In this study, the motion data of the nut-loosening and nut-tightening tasks were analyzed based on the methodology established in our previous study 12. Whereas the previous study focused exclusively on disassembly (nut-loosening), the present study extends the scope to include both disassembly and assembly (nut-tightening) to investigate similarities and differences in proficiency development across these tasks.
The analytical procedure comprised four steps. In Step 1, 3D time-series coordinated data were acquired via optical motion capture for both tasks. To ensure reliable motion capture and consistent coordinate system definitions, the same marker set and experimental conditions used in the previous study 12 were employed. In Step 2, the joint angles were calculated for each frame, and the RULA grand score was obtained. Notably, while the previous study analyzed four joint angles, this study incorporated two additional angles—the left forearm and left upper arm—to capture the coordination of the non-dominant hand. In Step 3, PCA was performed to examine how these six RULA-related angles differed among workers and across tasks. Finally, Step 4 discusses the changes in workload and the specific characteristics of the learning effect by comparing skilled and novice workers across both assembly and disassembly tasks.
2.2. Experimental Procedure and Motion Data Acquisition
The experimental setup for this study followed the protocol established in our previous work 12. Data were collected for both nut-loosening (disassembly) and nut-tightening (assembly) tasks to enable direct comparison of the two tasks. As illustrated in Table 1, five workers participated in the experiment, including one skilled worker with extensive field experience. Workers A, B, C, and D performed the nut-tightening task, and workers A, B, C, and E performed the nut-loosening task. Workers D and E did not participate in the loosening and tightening tasks, respectively, because the experiments were conducted over two days; therefore, workers D and E participated in only one of the two tasks. While the hardware and environment, such as the table height (81 cm) and marker configurations, were identical to those in the previous study (see 12 for details), the scope was expanded to include assembly trials. The participant’s posture and the experimental environment are shown in Fig. 1. The participants performed 30 repetitions of each task as quickly as possible using a wrench (LOBSTER UM30) to align the target markers on the M16 nuts. As illustrated in Fig. 2, 12 markers were used to capture the motion: ten on the participant’s clothing and two on the wrench. Trajectories were recorded at 60 fps using an optical motion capture system 19. By maintaining the same conditions as those in 12, we focused on identifying specific differences in the motion patterns and workload between loosening and tightening.
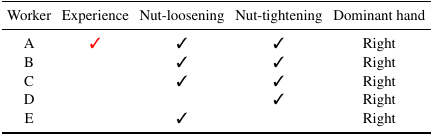
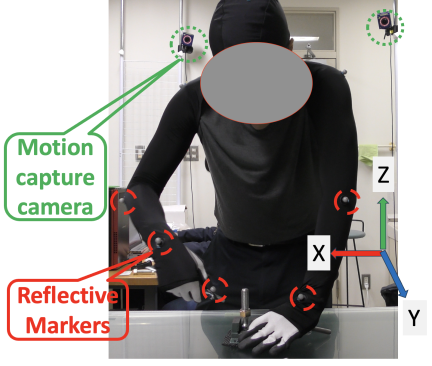
Fig. 1. Measuring device and the nut-loosening or nut-tightening task in progress.
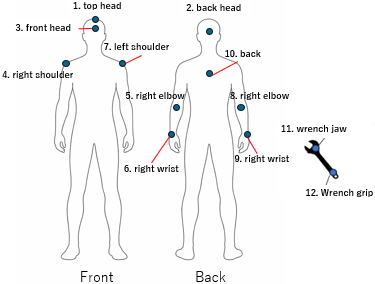
Fig. 2. Attachment points of reflective markers for motion capture 19.
2.3. Motion Data Processing
Missing values in the trajectory data were manually interpolated where possible, and trials with extensive data loss were excluded to ensure analytical reliability. In contrast to our previous study 12, which utilized manual stroke division, this study implemented a more rigorous segmentation procedure to distinguish between functional motion phases.
The motion data from both nut-loosening and nut-tightening tasks were segmented into individual strokes. A single stroke was defined as a complete cycle consisting of wrench rotation followed by the return motion. Unlike the uniform division used in the previous study 12, each stroke in this study was specifically categorized into two functional phases: the “operation phase” (active tightening or loosening) and the “returning phase.” Preparing for target tasks, these phases are defined as follows:
-
・
Tightening: The operation phase of the assembly task, involving clockwise rotation.
-
・
Loosening: The operation phase of the disassembly task, involving counterclockwise rotation.
-
・
Returning: The interval during which the wrench returns to the starting position.
These phases were extracted using a signal processing-based algorithm involving peak and valley detection of wrist marker trajectories. To maintain the focus of this study on the comparative analysis of proficiency, the technical details of the segmentation algorithm, including parameter selection and validation, are provided in Appendix A.
Each operation phase was further divided into three equal-duration segments. This subdivision was necessary because the dynamic characteristics of nut rotation vary substantially throughout the motion, making an overall average insufficient for distinguishing proficiency levels.
2.4. Workload Evaluation Using RULA
To evaluate the workload during assembly and disassembly tasks, RULA 20 was employed. The calculation procedure for the RULA grand score (GS) in this study followed the methodology established in our previous work 12. Worker posture was calculated using trigonometric functions based on 3D time-series coordinated data obtained via motion capture. For example, forearm angle is defined as “the angle formed by the longitudinal axes of the upper arm and the forearm (representing the degree of elbow flexion), with the arm extended straight down defined as 0 degrees” in this study.
As detailed in the previous study, certain joint angles that could not be obtained directly from the marker trajectories were approximated. Specifically, based on video observations, wrist flexion/extension was assigned an intermediate score of 2, whereas wrist twist and leg balance were fixed at the lowest risk scores. These approximations were consistently applied to both the nut-loosening and nut-tightening tasks to ensure a fair comparison. Other ergonomic factors, such as muscle usage and force/load, were defined as zero because the tool weight was less than 2 kg and the task duration for each stroke was short.
While the original RULA provides a snapshot of postural risk, this study aggregated these scores for each defined motion phase. The RULA-based scores were averaged over one-third of the duration of the operation phase, consistent with the segmentation described in Section 2.3. This approach allows for a longitudinal analysis of how physical load evolves as workers repeat the assembly and disassembly tasks.
2.5. PCA for Task Comparison
PCA was used to visualize and compare the transition of movement patterns across repeated trials. To ensure consistency with our previous evaluation 12, the analysis focused on the first and last ten trials for each worker, representing the initial and stabilized stages of task execution.
While the previous study analyzed only four joint angles during the disassembly task, this study expanded the feature set to six angles by incorporating the left forearm and left upper arm. This modification is based on the suggestion by Hayashi et al. 11 that non-dominant hand coordination may influence proficiency acquisition. Furthermore, PCA was applied separately to the “operation” and “returning” phases defined in Section 2.3. This enabled a more granular investigation of how learning effects differ between functional and auxiliary movements.
To capture each phase of postural transition, the data within each phase were divided into three temporal segments: the first, second, and third segments. By applying PCA to a combined dataset comprising nut-tightening and nut-loosening tasks, this study aims to clarify the physical interpretation of each principal component. Furthermore, this study aims to examine how the distributions of principal component scores shift from the first ten trials to the last ten trials, identifying shared and task-specific characteristics of proficiency in assembly and disassembly.
3. Result
3.1. RULA GS for Nut-Loosening and Nut-Tightening Tasks
RULA GS were calculated for each segment of the loosening, tightening, and returning phases to evaluate the physical workload. Figs. 3 and 4 show the transitions of GS values during the nut-loosening and nut-tightening phases, respectively.
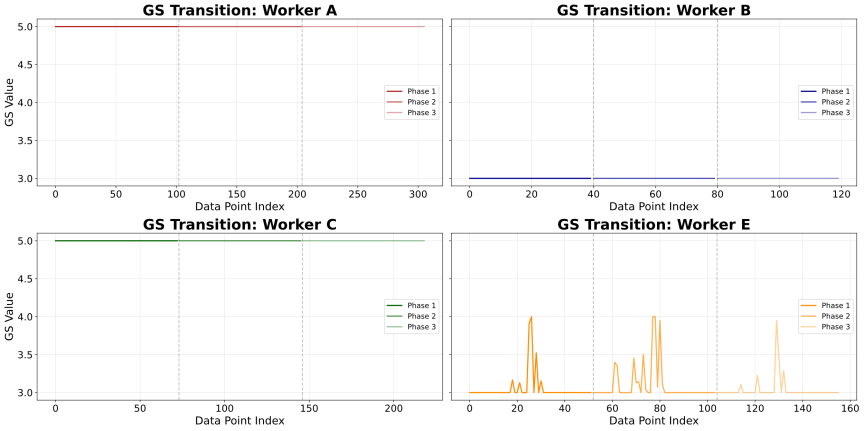
Fig. 3. RULA GSs including four joint-angle information for the loosening phase of the nut-loosening task across all segments.
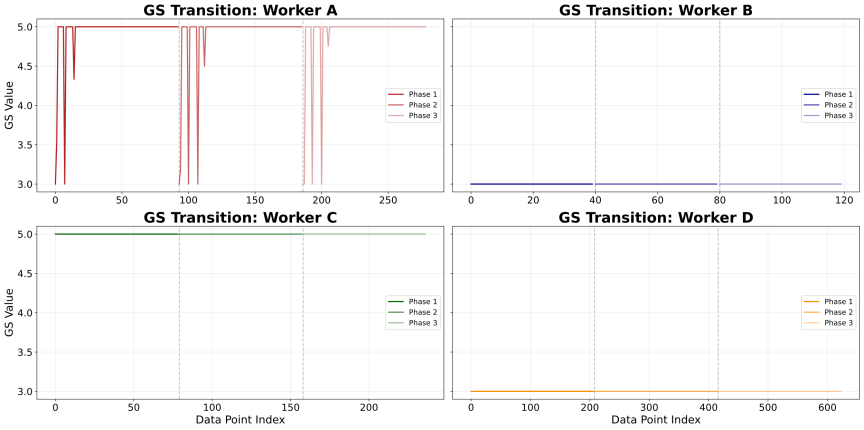
Fig. 4. RULA GSs including four joint-angle information for the tightening phase of the nut-tightening task across all segments.
Across both tasks, a common trend was observed: the GS values for each worker remained almost constant, regardless of task repetition. In the nut-loosening task, workers A and C exhibited a constant GS of 5, whereas workers B and E showed a consistent GS of 3. Similarly, in the nut-tightening task, although skilled worker A showed slight fluctuations between 3 and 5 in the early trials, the scores eventually stabilized at 5. Workers B and D consistently exhibited a GS of 3. These results, which are representative of all analyzed phases, including the returning phase, indicate that the RULA GS does not improve with task repetition, which is consistent with the findings of our previous study 12 regarding the disassembly task.
This absence of change suggests that the RULA GS, a discrete measure with coarse scoring increments, has limited sensitivity to subtle improvements in movement patterns or postural stability resulting from repeated task execution. A major contributor to the persistently high GS values observed for certain workers (e.g., A and C) was the trunk angle, which frequently exceeded the 60° threshold according to our calculations. Although visual inspection of the task videos suggested that such extreme trunk flexion was unlikely to have occurred during the practice, implying that the calculated values may reflect neck or upper-body inclination rather than true trunk motion, the dominance of this high trunk score effectively obscured changes in other joint angles. Furthermore, no substantial differences in GS were observed between the operation phases (loosening/tightening) and the returning phase because the workers maintained a similar global posture throughout the entire motion cycle.
3.2. Comparative Analysis of Joint Angle Obtained via RULA
Because the RULA GSs exhibited limited sensitivity, the mean and variance of the individual joint angles were analyzed to capture subtle changes associated with task repetition. Individual analysis of the mean and variance of the angles of specific body parts is essential for observing task progression and postural adaptation. Table 2 presents the differences in mean angles (\(\Delta\)) for the nut-loosening task, and Table 3 presents the differences in variance for the same task, respectively. Tables 4 and 5 present the differences in the mean and variance of the nut-tightening task, respectively.
| Task | Nut-loosening_loosen | Nut-loosening_return | |||||||||||
| Metric | \(\Delta\)FA | \(\Delta\)UA | \(\Delta\)JA | \(\Delta\)TA | \(\Delta\)FA_L | \(\Delta\)UA_L | \(\Delta\)FA | \(\Delta\)UA | \(\Delta\)JA | \(\Delta\)TA | \(\Delta\)FA_L | \(\Delta\)UA_L | |
| Worker | Segment | ||||||||||||
| A | 0 | 3.585 | \(-\)2.925 | 0.541 | \(-\)0.748 | -4.693 | 5.217 | 4.960 | 1.405 | 0.519 | \(-\)0.219 | \(-\)4.825 | 5.479 |
| 1 | 2.223 | 0.274 | 0.485 | \(-\)0.436 | \(-\)4.314 | 5.613 | 5.082 | \(-\)2.388 | 0.537 | \(-\)0.544 | \(-\)5.100 | 5.217 | |
| 2 | 2.134 | 2.765 | 0.525 | \(-\)0.182 | \(-\)4.282 | 5.750 | 3.514 | \(-\)3.445 | 0.543 | \(-\)0.744 | \(-\)5.408 | 5.125 | |
| B | 0 | 7.799 | \(-\)11.425 | 0.206 | 3.751 | 7.530 | \(-\)4.997 | 0.696 | \(-\)6.172 | 0.152 | 2.834 | \(-\)1.412 | \(-\)3.720 |
| 1 | 11.211 | \(-\)5.818 | \(-\)0.613 | 5.294 | 5.170 | \(-\)4.285 | 4.596 | \(-\)8.813 | 0.086 | 2.569 | \(-\)6.070 | \(-\)4.394 | |
| 2 | 4.786 | \(-\)4.016 | \(-\)0.478 | 2.938 | 1.361 | \(-\)4.089 | 6.970 | \(-\)10.630 | 0.157 | 1.923 | \(-\)1.713 | \(-\)4.922 | |
| C | 0 | 1.916 | \(-\)3.137 | 1.119 | 1.733 | 2.067 | \(-\)0.643 | 1.134 | 0.792 | 1.211 | 3.233 | 3.388 | 0.653 |
| 1 | 2.937 | \(-\)2.600 | 1.069 | 2.476 | 2.699 | \(-\)0.062 | \(-\)2.448 | \(-\)1.649 | 1.253 | 0.979 | 0.248 | \(-\)0.846 | |
| 2 | 2.931 | \(-\)1.127 | 1.042 | 3.372 | 3.170 | 1.008 | \(-\)1.601 | \(-\)2.797 | 1.283 | 0.152 | \(-\)1.021 | \(-\)1.550 | |
| E | 0 | 2.297 | \(-\)1.655 | \(-\)0.759 | \(-\)5.765 | \(-\)2.156 | \(-\)0.062 | 5.399 | 6.226 | \(-\)1.147 | \(-\)0.815 | 2.151 | 2.166 |
| 1 | 4.345 | \(-\)2.406 | \(-\)0.851 | \(-\)4.106 | 0.458 | \(-\)0.065 | 4.324 | 6.696 | \(-\)1.105 | \(-\)3.606 | \(-\)1.792 | 2.016 | |
| 2 | 6.409 | 0.123 | \(-\)1.045 | \(-\)1.045 | 3.329 | 0.755 | 2.208 | 1.675 | \(-\)0.812 | \(-\)5.262 | \(-\)2.817 | 1.154 | |
| A | ALL | 2.647 | 0.038 | 0.517 | \(-\)0.455 | \(-\)4.430 | 5.526 | 4.518 | \(-\)1.476 | 0.533 | \(-\)0.503 | \(-\)5.111 | 5.274 |
| B | ALL | 7.932 | \(-\)7.087 | \(-\)0.295 | 3.994 | 4.687 | \(-\)4.457 | 4.088 | \(-\)8.538 | 0.132 | 2.442 | \(-\)3.065 | \(-\)4.345 |
| C | ALL | 2.595 | \(-\)2.288 | 1.077 | 2.527 | 2.645 | 0.101 | \(-\)0.972 | \(-\)1.218 | 1.249 | 1.455 | 0.872 | \(-\)0.581 |
| E | ALL | 4.350 | \(-\)1.313 | \(-\)0.885 | \(-\)3.639 | 0.544 | 0.210 | 3.977 | 4.866 | \(-\)1.021 | \(-\)3.227 | \(-\)0.819 | 1.778 |
| Average | ALL | 4.381 | \(-\)2.662 | 0.103 | 0.607 | 0.862 | 0.345 | 2.903 | \(-\)1.592 | 0.223 | 0.042 | \(-\)2.031 | 0.532 |
| Task | Nut-loosening_loosen | Nut-loosening_return | |||||||||||
| Metric | \(\Delta\)FA | \(\Delta\)UA | \(\Delta\)JA | \(\Delta\)TA | \(\Delta\)FA_L | \(\Delta\)UA_L | \(\Delta\)FA | \(\Delta\)UA | \(\Delta\)JA | \(\Delta\)TA | \(\Delta\)FA_L | \(\Delta\)UA_L | |
| Worker | Segment | ||||||||||||
| A | 0 | \(-\)10.633 | \(-\)3.035 | \(-\)0.088 | \(-\)3.674 | \(-\)2.626 | \(-\)3.353 | \(-\)9.600 | 1.081 | \(-\)0.117 | \(-\)4.151 | \(-\)1.694 | \(-\)4.152 |
| 1 | \(-\)11.803 | 0.494 | \(-\)0.094 | \(-\)3.953 | \(-\)2.228 | \(-\)4.167 | \(-\)12.316 | \(-\)11.554 | \(-\)0.075 | \(-\)3.860 | \(-\)1.989 | \(-\)3.726 | |
| 2 | \(-\)7.182 | 5.061 | \(-\)0.107 | \(-\)4.102 | \(-\)2.428 | \(-\)4.431 | \(-\)4.785 | \(-\)5.802 | \(-\)0.047 | \(-\)3.775 | \(-\)2.241 | \(-\)3.619 | |
| B | 0 | \(-\)37.398 | \(-\)13.198 | 0.033 | \(-\)2.830 | 261.759 | 0.339 | 33.353 | 0.024 | \(-\)0.054 | \(-\)3.364 | \(-\)8.162 | 1.369 |
| 1 | \(-\)9.011 | \(-\)0.655 | 0.184 | \(-\)4.287 | 69.586 | \(-\)1.511 | 55.870 | 9.682 | \(-\)0.035 | \(-\)2.190 | \(-\)283.133 | \(-\)0.584 | |
| 2 | 17.092 | \(-\)2.609 | \(-\)0.125 | \(-\)11.728 | 202.141 | 0.270 | \(-\)9.376 | 1.959 | \(-\)0.012 | \(-\)1.797 | \(-\)109.159 | \(-\)0.319 | |
| C | 0 | \(-\)6.676 | \(-\)3.192 | \(-\)0.148 | \(-\)0.111 | 4.427 | \(-\)2.815 | \(-\)4.734 | \(-\)7.779 | \(-\)0.072 | 0.572 | 4.863 | \(-\)0.365 |
| 1 | \(-\)4.761 | \(-\)5.981 | \(-\)0.094 | \(-\)0.132 | 4.845 | \(-\)1.908 | \(-\)4.649 | \(-\)3.555 | \(-\)0.105 | \(-\)0.380 | 1.587 | \(-\)2.705 | |
| 2 | 0.328 | 1.346 | \(-\)0.072 | \(-\)0.474 | 5.126 | \(-\)0.279 | \(-\)5.909 | \(-\)3.058 | \(-\)0.123 | \(-\)0.147 | \(-\)0.345 | \(-\)3.935 | |
| E | 0 | \(-\)4.837 | 1.201 | \(-\)0.033 | 4.038 | 3.022 | 0.708 | 28.302 | \(-\)8.154 | 0.412 | 5.038 | \(-\)4.159 | \(-\)0.482 |
| 1 | \(-\)13.040 | 13.477 | \(-\)0.052 | 4.439 | 8.187 | \(-\)0.875 | 36.034 | 43.143 | 0.729 | 3.665 | \(-\)2.132 | 0.761 | |
| 2 | \(-\)5.492 | 10.805 | \(-\)0.261 | 5.047 | \(-\)8.401 | \(-\)0.144 | \(-\)3.275 | 3.286 | 0.354 | 1.836 | \(-\)3.593 | 0.868 | |
| A | ALL | \(-\)9.873 | 0.840 | \(-\)0.096 | \(-\)3.910 | \(-\)2.428 | \(-\)3.984 | \(-\)8.900 | \(-\)5.425 | \(-\)0.080 | \(-\)3.929 | \(-\)1.974 | \(-\)3.832 |
| B | ALL | \(-\)9.773 | \(-\)5.488 | 0.031 | \(-\)6.282 | 177.829 | \(-\)0.301 | 26.616 | 3.889 | \(-\)0.033 | \(-\)2.451 | \(-\)133.485 | 0.155 |
| C | ALL | \(-\)3.703 | \(-\)2.609 | \(-\)0.105 | \(-\)0.239 | 4.800 | \(-\)1.667 | \(-\)5.097 | \(-\)4.797 | \(-\)0.100 | 0.015 | 2.035 | \(-\)2.335 |
| E | ALL | \(-\)7.790 | 8.495 | \(-\)0.115 | 4.508 | 0.936 | \(-\)0.103 | 20.354 | 12.758 | 0.499 | 3.513 | \(-\)3.295 | 0.383 |
| Average | ALL | \(-\)7.785 | 0.309 | \(-\)0.071 | \(-\)1.481 | 45.284 | \(-\)1.514 | 8.243 | 1.606 | 0.071 | \(-\)0.713 | \(-\)34.180 | \(-\)1.407 |
| Task | Nut-tightening_tighten | Nut-tightening_return | |||||||||||
| Metric | \(\Delta\)FA | \(\Delta\)UA | \(\Delta\)JA | \(\Delta\)TA | \(\Delta\)FA_L | \(\Delta\)UA_L | \(\Delta\)FA | \(\Delta\)UA | \(\Delta\)JA | \(\Delta\)TA | \(\Delta\)FA_L | \(\Delta\)UA_L | |
| Worker | Segment | ||||||||||||
| A | 0 | 4.283 | \(-\)1.009 | 0.414 | 3.264 | 1.005 | 2.618 | 2.388 | \(-\)2.919 | 0.416 | 3.448 | 1.087 | 3.049 |
| 1 | 4.105 | \(-\)1.639 | 0.386 | 3.432 | 1.364 | 2.682 | 3.488 | \(-\)2.534 | 0.513 | 3.384 | 0.887 | 3.076 | |
| 2 | 3.254 | \(-\)0.909 | 0.411 | 3.709 | 1.412 | 3.044 | 4.278 | \(-\)1.509 | 0.583 | 3.415 | 0.937 | 3.113 | |
| B | 0 | 4.608 | \(-\)4.936 | \(-\)0.236 | \(-\)0.199 | 0.335 | \(-\)2.415 | 2.698 | \(-\)9.156 | 0.219 | \(-\)0.817 | 1.090 | \(-\)2.498 |
| 1 | 10.195 | \(-\)9.207 | \(-\)0.216 | \(-\)0.004 | 0.924 | \(-\)2.722 | \(-\)5.336 | \(-\)4.334 | 0.100 | \(-\)0.267 | 0.363 | \(-\)1.944 | |
| 2 | 10.625 | \(-\)9.206 | 0.035 | \(-\)0.779 | \(-\)0.452 | \(-\)3.486 | \(-\)6.278 | 1.079 | \(-\)0.031 | \(-\)0.223 | \(-\)0.440 | \(-\)1.845 | |
| C | 0 | \(-\)1.266 | \(-\)2.722 | 0.706 | \(-\)3.337 | \(-\)5.931 | \(-\)1.890 | \(-\)3.538 | 0.146 | 0.782 | \(-\)3.352 | \(-\)4.584 | \(-\)0.679 |
| 1 | \(-\)2.243 | \(-\)2.233 | 0.857 | \(-\)3.409 | \(-\)5.397 | \(-\)1.708 | \(-\)4.843 | \(-\)0.725 | 1.272 | \(-\)5.057 | \(-\)4.936 | \(-\)1.627 | |
| 2 | \(-\)4.770 | \(-\)0.647 | 0.814 | \(-\)2.602 | \(-\)4.729 | \(-\)0.789 | \(-\)3.768 | \(-\)2.115 | 0.877 | \(-\)4.028 | \(-\)5.007 | \(-\)2.100 | |
| D | 0 | 2.902 | \(-\)0.426 | 0.078 | 1.834 | 1.017 | 2.564 | 0.396 | \(-\)1.795 | 0.205 | 1.709 | 0.614 | 2.596 |
| 1 | 2.985 | \(-\)0.937 | 0.213 | 1.957 | 0.937 | 2.447 | 1.896 | \(-\)1.247 | 0.127 | 1.584 | 0.687 | 2.605 | |
| 2 | 2.196 | \(-\)1.940 | 0.213 | 1.903 | 0.646 | 2.460 | 3.262 | \(-\)1.177 | 0.104 | 1.669 | 0.832 | 2.762 | |
| A | ALL | 3.881 | \(-\)1.186 | 0.404 | 3.468 | 1.260 | 2.781 | 3.385 | \(-\)2.320 | 0.504 | 3.416 | 0.970 | 3.079 |
| B | ALL | 8.476 | \(-\)7.783 | \(-\)0.139 | \(-\)0.327 | 0.269 | \(-\)2.874 | \(-\)2.972 | \(-\)4.137 | 0.096 | \(-\)0.436 | 0.337 | \(-\)2.095 |
| C | ALL | \(-\)2.760 | \(-\)1.868 | 0.792 | \(-\)3.116 | \(-\)5.352 | \(-\)1.462 | \(-\)4.050 | \(-\)0.898 | 0.977 | \(-\)4.146 | \(-\)4.843 | \(-\)1.469 |
| D | ALL | 2.694 | \(-\)1.101 | 0.168 | 1.898 | 0.867 | 2.490 | 1.851 | \(-\)1.407 | 0.145 | 1.654 | 0.711 | 2.654 |
| Average | ALL | 3.073 | \(-\)2.984 | 0.306 | 0.481 | \(-\)0.739 | 0.234 | \(-\)0.446 | \(-\)2.191 | 0.430 | 0.122 | \(-\)0.706 | 0.542 |
| Task | Nut-tightening_tighten | Nut-tightening_return | |||||||||||
| Metric | \(\Delta\)FA | \(\Delta\)UA | \(\Delta\)JA | \(\Delta\)TA | \(\Delta\)FA_L | \(\Delta\)UA_L | \(\Delta\)FA | \(\Delta\)UA | \(\Delta\)JA | \(\Delta\)TA | \(\Delta\)FA_L | \(\Delta\)UA_L | |
| Worker | Segment | ||||||||||||
| A | 0 | 16.168 | 5.358 | \(-\)0.370 | \(-\)3.125 | \(-\)7.174 | \(-\)1.110 | 35.997 | 9.243 | \(-\)0.728 | \(-\)3.890 | \(-\)6.601 | \(-\)1.002 |
| 1 | 11.576 | 6.023 | \(-\)0.419 | \(-\)3.832 | \(-\)6.538 | \(-\)1.020 | 19.613 | 7.394 | \(-\)0.581 | \(-\)2.942 | \(-\)7.921 | \(-\)0.415 | |
| 2 | 14.643 | 2.145 | \(-\)0.388 | \(-\)4.578 | \(-\)7.022 | \(-\)0.848 | 16.796 | \(-\)0.088 | \(-\)0.459 | \(-\)2.371 | \(-\)6.921 | 0.194 | |
| B | 0 | \(-\)31.990 | \(-\)2.134 | \(-\)0.312 | \(-\)1.578 | 1.919 | \(-\)0.171 | 2.960 | \(-\)3.869 | \(-\)0.123 | \(-\)0.086 | 1.406 | \(-\)0.264 |
| 1 | \(-\)35.444 | \(-\)17.267 | \(-\)0.090 | \(-\)0.116 | 6.108 | 0.152 | \(-\)56.431 | 2.402 | \(-\)0.101 | 0.128 | 1.340 | \(-\)0.069 | |
| 2 | 35.399 | 12.186 | \(-\)0.055 | 0.782 | 9.272 | \(-\)0.138 | \(-\)54.837 | \(-\)9.280 | \(-\)0.118 | \(-\)0.149 | \(-\)0.654 | \(-\)0.572 | |
| C | 0 | \(-\)6.539 | 0.703 | \(-\)0.022 | \(-\)2.616 | 4.612 | \(-\)1.863 | \(-\)14.521 | \(-\)3.325 | \(-\)0.260 | 0.687 | 7.460 | \(-\)0.058 |
| 1 | \(-\)6.914 | \(-\)1.724 | \(-\)0.017 | \(-\)2.692 | 4.245 | \(-\)2.190 | 4.548 | 3.691 | 0.060 | 1.842 | 11.114 | \(-\)1.674 | |
| 2 | \(-\)6.384 | 0.802 | 0.006 | \(-\)2.668 | 4.483 | \(-\)2.019 | 2.532 | 0.174 | 0.114 | 0.491 | 10.629 | \(-\)1.891 | |
| D | 0 | \(-\)4.114 | 2.358 | \(-\)0.126 | \(-\)0.818 | 0.915 | 0.665 | \(-\)8.754 | \(-\)2.275 | \(-\)0.168 | \(-\)0.842 | 0.883 | 0.488 |
| 1 | \(-\)5.932 | \(-\)0.259 | \(-\)0.122 | \(-\)0.795 | 1.201 | 1.172 | \(-\)7.806 | 2.156 | \(-\)0.131 | \(-\)0.887 | 0.549 | 0.225 | |
| 2 | \(-\)5.487 | 0.980 | \(-\)0.142 | \(-\)0.792 | 1.213 | 0.847 | \(-\)5.096 | 0.960 | \(-\)0.147 | \(-\)1.001 | 0.557 | 0.131 | |
| A | ALL | 14.129 | 4.509 | \(-\)0.392 | \(-\)3.845 | \(-\)6.911 | \(-\)0.993 | 24.135 | 5.516 | \(-\)0.589 | \(-\)3.068 | \(-\)7.148 | \(-\)0.408 |
| B | ALL | \(-\)10.678 | \(-\)2.405 | \(-\)0.152 | \(-\)0.304 | 5.766 | \(-\)0.052 | \(-\)36.103 | \(-\)3.582 | \(-\)0.114 | \(-\)0.036 | 0.697 | \(-\)0.302 |
| C | ALL | \(-\)6.612 | \(-\)0.073 | \(-\)0.011 | \(-\)2.659 | 4.446 | \(-\)2.024 | \(-\)2.481 | 0.180 | \(-\)0.029 | 1.007 | 9.734 | \(-\)1.208 |
| D | ALL | \(-\)5.177 | 1.027 | \(-\)0.130 | \(-\)0.802 | 1.110 | 0.895 | \(-\)7.219 | 0.280 | \(-\)0.149 | \(-\)0.910 | 0.663 | 0.281 |
| Average | ALL | \(-\)2.085 | 0.764 | \(-\)0.171 | \(-\)1.902 | 1.103 | \(-\)0.544 | \(-\)5.417 | 0.599 | \(-\)0.220 | \(-\)0.752 | 0.987 | \(-\)0.409 |
3.2.1. Common Trends for Each Task in Both Tasks
Across both the disassembly (nut-loosening) and assembly (nut-tightening) tasks, several common learning-related trends were identified. For most workers, the variances showed a generally decreasing trend, suggesting that the workers increased their motion stability.
A key commonality in coordinated movements is the shift in right-arm usage. In both tasks, the mean upper arm angle (\(\Delta\)UA) consistently decreased (averaging \(-2.66 °\) for loosening and \(-2.98 °\) for tightening), while the forearm angle (\(\Delta\)FA) increased. This indicates a strategic transition in which workers reduce large shoulder-based movements and increase the contribution of forearm motion to improve task efficiency.
3.2.2. Characteristics of the Skilled Worker
Experienced worker A exhibited different tendencies between the loosening and tightening tasks during repetitive tasks. The analysis of the non-dominant (left) arm and trunk angles revealed distinct strategies employed by skilled worker A. Specifically, the left forearm angle (\(\Delta\)FA_L)—defined as the elbow flexion angle relative to the fully extended position (0°)—varied with task repetition. The mean angle decreased by 4.43° during loosening tasks and increased by 1.26° during tightening tasks, indicating that repetitive execution led to a more extended arm position during loosening and a more flexed position during tightening. This shift is likely associated with the direction of wrench operation: worker A appears to have used elbow extension when pulling the wrench from front to back during loosening and elbow flexion when pushing it from back to front during tightening to facilitate force application. However, the variance in \(\Delta\)FA_L decreased by 2.42 and 6.91 during loosening and tightening, respectively, suggesting that task repetition improved movement stability in both operations.
This tendency was not observed for workers B, C, D, and E.
3.3. PCA for Nut-Loosening and Nut-Tightening Tasks
To extract comprehensive motion patterns among the workers, PCA was performed using six joint angle features: forearm, upper arm, jaw, trunk, left forearm, and left upper arm. In this analysis, PCA was applied to the combined dataset, including all phases and segments of both the nut-loosening and nut-tightening tasks. This unified approach was adopted to construct a common low-dimensional feature space, enabling direct comparison of motion characteristics across tasks and phases under the same principal component axis.
The original six-dimensional joint angle data were compressed by PCA. Fig. 5 shows both the cumulative explained variance ratio and the corresponding eigenvalues for each principal component. The left vertical axis represents the cumulative explained variance ratio, right vertical axis indicates the eigenvalues, and horizontal axis represents the principal components from PC1 to PC6. The cumulative explained variance ratio reached approximately 64% with the first two principal components (PC1 and PC2) and increased to 94% with PC4, indicating that most of the variance in the joint angle data was preserved within the first four principal components.
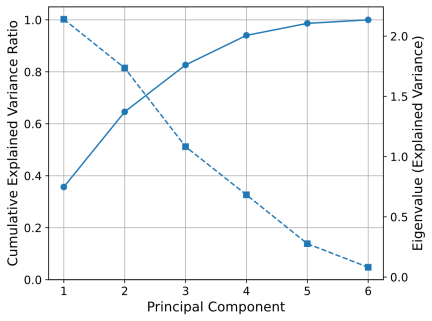
Fig. 5. Scree plot of cumulative contribution ratio from PCA for angular data (forearm, upper arm, jaw, trunk, left forearm, and left upper arm) in the nut-loosening and nut-tightening tasks for all workers.
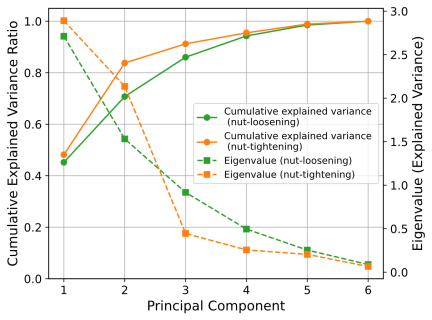
Fig. 6. Scree plots of cumulative contribution ratios from PCA for angular data (forearm, upper arm, jaw, trunk, left forearm, and left upper arm) in the nut-loosening and nut-tightening tasks analyzed separately for all workers.
To examine whether combining different task types reduced the explanatory efficiency of dimensionality reduction, PCA was performed separately for the nut-loosening and nut-tightening datasets (Fig. 6). In both tasks, the cumulative contribution ratio exceeded 90% for PC4. Although the cumulative contribution ratio of the unified PCA was lower than that of the task-specific PCAs for earlier principal components, it was comparable to that of PC4. This result suggests that the unified PCA framework can adequately represent both tasks when the first four principal components are considered while allowing the two tasks to be compared within a common principal component space.
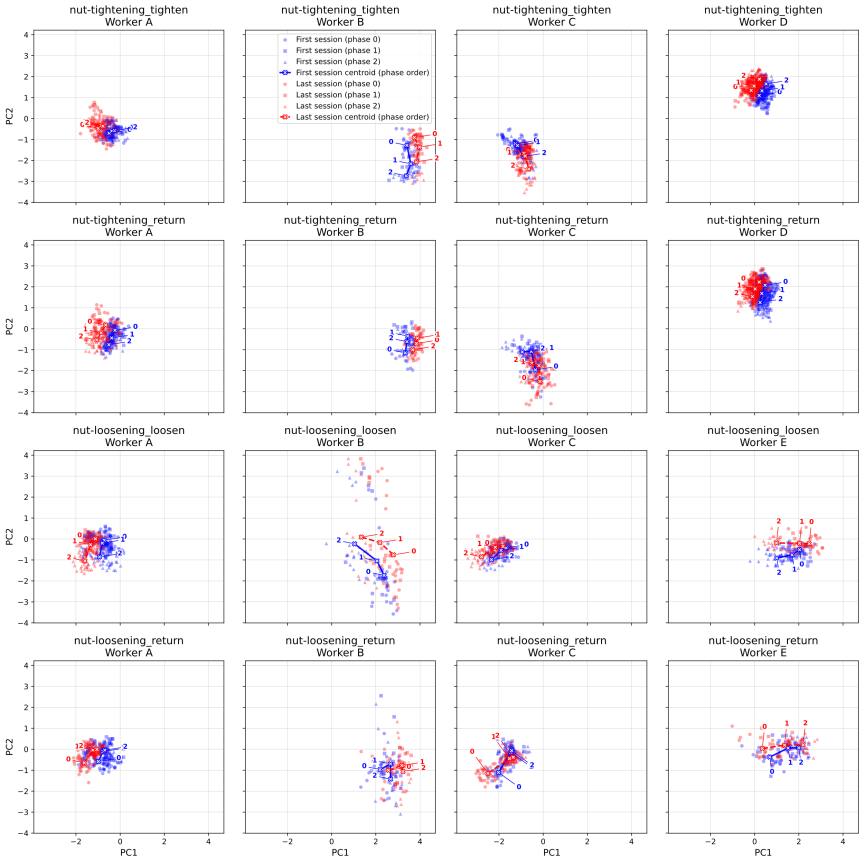
Fig. 7. Scatter plots of PC1 and PC2 for joint angle data of each worker during nut-loosening and nut-tightening tasks.
Figures 7 and 8 present the distributions of the first and second principal components (PC1 and PC2), and those of the third and fourth principal components (PC3 and PC4), respectively, for each worker during both the nut-loosening and nut-tightening tasks. In these figures, the first sessions (1st–10th trials) are shown in blue, whereas the last sessions (21st–30th trials) are shown in red. Different marker types denote the compressed task phases, and crosses indicate the centroids associated with each session. From top to bottom, the subplots depict the tightening and returning phases of the nut-tightening task, followed by loosening and returning phases of the nut-loosening task. The subplots are arranged from left to right for workers A, B, C, and E (and D in the nut-tightening task), resulting in a 4 \(\times\) 4 subplot configuration based on the task and workers.
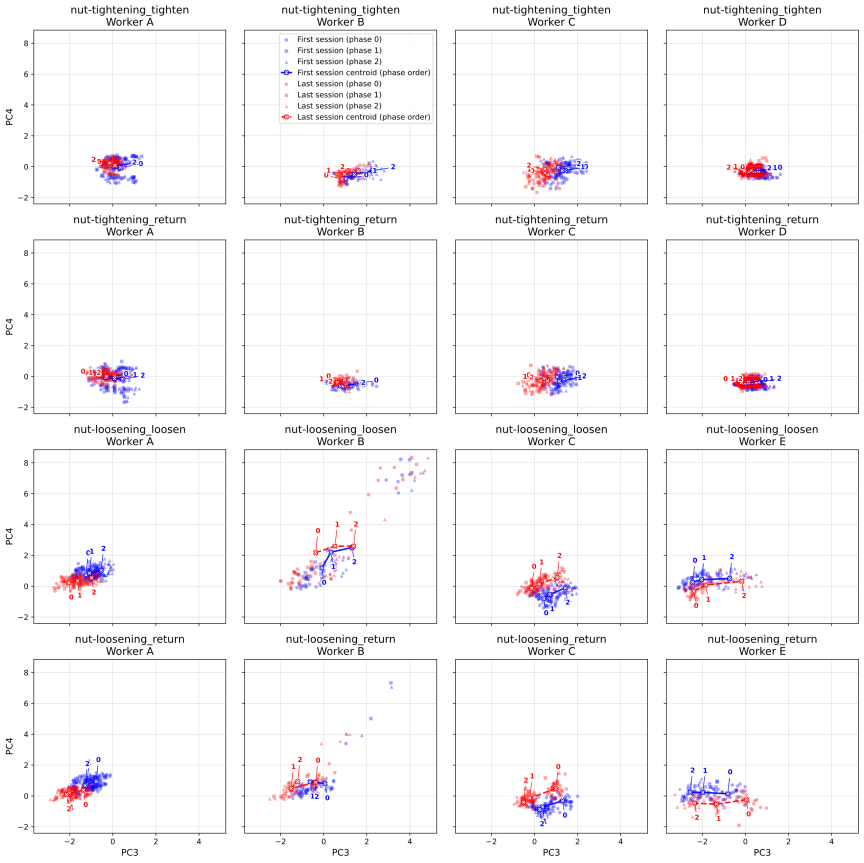
Fig. 8. Scatter plots of PC3 and PC4 for joint angle data of each worker during nut-loosening and nut-tightening tasks.
| Task_motion | Nut-loosening_loosen | Nut-loosening_return | |||||||
| Metric | PC1 | PC2 | PC3 | PC4 | PC1 | PC2 | PC3 | PC4 | |
| Worker | Segment | ||||||||
| A | 0 | \(-\)0.098 | \(-\)0.063 | \(-\)0.032 | \(-\)0.031 | \(-\)0.145 | 0.004 | \(-\)0.023 | \(-\)0.039 |
| 1 | \(-\)0.116 | \(-\)0.039 | \(-\)0.032 | \(-\)0.024 | \(-\)0.116 | \(-\)0.063 | \(-\)0.069 | \(-\)0.036 | |
| 2 | \(-\)0.144 | 0.019 | \(-\)0.015 | \(-\)0.040 | \(-\)0.105 | \(-\)0.042 | \(-\)0.027 | \(-\)0.027 | |
| B | 0 | \(-\)0.025 | 1.699 | 0.862 | 2.090 | 0.043 | \(-\)0.030 | 0.051 | \(-\)0.186 |
| 1 | \(-\)0.011 | 0.141 | 1.015 | 0.230 | \(-\)0.038 | \(-\)0.642 | \(-\)1.191 | \(-\)3.228 | |
| 2 | \(-\)0.126 | 1.042 | 0.751 | 1.950 | \(-\)0.061 | \(-\)0.551 | \(-\)0.108 | \(-\)1.339 | |
| C | 0 | \(-\)0.018 | \(-\)0.009 | \(-\)0.003 | \(-\)0.001 | 0.048 | \(-\)0.046 | \(-\)0.082 | 0.086 |
| 1 | 0.014 | \(-\)0.005 | \(-\)0.039 | 0.025 | \(-\)0.036 | \(-\)0.038 | \(-\)0.023 | 0.035 | |
| 2 | 0.058 | 0.013 | \(-\)0.043 | 0.060 | \(-\)0.045 | \(-\)0.032 | \(-\)0.035 | \(-\)0.010 | |
| E | 0 | 0.045 | 0.074 | \(-\)0.123 | 0.055 | 0.114 | 0.099 | \(-\)0.089 | \(-\)0.012 |
| 1 | 0.067 | 0.031 | 0.050 | 0.055 | 0.138 | 0.009 | 0.338 | 0.104 | |
| 2 | 0.057 | \(-\)0.016 | \(-\)0.139 | \(-\)0.059 | 0.018 | \(-\)0.020 | 0.133 | \(-\)0.045 | |
| WorkerAvg | A | \(-\)0.120 | \(-\)0.028 | \(-\)0.026 | \(-\)0.032 | \(-\)0.122 | \(-\)0.034 | \(-\)0.040 | \(-\)0.034 |
| B | \(-\)0.054 | 0.961 | 0.876 | 1.423 | \(-\)0.018 | \(-\)0.408 | \(-\)0.416 | \(-\)1.584 | |
| C | 0.018 | \(-\)0.000 | \(-\)0.028 | 0.028 | \(-\)0.011 | \(-\)0.039 | \(-\)0.046 | 0.037 | |
| E | 0.056 | 0.030 | \(-\)0.071 | 0.017 | 0.090 | 0.029 | 0.127 | 0.016 | |
| Average | \(-\)0.025 | 0.241 | 0.188 | 0.359 | \(-\)0.015 | \(-\)0.113 | \(-\)0.094 | \(-\)0.391 | |
| Task_motion | Nut-tightening_tighten | Nut-tightening_return | |||||||
| Metric | PC1 | PC2 | PC3 | PC4 | PC1 | PC2 | PC3 | PC4 | |
| Worker | Segment | ||||||||
| A | 0 | 0.057 | 0.121 | \(-\)0.127 | \(-\)0.215 | 0.082 | 0.129 | \(-\)0.125 | \(-\)0.309 |
| 1 | 0.046 | 0.124 | \(-\)0.133 | \(-\)0.226 | 0.085 | 0.058 | \(-\)0.086 | \(-\)0.290 | |
| 2 | 0.033 | 0.113 | \(-\)0.134 | \(-\)0.230 | 0.065 | 0.089 | \(-\)0.113 | \(-\)0.251 | |
| B | 0 | \(-\)0.022 | \(-\)0.138 | \(-\)0.065 | 0.024 | \(-\)0.068 | 0.167 | \(-\)0.179 | 0.011 |
| 1 | \(-\)0.090 | 0.022 | \(-\)0.108 | 0.002 | \(-\)0.022 | \(-\)0.124 | \(-\)0.032 | 0.006 | |
| 2 | \(-\)0.041 | 0.393 | 0.040 | \(-\)0.002 | \(-\)0.020 | \(-\)0.162 | \(-\)0.135 | \(-\)0.014 | |
| C | 0 | \(-\)0.084 | 0.056 | \(-\)0.049 | 0.043 | 0.019 | 0.044 | \(-\)0.029 | \(-\)0.066 |
| 1 | \(-\)0.104 | 0.062 | \(-\)0.050 | 0.008 | \(-\)0.027 | 0.163 | 0.011 | 0.063 | |
| 2 | \(-\)0.073 | 0.078 | \(-\)0.054 | \(-\)0.008 | \(-\)0.059 | 0.120 | 0.044 | 0.076 | |
| D | 0 | 0.013 | \(-\)0.028 | \(-\)0.039 | 0.017 | 0.007 | \(-\)0.053 | \(-\)0.033 | 0.008 |
| 1 | 0.020 | \(-\)0.050 | \(-\)0.033 | 0.023 | 0.010 | \(-\)0.049 | \(-\)0.021 | 0.008 | |
| 2 | 0.016 | \(-\)0.038 | \(-\)0.035 | 0.018 | 0.003 | \(-\)0.046 | \(-\)0.035 | 0.004 | |
| WorkerAvg | A | 0.046 | 0.119 | \(-\)0.131 | \(-\)0.224 | 0.077 | 0.092 | \(-\)0.108 | \(-\)0.283 |
| B | \(-\)0.051 | 0.092 | \(-\)0.044 | 0.008 | \(-\)0.037 | \(-\)0.040 | \(-\)0.115 | 0.001 | |
| C | \(-\)0.087 | 0.065 | \(-\)0.051 | 0.014 | \(-\)0.022 | 0.109 | 0.009 | 0.024 | |
| D | 0.016 | \(-\)0.039 | \(-\)0.036 | 0.020 | 0.007 | \(-\)0.049 | \(-\)0.030 | 0.007 | |
| Average | \(-\)0.019 | 0.060 | \(-\)0.066 | \(-\)0.045 | 0.006 | 0.028 | \(-\)0.061 | \(-\)0.063 | |
As shown in Fig. 7, although the loosening and tightening tasks involved different movements, as reflected in the differences in the centroid shift, the PC1–PC2 distributions were similar for skilled worker A, indicating comparable joint angle patterns across the six joint angles. In contrast, worker B exhibited a wider distribution of principal component scores, particularly along PC2, in both phases of the nut-loosening task. Compared to novice worker B, skilled worker A exhibited smaller variations in PC1 and PC2 values, indicating more stable joint angle patterns across trials, regardless of whether the phase was operation or returning. This tendency was particularly evident in the nut-loosening task. Thus, these findings imply that for novice workers, stabilizing motion patterns might be more challenging in the nut-loosening task than in the nut-tightening task.
As shown in Fig. 8, in the nut-tightening task, no significant differences were observed between the first and last sessions or among workers, indicating limited changes in PC3 and PC4. However, in both phases of the nut-loosening task, the centroids in the last session tended to shift in the negative direction of PC3. Regarding PC4, the direction of the centroid shift differed among workers. A shift in the negative direction was observed for skilled worker A, whereas shifts in the positive direction were observed for novice workers B and C.
To evaluate the changes associated with repeated task execution, the first (1st–10th trials) and last sessions (21st–30th trials) were compared. Tables 6 and 7 present the changes in principal component variance between the last and first sessions (δ = Last − First) for nut-loosening and nut-tightening tasks, with operation and returning phases shown side by side. The columns show the variances of the individual principal components (PC1–PC4), whereas the rows represent workers, task segments, worker-wise averages, and the overall average.
As shown in Tables 6 and 7, the rows are organized by worker and motion segments, whereas the columns are organized by task and principal components (PC1–PC4). During the return motion of the nut-loosening task, the changes in the PCA variance were negative for all four principal components, indicating a consistent reduction in variance. During the return motion of the nut-tightening task, the PCA variance increased slightly for PC1 and PC2, but decreased for PC3 and PC4, suggesting a weaker tendency toward reduced PCA variance.
To facilitate the interpretation of each principal component, the principal component loadings were examined to identify the joint angles that contributed the most strongly to each component, as shown in Fig. 9. As shown in Fig. 9, PC1 exhibits negative loadings for the trunk, upper arm, forearm, and jaw angles. Therefore, a shift of PC1 scores toward the negative direction corresponds to an overall increase in these joint angles. As shown in Fig. 7, for skilled worker A, the PC1 scores gradually shifted toward the negative direction with repetition in both the nut-loosening and nut-tightening tasks. This suggests that repeated tasks could lead to a posture characterized by greater trunk flexion and movement of the upper limb.
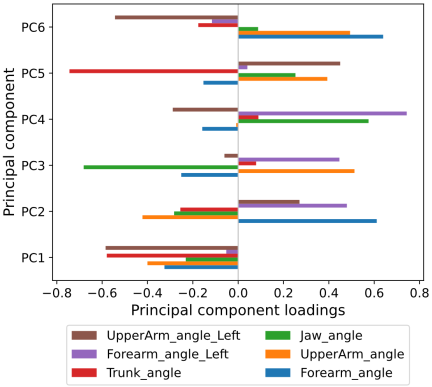
Fig. 9. Principal component loadings for PC1 to PC6 on angular data.
PC2 showed positive loadings for both forearm angles and negative loadings for the upper arm and jaw angles. As shown in Fig. 7, workers A, B, and D exhibited a shift of PC2 scores toward the positive direction owing to task repetition in the nut-tightening task. This result suggests that workers bend their elbows to move their forearms more freely with repeated nut-tightening tasks.
Furthermore, PC3 showed positive loadings for the upper arm and left forearm angles and negative loadings for the jaw and right forearm angles. As shown in Fig. 8, for skilled worker A and novice workers B and C, the PC3 scores shifted toward the negative direction with task repetition in the nut-loosening task. Thus, this result suggests that, while reducing the upper arm and left forearm angles, workers tend to lean forward and move the dominant hands holding the wrench more extensively. Finally, PC4 is interpreted as a task-specific fine component that becomes fixed during the nut-tightening task but varies across individuals during the nut-loosening task.
4. Discussion
This study analyzed the postural changes during repetitive nut-loosening and nut-tightening tasks using joint angle statistics and PCA. The RULA GS showed little variation across the trials in either task (RQ1), suggesting that it was not sufficiently sensitive to capture the subtle changes associated with task repetition. By contrast, the joint-angle statistics and PCA suggested that repeated task execution was accompanied by both shared and task-specific changes in movement patterns. Most joint angles tended to increase across tasks and phases, whereas the upper-arm angle showed a consistent decreasing trend in both the nut-loosening and nut-tightening tasks (RQ2). These findings suggest that repeated task execution may be associated with gradual changes in the upper-body movement patterns, although such changes were not adequately reflected in the RULA GS. Variability analysis further identified changes associated with task repetition. In particular, variance in trunk and jaw angles tended to decrease as the task was repeated, suggesting greater consistency in upper-body and neck movements across trials. This decrease in variability may reflect improved movement stability but does not necessarily imply that the resulting posture was ergonomically optimal.
The PCA results provided a more integrated view of the postural and coordination changes associated with task repetition (RQ3). Across both nut-loosening and nut-tightening tasks, PC1 tended to shift in the negative direction from the first to the last ten trials, suggesting the presence of a shared adaptation pattern across the tasks. Simultaneously, task-specific differences were also observed; the nut-tightening task showed a positive shift, mainly along PC2, whereas the nut-loosening task showed a negative shift, mainly along PC3. These results suggest that, alongside a shared pattern of adaptation across tasks, each task may elicit distinct changes in movement coordination associated with its specific operational demands. In this context, PCA appeared useful not only for characterizing the overall stabilization associated with repeated task performance but also for distinguishing task-specific movement patterns that were less readily discernible from the RULA GS.
Interpretation of the principal components also helps explain how movement patterns change with task repetition. PC1 may represent a common adaptation across tasks and phases because the negative shift of PC1 observed with repetition corresponds to an overall increase in the trunk, upper arm, forearm, and jaw angles. This pattern appears to be consistent with an ergonomic interpretation, in which adopting a more forward-leaning posture to engage the entire upper body is rational for tasks requiring physical force. PC2 may reflect task-specific changes observed mainly in the nut-tightening task. Because PC2 had positive loadings for the forearm angles and negative loadings for the upper arm and jaw angles, the positive shift in PC2 with repetition corresponded to increased elbow flexion and greater forearm movement. This pattern also appears to be consistent with an ergonomic interpretation, in which bringing the upper body closer to the center of rotation may help stabilize the operation. PC3, by contrast, appeared to capture task-specific changes in the nut-loosening task. Because PC3 had positive loadings for the upper arm and left forearm angles and negative loadings for the jaw and right forearm angles, the negative shift in PC3 corresponded to reduced upper arm and left forearm angles, together with greater trunk involvement and increased movement of the dominant forearm. This pattern also appears consistent with an ergonomic interpretation in which the worker uses the left arm to stabilize the equipment while exerting force on the wrench with the dominant forearm. These findings suggest that, although the two tasks shared some learning-related changes, each may also have required a distinct coordination strategy. The RULA GS exhibited limited variability across trials in both tasks. This limited variability may reflect the discretization and rounding used to calculate the GS, which can obscure subtle changes in joint-angle behavior. In practical settings, the RULA is often used as a screening or alert tool for identifying high-risk postures rather than as a sensitive measure for detecting gradual improvements in movement with task repetition. The present results suggest that although RULA remains useful for coarse ergonomic assessment, joint-angle statistics and PCA may provide a more informative description of learning-related changes in repetitive manual tasks. In addition, the current approximation of the trunk angle may have further reduced the sensitivity of the RULA GS.
5. Conclusion
This study compared learning-related postural changes during repetitive nut-loosening and nut-tightening tasks within a common analytical framework using joint-angle statistics, RULA, and PCA. The main contribution of this study is that it demonstrates that the two tasks share learning-related features and exhibit distinct task-specific coordination patterns. Furthermore, this study dealt with simple tasks such as nut‑tightening and nut‑loosening. These operations have limited room for decision-making, because the manner in which these tasks operate is almost identical. This study is expected to be applied to more complex and composite operations where larger differences between experienced and inexperienced workers naturally emerge, because it can detect skill differences even in such simple tasks.
These findings suggest that proficiency in repetitive manual tasks may be reflected in subtle changes in interjoint coordination. The present study advances the comparison of disassembly and assembly tasks by demonstrating that nut-loosening and nut-tightening exhibit both shared learning-related features and distinct task-specific patterns. These findings may provide useful insights for the assessment of novice proficiency and the design of task-specific training in manual assembly and disassembly tasks.
This study was limited by the sample size, current marker configuration, and the coarse nature of the RULA GS. Future studies should examine a wider range of tasks and more practical measurement and evaluation methods. In addition, an experienced worker was compared with several novices to assess learning effects. A limitation of this study is that only one experienced worker participated, precluding an evaluation of variability among experienced workers; consequently, the observed characteristics may reflect individual-specific features. Furthermore, because skill levels vary among workers, the availability of data from experienced workers may not necessarily improve transmission accuracy. Therefore, future studies should include multiple workers with diverse levels of expertise.
Acknowledgments
This research was supported by the Japan Society for the Promotion of Science (JSPS), KAKENHI, Grants-in-Aid for Scientific Research (B), JP23K26329, from 2023 to 2027, for Scientific Research (C), JP26K07911, from 2026 to 2029, and for Challenging Research (Exploratory), JP25K22140, from 2025 to 2028.
- [1] Organisation for Economic Co-operation and Development, “OECD Supply Chain Resilience Review: Navigating Risks,” OECD Publishing, 2025. https://doi.org/10.1787/94e3a8ea-en
- [2] P. Stavropoulos, A. Papacharalampopoulos, K. Tzimanis, and A. Lianos, “Manufacturing resilience during the coronavirus pandemic: On the investigation manufacturing processes agility,” Eur. J. Soc. Impact Circ. Econ., Vol.1, No.3, pp. 28-57, 2020. https://doi.org/10.13135/2704-9906/5073
- [3] M. Song, M. A. Nasir, and W. B. Arfi, “Geopolitical risk implications for natural resource governance and conflict resolution,” Resour. Policy, Vol.93, Article No.105079, 2024. https://doi.org/10.1016/j.resourpol.2024.105079
- [4] A. Rejeb, K. Rejeb, J. G. Keogh, and E. Süle, “When Industry 5.0 meets the circular economy: A systematic literature review,” Circ. Econ. Sustain., Vol.5, pp. 2621-2652, 2025. https://doi.org/10.1007/s43615-025-00570-y
- [5] A. J. D. Lambert and S. M. Gupta, “Disassembly Modeling for Assembly, Maintenance, Reuse and Recycling,” CRC Press, 2005.
- [6] G. Salvendy (Ed.), “Handbook of Industrial Engineering,” 2nd Ed., John Wiley & Sons, 1992.
- [7] K. Karube, T. Yamada, and M. Sugi, “DX visualization of assembly task speed by 3D coordinate data using motion capture,” Proc. Northeast Decis. Sci. Inst. 53rd Annu. Conf., pp. 82-89, 2024.
- [8] C. Saeki, Y. Kubo, M. Suga, H. Egusa, and A. Ohta, “Development and realization of system for passing down skills and techniques on digital motion analysis,” Mazda Technical Review, Vol.38, pp. 127-132, 2021 (in Japanese). https://doi.org/10.34338/mazdagihou.38.0_127
- [9] S. Sato, H. Tanaka, and M. Yamamoto, “Multiple regressive analysis of skillful polishing operation of aircraft wings,” IEEJ Trans. Electron. Inf. Syst, Vol.137, No.7, pp. 948-956, 2017 (in Japanese). https://doi.org/10.1541/ieejeiss.137.948
- [10] R. Kawane, K. Karube, M. Sugi, T. Nakada, and T. Yamada, “Assembly movement analysis by work classification using motion capture and machine learning,” Int. J. Automation Technol., Vol.19, No.4, pp. 678-690, 2025. https://doi.org/10.20965/ijat.2025.p0678
- [11] T. Hayashi, K. Harada, K. Karube, M. Sugi, and T. Yamada, “Unveiling key movements in disassembly task through motion capture analysis and machine learning,” Asian J. Manag. Sci. Appl. (in press).
- [12] T. Hayashi, K. Harada, K. Karube, M. Kakehi, M. Sugi, and T. Yamada, “Comparison of motion study and data science methods for proficiency in disassembly task movement via motion capture,” Int. J. Adv. Manuf. Technol., Vol.146, pp. 1629-1646, 2026. https://doi.org/10.1007/s00170-025-17189-w
- [13] L. McAtamney and E. N. Corlett, “RULA: A survey method for the investigation of work-related upper limb disorders,” Appl. Ergon., Vol.24, No.2, pp. 91-99, 1993. https://doi.org/10.1016/0003-6870(93)90080-S
- [14] I. Sabino et al., “Application of wearable technology for the ergonomic risk assessment of healthcare professionals: A systematic literature review,” Int. J. Ind. Ergon., Vol.100, Article No.103570, 2024. https://doi.org/10.1016/j.ergon.2024.103570
- [15] T. Prunet, N. Absi, V. Borodin, and D. Cattaruzza, “Optimization of human-aware logistics and manufacturing systems: A survey on the human-aware models,” EURO J. Transp. Logist., Vol.13, Article No.100137, 2024. https://doi.org/10.1016/j.ejtl.2024.100137
- [16] D. A. Madani and A. Dababneh, “Rapid entire body assessment: A literature review,” Am. J. Eng. Appl. Sci., Vol.9, No.1, pp. 107-118, 2016. https://doi.org/10.3844/ajeassp.2016.107.118
- [17] B. J. Baird, M. A. Tynan, L. F. Tracy, J. T. Heaton, and J. A. Burns, “Surgeon positioning during awake laryngeal surgery: An ergonomic analysis,” Laryngoscope, Vol.131, No.12, pp. 2752-2758, 2021. https://doi.org/10.1002/lary.29717
- [18] S. Y. Nof, W. E. Wilhelm, and H. Warnecke, “Industrial Assembly,” Springer, 1997.
- [19] nac Image Technology, “MAC3D System,” (in Japanese). https://www.nacinc.jp/analysis/motion-capture/mac3d-system/ [Accessed January 26, 2026]
- [20] W. F. Senjaya, B. N. Yahya, and S. L. Lee, “Sensor-based motion tracking system evaluation for RULA in assembly task,” Sensors, Vol.22, No.22, Article No.8898, 2022. https://doi.org/10.3390/s22228898
- [21] SciPy Documentation, “scipy.signal.find_peaks – SciPy v1.x Manual.” https://docs.scipy.org/doc/scipy/reference/generated/scipy.signal.find_peaks.html [Accessed January 26, 2026]
Appendix
Appendix A. Details of the Segmentation Procedure
This appendix provides the technical details of the motion segmentation algorithm used in Section 2.3. The following procedure was implemented to ensure the precise identification of “operation” and “returning” phases for both assembly and disassembly tasks.
To extract these phases, the time-series position data of marker No. 6, representing the position of the right wrist, as shown in Fig. 2, were smoothed using a moving average to reduce the influence of noise. Peaks (maxima) and valleys (minima) were detected using scipy.signal.find_peaks 21. Specifically, after observing the workers’ motions by the analyst, peak/valley detection was performed using either the \(y\)- or \(x\)-axis coordinates of marker No. 6, depending on the trial. This is because even for the same worker, the direction in which the motion turns back can differ across trials. Therefore, selecting the axis that best captures the turning behavior enables the flexible detection of stroke boundaries. Valleys were identified by applying the same peak-detection method to an inverted smoothed signal. Fig. 10 illustrates an example of the peak and valley detection applied to the smoothed feature signal, where the red and green markers indicate the detected peaks and valleys, respectively. A clear alternation of the peaks and valleys shown in Fig. 10 indicates that the proposed smoothing and detection procedure achieved satisfactory segmentation results for the target trial. As a representative example, the figure shows the temporal variation in the \(y\)-axis coordinates of marker No. 6 during the nut-tightening task in the 7th trial performed by skilled worker A.
Figure 11 shows the same trial as Fig. 10 projected onto the \(XY\)-plane, illustrating the planar trajectory of marker No. 6 and providing an intuitive view of how the detected stroke structure is reflected in the spatial motion pattern.
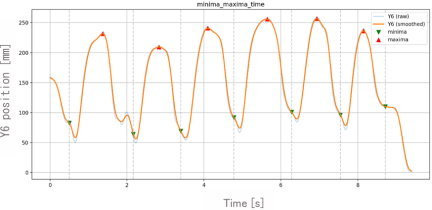
Fig. 10. Detection of peaks and valleys for skilled worker A during the nut-tightening task in the 7th trial.
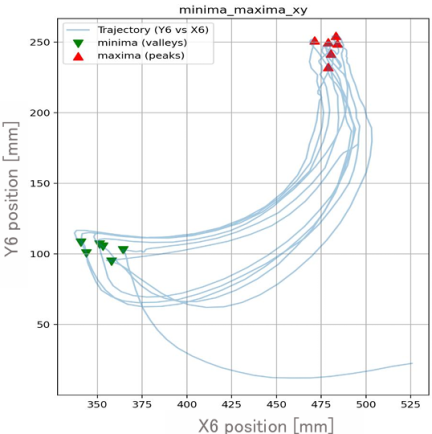
Fig. 11. \(XY\)-plane trajectory of the segmented motion for worker A during the nut-tightening task in the 7th trial.
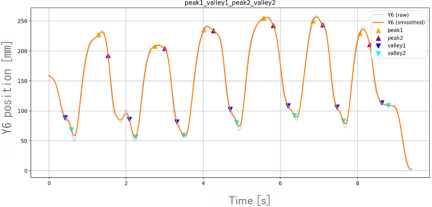
Fig. 12. Phase boundary definition for worker A during the nut-tightening task in the 7th trial. An example where satisfactory segmentation was achieved by boundary points.
Using the detected peaks and valleys directly as phase boundaries could potentially include movements, such as attaching the wrench to the nut or detaching it from the nut. Therefore, in this study, the front and rear widths were manually set for each detected peak and valley, and these were used to determine the reference points for segmenting the operation and returning phases. Fig. 12 shows the boundary points obtained by shifting the detected peaks (red) and valleys (green) according to the specified pre- and post-widths. These boundary points are used to segment the operation and returning phases. The boundary points defined by the front and rear widths of the peaks are denoted as peak1 and peak2, respectively, and those of the valleys are denoted as valley1 and valley2. In the example illustrated in Fig. 12, which corresponds to the nut-tightening task, the interval from peak2 to valley1 represents the tightening phase, and that from valley2 to the subsequent peak1 corresponds to the returning phase. Fig. 13 presents the motions corresponding to Fig. 12 projected onto the \(XY\)-plane to visualize the spatial characteristics of the segmented operation and returning phases.
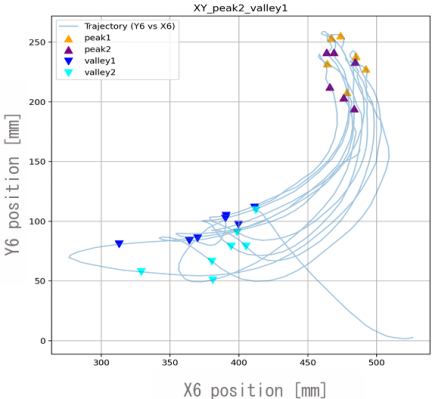
Fig. 13. \(XY\)-plane trajectory of the segmented motion for worker A during the nut-tightening task in the 7th trial.
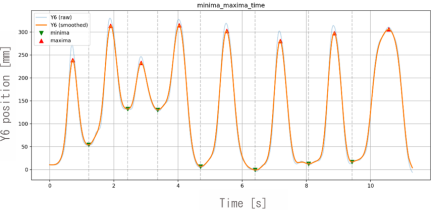
Fig. 14. Example of re-tightening motion detected in worker A during the nut-tightening task in the 5th trial.
Figure 14 shows the temporal variation in the \(y\)-axis coordinates of marker No. 6 when skilled worker A performed the 5th trial of the nut-tightening task. In the time interval from 2 to 4 s, multiple peaks and valleys were detected, indicating that re-tightening occurred because of insufficient fastening. In such cases, the operation was considered incomplete within a single stroke and the corresponding data were excluded from the analysis. The same exclusion criteria were applied in the nut-loosening task.
The hyperparameters manipulated by the analyst during the segmentation procedure are presented, and their roles are described as follows:
-
(1)
Coordinate-axis selection parameters
These parameters determine the coordinate axes used for the peak and valley detection. Selections are made by observing motion patterns to accommodate trial-to-trial differences in movement direction.
-
(2)
Smoothing window parameters
These parameters control the extent of the moving average smoothing window applied to the time-series data. They balance noise reduction and temporal resolution in peak and valley detection.
-
(3)
Minimum distance parameters for peak and valley detection
These parameters define the minimum allowable distance between successive peaks or valleys to prevent over-detection caused by small noise within a single stroke.
-
(4)
Prominence parameters for peaks and valleys
These parameters specify the required prominence of the peaks and valleys relative to the surrounding signal variations, enabling the exclusion of noise-induced local extrema.
-
(5)
Boundary width parameters for phase segmentation
These parameters define the front and rear widths applied to the detected peaks and valleys to set flexible segmentation boundaries, while excluding auxiliary motions.
The smoothing width and front and rear widths around the peaks and valleys were manually adjusted based on visual inspection of the signal waveforms and segmentation results, as shown in Figs. 10 and 13. Consequently, parameter selection involves a certain degree of subjectivity.
This article is published under a Creative Commons Attribution-NoDerivatives 4.0 Internationa License.