
Research Paper:
Effect of Machine Cover on Thermal Behavior of a Turning Center Under Environmental Temperature Changes
Koji Ota*,† and Daisuke Kono**
*DMG MORI Co., Ltd.
2-3-23 Shiomi, Koto-ku, Tokyo 135-0052, Japan
†Corresponding author
**Graduate School of Engineering, Kyoto University
Kyoto, Japan

Environmental temperature changes are a major factor in machining accuracy degradation in machine tools. As maintaining a constant environmental temperature is costly, reducing thermal deformation through machine design is important. For this purpose, it is essential to clarify the mechanisms of thermal deformation caused by environmental temperature variations. In recent years, machine tools have increasingly been required to incorporate covers for chip and coolant management as well as compliance with safety regulations. However, covers influence the heat transfer between the machine and the environment and complicate the mechanism of thermal deformation. In this study, the influence of covers on the heat transfer and thermal displacement of a turning center was investigated. The relationship between thermal displacement and temperature variations in the ambient air and machine structure was examined for different cover configurations under environmental temperature variations. Experimental results demonstrated that, while the influence of environmental temperature changes was suppressed by the machine outer cover, the temperature difference of the air within the machine outer cover increased due to the mechanical configuration, resulting in thermal deformation. Additional covers suppressed the temperature rise of the air around the structure and the structure itself, but the temperature distribution of the air and the structure was not improved, and thermal deformation was not reduced. Simulation results showed that the heat transfer rate from the air to the structure was reduced by 20% with additional covers. These results indicate that thermally robust machine tools under environmental temperature changes can be developed by appropriately designing the arrangement of covers.
1. Introduction
The demand for high-precision machine tools is increasing owing to the growing adoption of process integration through five-axis and multi-tasking machine tools, as well as advances in automation. Thermal displacement is a major factor in the degradation of machining accuracy of machine tools 1,2. It is essential to clearly understand the mechanism of thermal displacement to design high-precision machine tools by reducing thermal displacements.
The generation mechanism of thermal displacement is as follows. First, heat is introduced into the structure from the heat source. Subsequently, a temperature distribution was developed within the structure. Finally, the temperature distribution leads to thermal deformation of the structure, resulting in a relative displacement between the tool center point and the workpiece.
Many heat sources contribute to thermal displacement, both inside the machine and in the installation environment. Changes in environmental temperature are among the primary contributing heat sources. Environmental temperature variation depends on the installation environment and operating conditions of the machine, and the magnitude and pattern of the temperature change may vary from machine to machine. Environmental temperature changes can be a major factor in machining accuracy degradation depending on the specific machine configuration.
Temperature changes within the structure due to environmental temperature changes occur through heat transfer between the structure and the surrounding air around the structure. In recent years, it has become increasingly necessary for machine tools to install covers for chip treatment, coolant treatment, and compliance with safety standards 3,4,5. The cover affects the airflow around the machine, resulting in changes in the heat transfer between the air and structure. Thus, the generation process of thermal displacement owing to environmental temperature changes is becoming increasingly complex and difficult to predict. In order to reduce thermal displacement due to environmental temperature changes, it is generally desirable to install the machine in a temperature- controlled space where the environmental temperature is maintained at 20 °C 6. However, maintaining a controlled environment by using air-conditioning systems is expensive. Moreover, dedicated air-conditioning systems are rarely introduced, even when new machine tools are installed. Therefore, clarifying the mechanism of thermal displacement caused by environmental temperature changes and developing methods to reduce it are essential for designing machine tools that maintain high precision, regardless of the installation environment.
Several studies have investigated the characteristics of machine tools under changes in environmental temperature. Iñigo et al. 7 conducted an analytical study on the behavior of a machining center and reported that positional dependency exists in the thermal displacement. Egaña et al. 8 experimentally analyzed the volumetric thermal displacement behavior under varying environmental temperature conditions. Mayr et al. 9 developed thermal frequency response analysis methods to evaluate the machine behavior in response to temperature change frequency. Hernández-Becerro et al. 10 proposed a reduced-order finite element method (FEM) model to efficiently evaluate machine behavior under environmental temperature variations. Although these studies clarified the behavior of machines in response to environmental temperature changes, further efforts are required to propose specific measures to suppress thermal deformation.
To analyze thermal displacement under environmental temperature variations, changes in the air temperature around the structure and the heat transfer coefficient (HTC) between the environment and structure are important factors. Neugebauer et al. 11 incorporated an adaptive HTC into transient heat transfer analyses and demonstrated that the accuracy of ambient air temperature measurements influences the analytical reliability. Uhlmann and Hu 12 developed a model that accounted for variations in the HTC of a structural surface owing to various feed rates. Glänzel et al. 13 proposed an efficient method for determining the HTC values in transient analyses using characteristic diagrams that clustered the HTCs obtained using computational fluid dynamics. Although these studies provide robust methods for estimating the HTC, the details of ambient air temperature changes remain insufficiently addressed. To control the heat transfer between the structure and air, it is essential to design both the HTC and the ambient air temperature.
Several studies have been conducted to mitigate thermal displacement under environmental temperature changes. Mayr et al. 9 demonstrated through thermal frequency response analysis that the thermal displacement can be reduced by lowering the HTC at the machine surfaces. Fujishima et al. 14 demonstrated that the thermal displacement in a turning center can be reduced by adjusting the temperature distribution within the structure using FEM-based thermal sensitivity analysis. Irino et al. 15 compensated for the thermal displacement in a machining center using a reduced-order FEM model that incorporated data from four room ambient temperature sensors. Although these studies have successfully reduced the thermal displacement, a design methodology based on the underlying mechanism of heat transfer from the ambient air to the structure has yet to be established.
The authors 16 investigated the heat capacity distribution of a structure to achieve a more uniform temperature distribution in the bed of a turning center. Consequently, thermal displacement was reduced by balancing the heat inflow from the air using a fan.
However, these studies did not address the influence of machine tool covers on thermal displacement under environmental temperature changes. Although Jędrzejewski et al. 17 reported that thermal displacement varies depending on the headstock cover of the lathe and the cover of the workspace, a detailed analysis remains unclear. Tanabe et al. 18,19 modeled the increase in air temperature inside a machine cover caused by internal heat sources. They also demonstrated that the thermal displacement of a CNC lathe induced by an air temperature change inside the cover could be predicted using the developed model. They further designed a bench lathe with a thermally insensitive structure against the increase in air temperature inside the cover caused by internal heat sources, and showed that the machine cover suppressed thermal displacement. However, their model considered only the internal heat sources inside the machine cover and did not incorporate changes in the air temperature caused by environmental temperature changes.
Studies 17,18,19 have reported that thermal displacement is affected by the air inside the cover and can be suppressed by the cover configuration. However, the effect of the cover on thermal displacement under environmental temperature changes requires further investigation. Pavliček et al. 20 simulated the airflow inside a machine enclosure covering the machining workspace, taking into account internal heat sources and radiation within the machining workspace. The simulation results indicated the formation of two air circulation patterns caused by the internal machine structure. Although their simulation was limited to the machining workspace, the results suggested that structural modifications can influence the airflow and temperature variations around the structure. Therefore, systematic investigations into the influence of machine tool covers on heat transfer between the structure and ambient air under varying environmental temperatures have led to the development of design methods for thermally robust machine tools under environmental temperature variations.
In this study, when a cover was added to the turning center, the relationship between the temperature variation of the air around the structure and the thermal displacement under environmental temperature changes was examined. The effects of covers on the temperature distribution and displacement of the structure were experimentally investigated using a cover directly attached to the machine structure and an additional cover that extended the original outer cover of the machine. Moreover, the HTC was numerically estimated using a simulation, and the change in the heat transfer rate was analyzed using the identified HTC.
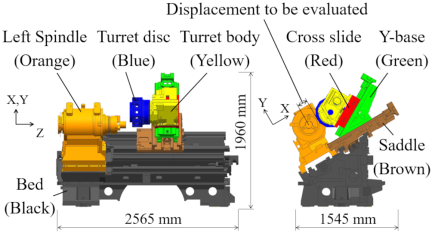
Fig. 1. Schematic of the turning center structure.
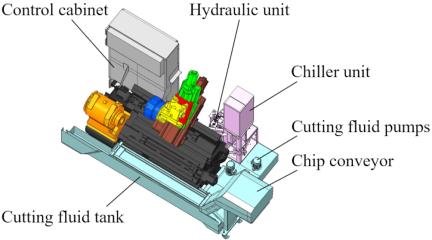
Fig. 2. Configuration of peripheral units.
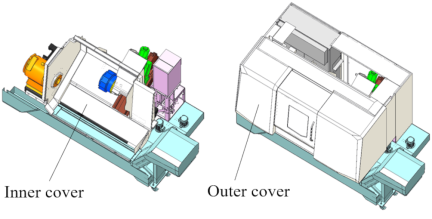
Fig. 3. Cover structure.
2. Experimental Method
In the experiment, a turning center installed in a temperature-controlled chamber environment was employed. The temperature distribution and thermal displacement of the machine were measured during the environmental temperature variations for different cover arrangements. Fig. 1 shows the machine structure, and Fig. 2 shows the arrangement of the peripheral equipment. The control cabinet, hydraulic unit, and chiller for spindle motor cooling were mounted using brackets on the rear side of the machine structure. An L-shaped tank for cutting fluid was installed, extending from the front of the machine to the right side. A chip conveyor was mounted on the front side of the tank. Pumps for the cutting fluid were mounted on the upper-right side of the tank assembly.
Figure 3 shows the cover configuration. Covers are generally classified into two main types: (1) covers that prevent chips and cutting fluid from being scattered outside the machine (hereinafter referred to as inner covers), and (2) covers that prevent the operator from contacting the moving components of the machine or prevent equipment failure due to the ingress of foreign objects (hereinafter referred to as outer covers). Fig. 4 presents an overview of the additional covers. A cast hole cover was attached to the bed to prevent air from entering the machine structure directly. The bed lower cover was attached to reduce heat transfer between the machine structure and the surrounding ambient air. The right and back outer covers were attached to the bottom of the original outer cover to prevent air from penetrating the structural perimeter of the external installation environment. The experiment was conducted by varying the combinations of additional covers in the five patterns, as summarized in Table 1.
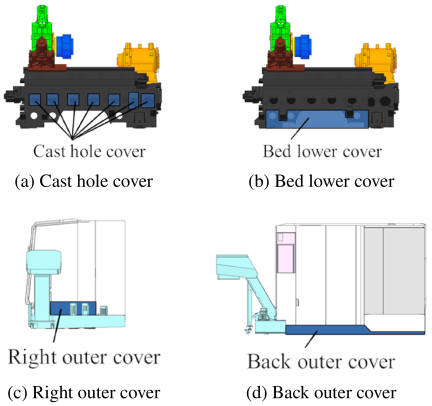
Fig. 4. Configuration of additional covers.
| Condition No. | 1 | 2 | 3 | 4 | 5 |
| Cast hole cover | No | Yes | Yes | Yes | Yes |
| Bed lower cover | No | No | Yes | Yes | Yes |
| Right outer cover | No | No | No | Yes | Yes |
| Back outer cover | No | No | No | No | Yes |
The temperatures of the machine structure and the surrounding air were measured using thermocouples. The temperature measurement locations are shown in Fig. 5. Measurement locations inside the bed are not shown. The temperature was measured at 156 locations on the structure and 57 locations in the surrounding air. The air temperature measurement locations were positioned 50 mm from the structural surface. When a distance of 50 mm could not be maintained because of the surrounding structures, the temperature was measured at the midpoint between the machine structure and adjacent components. The room temperature was measured at four locations on the machine. The thermal displacement was measured using a touch probe. Fig. 6 shows the configuration of the displacement measurement setup. A touch probe mounted on the turret was used to measure the position at two points on the workpiece fixed to the chuck. The change in the center position between these two measured points was calculated as the thermal displacement.
The experiment was initiated after powering the machine and confirming that it reached a stable condition in the ready state. The stable condition was defined as a room temperature maintained at 20 °C, with no change in the structure temperature or thermal displacement. As illustrated in Fig. 7, the target temperature of the air conditioning was increased linearly from 20 °C to 28 °C over a period of 4 h, maintained at 28 °C for 1 h, and then decreased linearly back to 20 °C over 4 h. The thermal displacement was measured at 10 min intervals. The machine was maintained in its initial position when no further measurements were taken. The time required for each measurement cycle was 20 s.
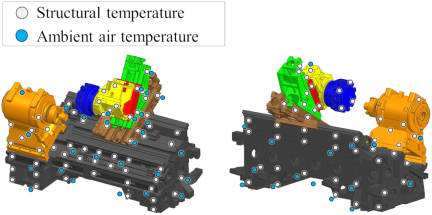
Fig. 5. Temperature measurement locations.
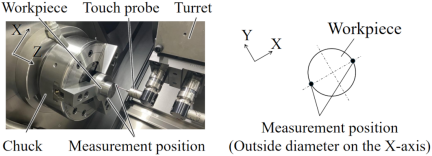
Fig. 6. Setup for measuring thermal displacement.
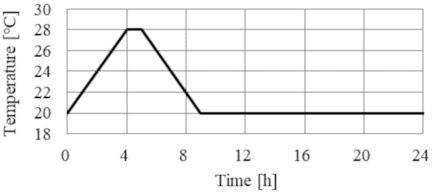
Fig. 7. Commanded room temperature.
3. Experimental Results
3.1. Temperature of Structure
Figure 8 shows the measured room temperature. The room temperature did not accurately follow the commanded temperature of the air conditioning system after 8 h, and periodic fluctuations with an amplitude of approximately 2 °C and a cycle of 0.5–1 h were observed between 8 and 16 h. The result for Condition 1 showed a maximum fluctuation amplitude of 2 °C with a longer fluctuation time. The result for Condition 3 showed a reduced amplitude of 1 °C with a shorter fluctuation time. In addition to these differences, all experiments were considered to have been conducted under the same environmental temperature change conditions.
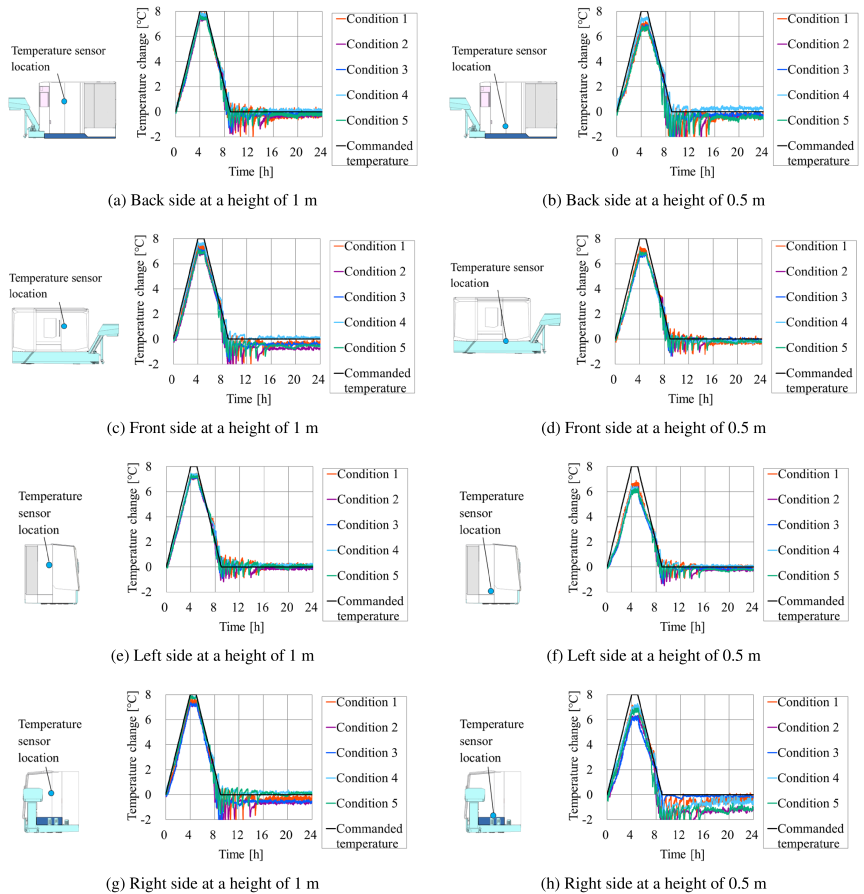
Fig. 8. Measured room temperature and temperature sensor locations.
Figure 9 shows the measured temperature distributions of the machine structure. The average temperature of all 156 measurement points, as well as the average temperature of each component (bed, left spindle, saddle, Y-base, cross slide, and turret (including both the turret body and disc, hereinafter referred to as the turret)), is presented. A temperature rise of approximately 2 °C–3 °C induced by environmental temperature variation was observed. The results demonstrated that the temperature rise decreased with the addition of the cover. Comparing the uncovered condition (Condition 1) and the condition with all additional covers (Condition 5), the temperature rise was reduced by approximately 0.2 °C–0.8 °C. This shows that heat transfer from the air to the structure was suppressed by the additional cover. In particular, the temperature rise of the bed (in Fig. 9(b)) decreased by approximately 0.8 °C, representing the largest reduction among all components. This was because additional covers were attached to the rear side of the bed and the lower region of the outer cover. The temperature of the saddle (in Fig. 9(d)) showed the second largest reduction in temperature rise because the saddle was in direct mechanical contact with the bed through the sliding interface, and was therefore strongly influenced by the temperature variation of the bed.
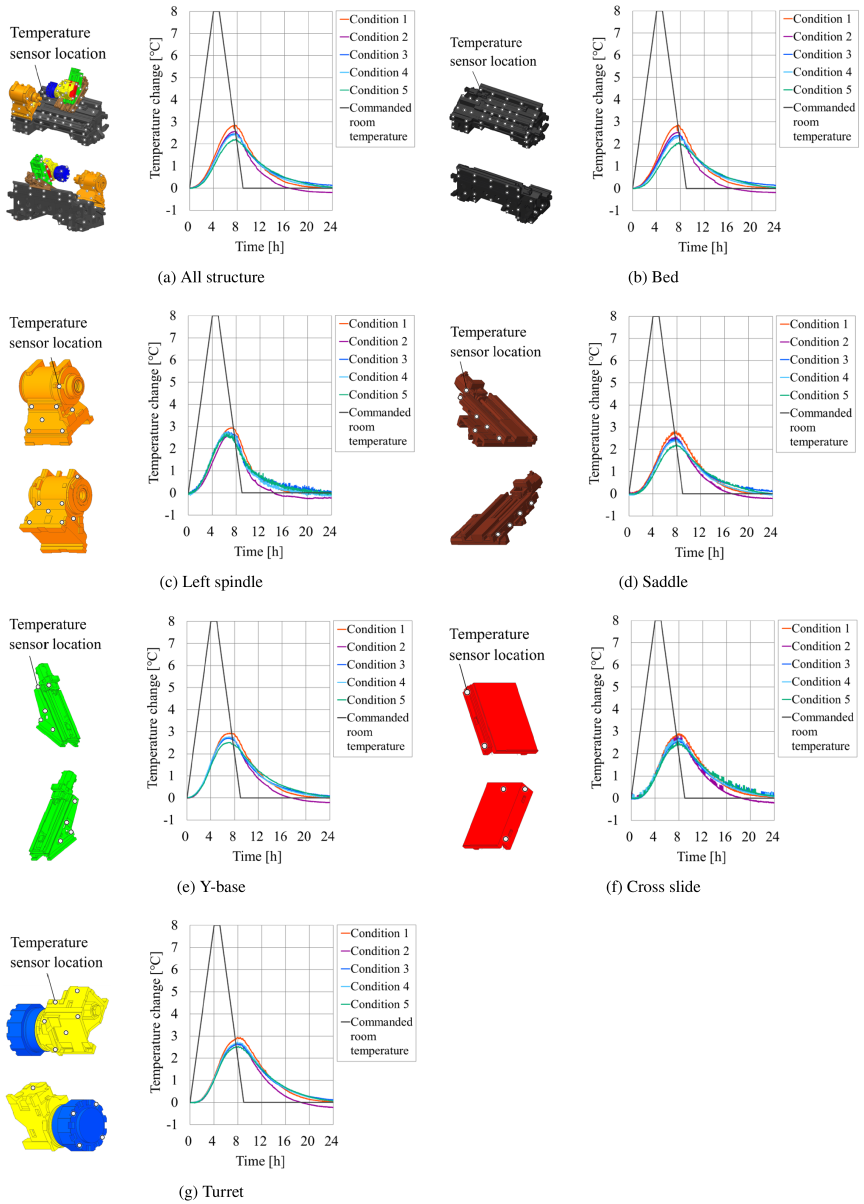
Fig. 9. Averaged measured structure temperature and temperature sensor locations.
3.2. Ambient Air Temperature
Similar to Fig. 9, Fig. 10 presents the measured ambient air temperatures around the structure. Comparing the uncovered condition (Condition 1) and the condition with all additional covers (Condition 5), the average temperature rise decreased by approximately 0.2 °C–0.8 °C. This indicates that the additional covers suppressed the air inflow from the external environment, thereby reducing the temperature changes in the air within the outer cover. Temperature fluctuations with a period of approximately 0.5–1 h was observed after 8 h of operation. This behavior is attributed to the propagation of room-temperature fluctuations (Fig. 8) into the air surrounding the structure. Comparing the fluctuation amplitudes for Conditions 1 and 5, the amplitude of Condition 5 was notably smaller, indicating the effectiveness of the additional covers in suppressing air temperature variations. Comparing Figs. 10(b)–(g), a more pronounced reduction in the fluctuation amplitude was observed at the bed temperature, as shown in Fig. 10(b). This is because additional covers were located around the bed region.
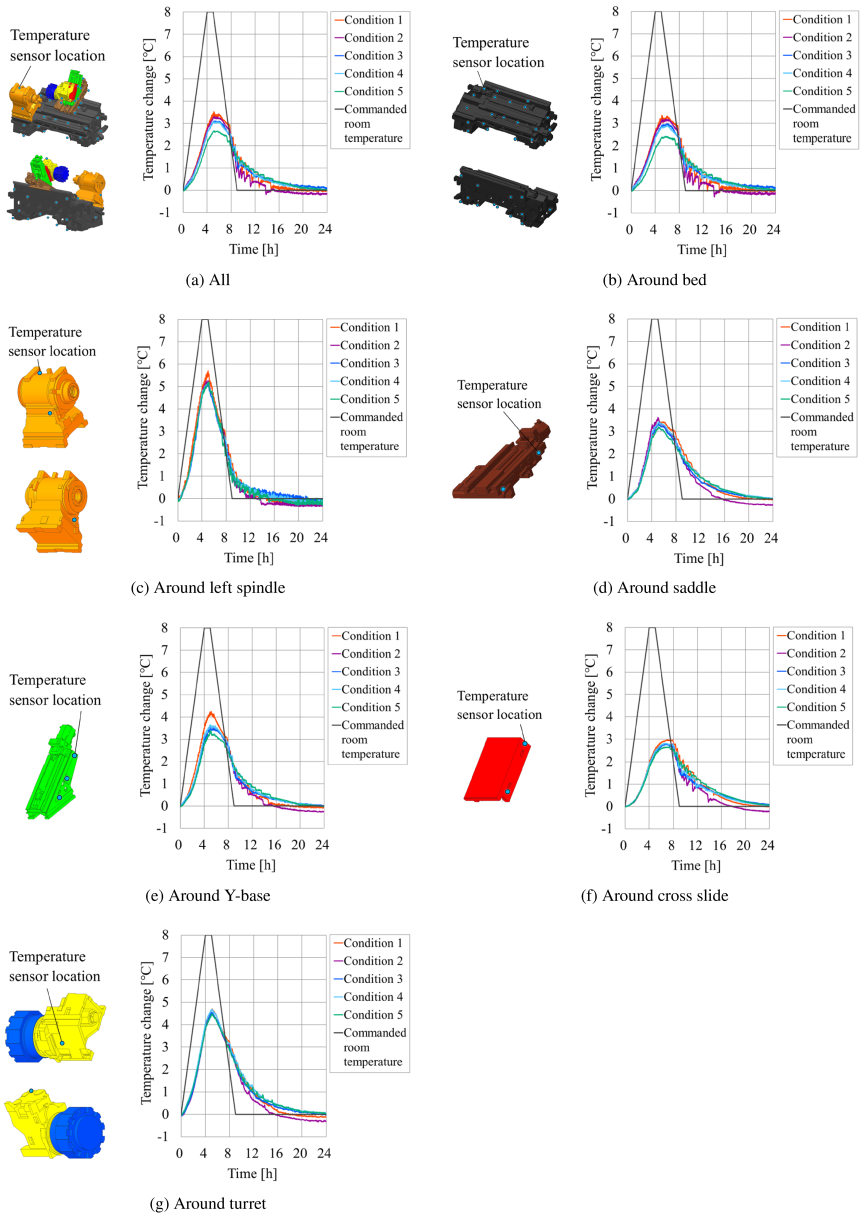
Fig. 10. Averaged measured air temperature and temperature sensor locations.
To investigate the detailed characteristics of the heat transfer between the bed and surrounding air, the air temperature around the bed is shown in Fig. 11. The left side of the bed was measured at a single location. From the results of Condition 1, the maximum temperature rise was 4.3 °C at the back side and 5.4 °C at the right side. In contrast, the maximum temperature rise on the top side was approximately 2.8 °C. The difference in the maximum temperature rise is approximately 2.6 °C, indicating that the temperature distribution of the air around the bed is non-uniform. The relatively small temperature increase on the top side is attributed to the limited clearance between the top surface of the bed and the inner cover. Air from the environment enters the outer cover and flows into the region surrounding the structure. The narrow opening in this confined space increased the pressure loss in the airflow, thereby reducing the air inflow into the space. This prevented air from reaching the interior of the machine through the outer cover. The inner cover was positioned close to the structural surface to achieve both a compact machine configuration and a large machining workspace. Consequently, the airflow in the space adjacent to the machining workspace becomes restricted, leading to a reduced temperature variation in the structure. The relatively large temperature increase on the right side is attributed to the influence of the exhaust air from the cutting fluid pumps.
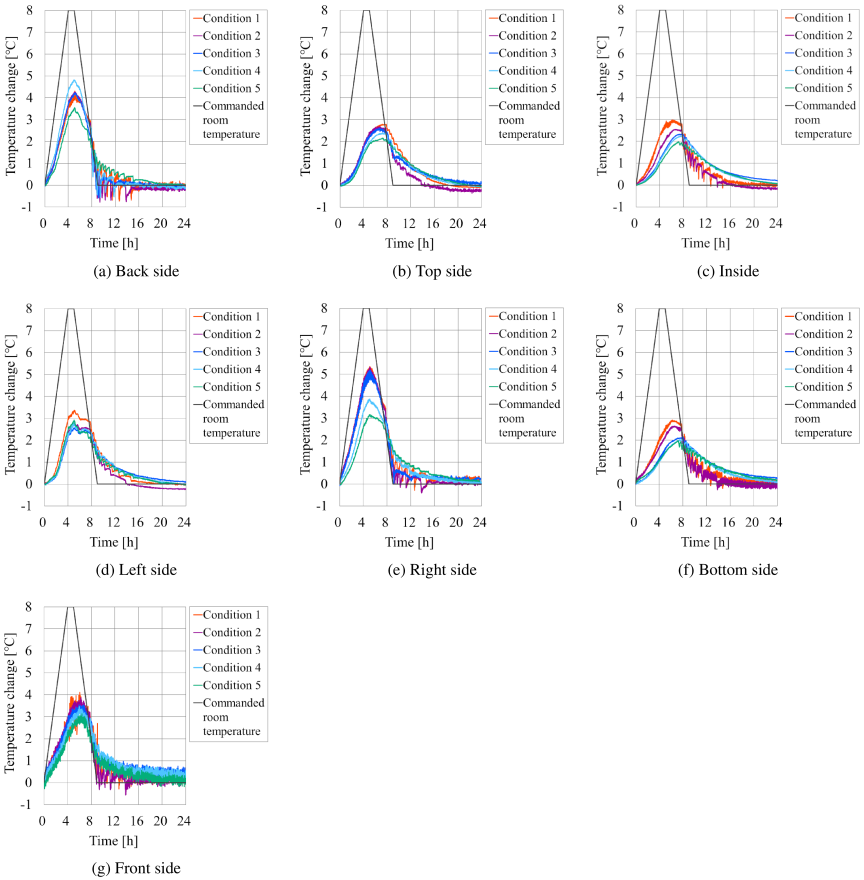
Fig. 11. Averaged measured air temperature around the bed.
Regarding the temperature fluctuation during 8–10 h caused by room-temperature variations, the amplitude on the back side was the largest, followed by the right side, inside, bottom side, and front side. No significant fluctuations were observed on the left and the top sides. These results indicate that air inflow from the back side was dominant, followed by air inflow from the right side. The inflowing air then propagates along the interior, bottom, and front regions. Therefore, the temperature fluctuation becomes progressively smaller on the left and top sides owing to diffusion and damping as it reaches these positions.
The effects of each additional cover identified in Fig. 11 are summarized as follows.
Cast hole cover (Condition 1 vs. Condition 2)
The rise in air temperature inside the bed and on the left side of the bed decreased. This is because the cast hole cover prevents airflow through the internal cavities of the bed structure.
Lower bed cover (Condition 2 vs. Condition 3)
The rise in air temperature at the bottom of the bed decreased. This is because the passage of air to the bottom was inhibited by closing the lower bed opening using the lower bed cover. In addition, during the period of 8–10 h, the influence of room-temperature fluctuations was not observed within or beneath the bed region. This indicates that the inflow of air into the bed was effectively suppressed by the combined use of the cast-hole cover and lower bed cover.
Right outer cover (Condition 3 vs. Condition 4)
The rise in air temperature on the top side of the bed decreased by approximately 0.4 °C, and on the right side decreased by approximately 1.3 °C. The largest reduction on the right side was due to the suppression of air inflow originating from the exhaust of the cutting fluid pumps. On the other hand, the air temperature rise increased by approximately 0.6 °C on the back side. This is due to the fact that the air flow was altered by partially closing the outer cover opening, thereby increasing the influence of exhaust air from the hydraulic unit.
Back outer cover (Condition 4 vs. Condition 5)
The rise in air temperature decreased by approximately 1.2 °C on the back side. This temperature decrease is greater than that observed on the top side and inside (approximately 0.3 °C), as well as on the right side (approximately 0.7 °C). This was because the large opening at the bottom of the outer cover was effectively closed by the additional cover. The effect of room temperature fluctuations observed on the back side also decreased, indicating that the air inflow was effectively suppressed.
Summarizing the effects of additional covers, the average rise in air temperature decreased by approximately 0.8 °C from Condition 1 to Condition 5. Moreover, the difference between the maximum and minimum values of the average rise in air temperature around the bed was reduced by approximately 1 °C. Furthermore, even with only the original covers, the rise in air temperature around the structure was approximately 3 °C–5.7 °C which was lower than the room temperature variation, and there was a time delay in temperature response compared with room temperature changes. These results indicate that the outer cover has a damping effect on room temperature variations and reduces the temperature differences surrounding the structure. The effect of the covers varies depending on the airflow conditions and the configuration of the peripheral equipment.
3.3. Displacement
Figure 12 shows the measured thermal displacements. Under all the conditions, the measured displacement reached its maximum value in the negative direction after approximately 5 h. Under Conditions 1, 2, and 3, the measured displacement reached its maximum in the positive direction at approximately 9.5 h. In both the no additional cover condition (Condition 1) and the fully covered condition (Condition 5), the maximum displacements in negative and positive directions were \(-8\) μm and 2 μm, respectively, indicating similar behavior. Thus, the effect of reducing the thermal displacement using additional covers was not clearly observed. As discussed in Section 3.2, the additional covers reduce the overall rise in temperature of the air surrounding the structure. However, a spatial air temperature difference of approximately 1.6 °C still remained. From Fig. 11, in Condition 1, the rise in temperature of the air around the bed was 4.3 °C at the back side and 2.8 °C at the top side, resulting in a difference of 1.5 °C. Similarly, in Condition 5, the rise in temperature was 3.6 °C at the back side and 2.2 °C at the top side, yielding a difference of 1.4 °C. These results indicated that the temperature difference in the air between the back and top sides of the bed was not significantly reduced. Therefore, the thermal displacement resulting from the non-uniform temperature distribution was not effectively mitigated.
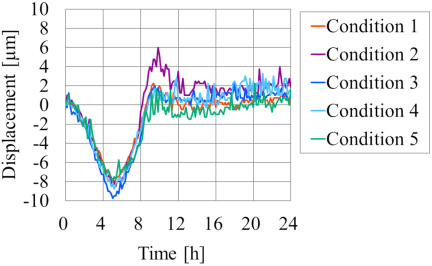
Fig. 12. Measured thermal displacement. Negative and positive displacements indicate that the tool approaches and moves away from the workpiece, respectively.
4. Identification of Heat Transfer Rate Using Simulation
Heat conduction was numerically simulated using the FEM. In the simulations, the HTC was identified for each experimental condition to calculate the heat transfer rate from air to the structure.
| Material | Density [kg/m\(^3\)] | Specific heat [J/kg K] | Thermal conductivity [W/m K] | Thermal expansion coefficient [10\(^{-6}\)/K] |
| S45C | 7850 | 434 | 60.5 | 11.7 |
| S50C | 7850 | 491 | 44.0 | 11.7 |
| SCM420 | 7850 | 461 | 41.5 | 11.7 |
| FC300 | 7300 | 523 | 46.0 | 12.0 |
4.1. Simulation Method
A reduced-order simulation approach was employed by using a commercial software package (MORe, Inspire AG, Switzerland). The initial temperature distribution of the machine was assumed to be uniform throughout the structure. Table 2 lists the material properties used in the simulations. In this analysis, the material properties were constant regardless of the temperature.
The heat transfer rate from air to the structure \(q_{in}\) is obtained as follows:
The identification of \(h\) was performed as follows. The structural surface, which forms the interface between the structure and surrounding air, was divided into 75 discrete regions, and the HTC was set for each surface. \(T_{\mathit{air}}\) was set to the temperature measured at the location closest to each surface region. To minimize the error between the measured and simulated structural temperatures, \(h\) was iteratively optimized. The mean squared error (MSE) of the temperature was used as the objective function. The simulations were repeated for 20 iterations and the value of \(h\) that resulted in the minimum objective function value was selected.
4.2. Simulation Results
Figure 13 shows the calculated heat transfer rate from the surrounding air to the structure. It is defined as positive when heat flows into the structure and negative when heat flows out of the structure. Under all conditions, the heat inflow continued until approximately 7–8 h and then changed to outflow. The inflow and outflow reached their maximum values at 4 h and 9 h, respectively.
Comparing each condition, both the maximum heat inflow and outflow decreased from Conditions 1 to 5. Compared with Condition 1, the maximum inflow heat was reduced by 20%, from 647 W to 519 W, owing to the additional covers in Condition 5. Fluctuations in heat outflow influenced by environmental temperature changes were observed during 8–12 h. The amplitude of this fluctuation decreased under Condition 5. This was attributed to the suppression of air inflow into the outer cover by the outer back cover. Therefore, additional covers suppressed heat transfer from the environment to the air around the structure, as well as from the air to the structure.
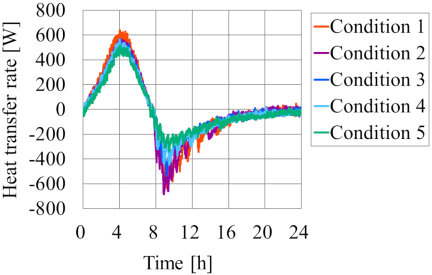
Fig. 13. Identified heat transfer rate from ambient air to the entire structure.
If thermal deformation occurs only by uniform thermal expansion, the reduction in heat inflow into the structure reduces the rise in temperature of the structure, resulting in a smaller thermal displacement. However, as mentioned in Section 3.3, no reduction in thermal displacement was observed in the experimental results. This is because the effect of bending and warping deformation caused by the nonuniform temperature distribution of the structure was dominant.
In this study, a uniform temperature distribution of the structure could not be achieved by the additional covers. However, heat transfer from the environment to the structure was reduced by the additional covers, indicating potential for controlling heat inflow. Thus, a machine tool that is robust against environmental temperature changes can be designed by appropriately arranging the covers.
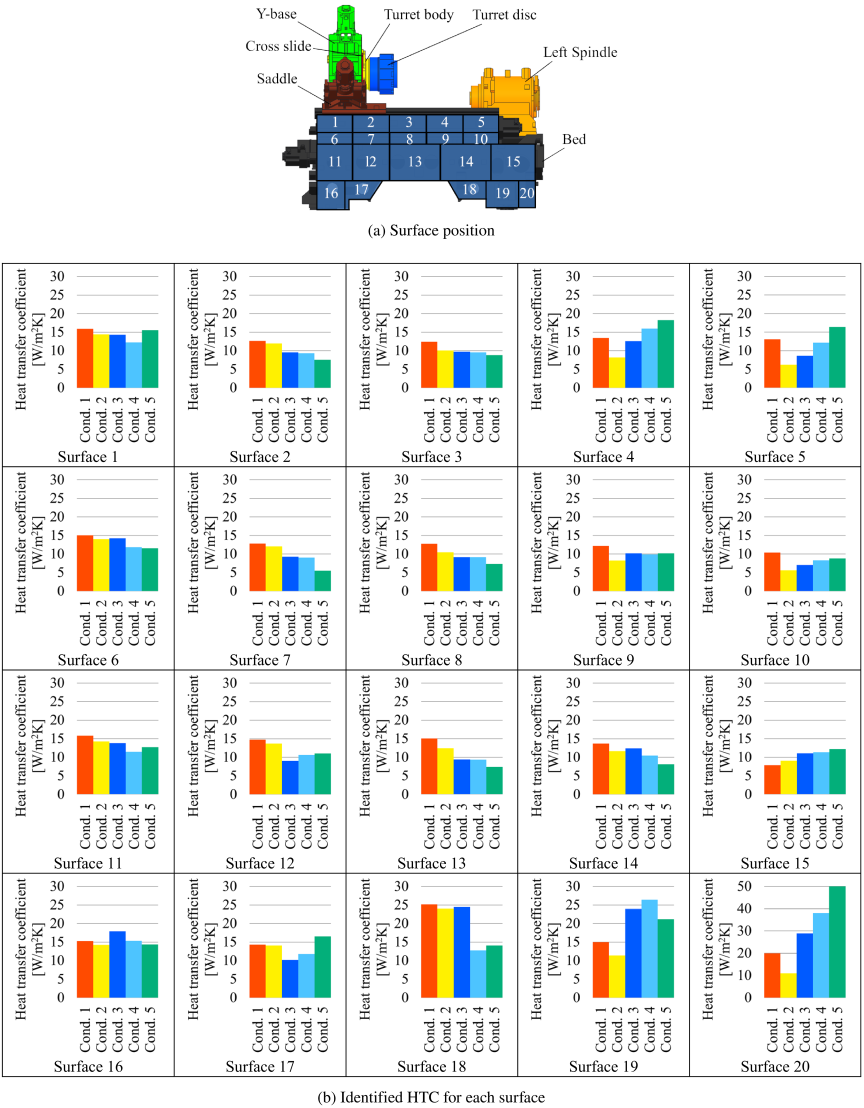
Fig. 14. Identified HTC on the back side of the bed.
Figure 14 shows the identified HTC on the back side of the bed. Fig. 14(a) shows the divided surfaces on the back side of the bed, and Fig. 14(b) shows the identified HTC values for each surface. It was assumed that the HTC would decrease with the addition of a cover, as observed for Surfaces 2 and 3. However, the HTC increased on some surfaces, such as Surface 20. There are two possible reasons for this increase in the HTC. First, the additional covers alter the airflow within the outer cover, as mentioned in Section 3.2. The airflow velocity may have increased on certain surfaces. Second, measurement errors in air temperature may have affected the identified HTC values. Because the air temperature was measured at only one position on each surface, the spatial variation in air temperature may have introduced measurement errors.
| Temperature scaling factor | 0.8 | 0.9 | 1 | 1.1 | 1.2 |
| MSE [ °C] | 0.17 | 0.17 | 0.17 | 0.17 | 0.17 |
| Identified HTC [W/m\(^2\)K] | 33 | 30 | 50 | 40 | 35 |
| Identified max. heat transfer rate [W] | 516 | 516 | 519 | 521 | 518 |
| Condition No. | 1 | 2 | 3 | 4 | 5 |
| Max. structural temperature rise [ °C] | 2.8 | 2.6 | 2.5 | 2.4 | 2.2 |
| Max. air temperature rise [ °C] | 3.5 | 3.3 | 3.1 | 3.1 | 2.7 |
| Max. heat transfer rate [W] | 647 | 572 | 570 | 564 | 519 |
| Thermal displacement [μm] | 11 | 15 | 12 | 12 | 10 |
To investigate the influence of measurement error in HTC identification, a sensitivity analysis on Surface 20 under Condition 5 was conducted. Four sets of scaled data were prepared as input for the air-temperature data used for Surface 20. The other data remained unchanged from the original air temperature data. The identification calculations were then performed using these datasets.
Table 3 shows the MSE between the measured and calculated structural temperatures, which was used as the objective function in the identification calculation, the identified HTC for Surface 20, and the identified heat transfer rate for each input dataset. The dataset with a temperature scaling factor of 1 corresponded to the original data. The results showed that the HTC varied with changes in input air temperature. This indicates that the measurement error in air temperature data directly affected the identified HTC.
The maximum rise in air temperature for Surface 20 was 2.5 °C. The uncertainty in the temperature measurements was ± 0.06 °C based on prior verification, corresponding to 2.4% of the temperature rise. Therefore, the measurement error owing to the measurement equipment is small, whereas that owing to the measurement locations may be significant. Evaluating the uncertainty owing to the measurement locations of the air temperature and determining the appropriate temperature locations for the reference temperature used in the convective boundary condition remain subjects for future investigation.
However, no significant differences were observed in the MSE. The variation in the heat-transfer rate was smaller than that of the HTC and was not significant. Thus, the analysis of the heat transfer rate shown in Fig. 13 is not influenced by the measurement error. At the design stage, it is necessary to evaluate not only the reduction in the entire heat transfer rate but also the suppression of the local HTC. The results of the sensitivity analysis indicate that further investigation is required to establish an accurate method for identifying HTC.
To compare the effects of additional covers across Conditions 1–5, Table 4 summarizes the maximum structural and air temperature increase averaged over all measurement locations, the maximum heat transfer rate, and the thermal displacement for each experimental condition.
5. Conclusions
In this study, the relationship between the temperature variation of the air and the structure and the resulting thermal displacement when a cover was added to the turning center under environmental temperature variations was examined. The air, structure, and displacement temperatures were measured by adding covers to the machine in a stepwise manner. By combining simulations with measured temperature data, the HTC was identified to investigate the heat-transfer rate from the air to the structure. The following results were obtained:
Temperature changes in the surrounding air and the structure
-
・
The temperature rise of the air around the structure was 3 °C–5.7 °C for an 8 °C increase in environmental temperature. For each structural component, the temperature rise was 5.7 °C around the left spindle and 3 °C around the cross slide. Although the influence of environmental temperature changes was suppressed by the outer cover of the machine, the variation in the air temperature within the outer cover remained large.
-
・
The air temperature rise around the bed was 2.8 °C–5.4 °C, indicating a large temperature variation. The temperature rise on the right side was the largest, at 5.4 °C, owing to the exhaust from the cutting fluid pumps. The temperature rise on the top side was the smallest, at 2.8 °C, owing to the limited space between the inner cover and the top surface of the bed. These results indicate that the spatial variation in air temperature depends on the mechanical configuration. This spatial temperature variation leads to a non-uniform temperature distribution in the structure.
Suppression of temperature rise of the air and the structure by additional covers
-
・
The average temperature rise of the structure and air was reduced by 0.6 °C and 0.8 °C, respectively, due to the additional covers. For each component, the average temperature rise of the bed was reduced by 0.8 °C, showing the largest suppression effect. The suppression effect of temperature rise on the left spindle was the smallest, with a reduction of 0.2 °C.
-
・
The effect of covers in reducing the spatial temperature variation of the air was small. With the additional cover, the air temperature rise around the bed decreased by 2.2 °C on the right side and only 0.5 °C on the left side. The larger effect on the right side may be attributed to the exhaust from the cutting-fluid pumps.
-
・
Thermal displacement was not reduced by the additional covers. This is because the effect of additional covers on reducing the spatial temperature variation was limited.
-
・
Simulation results showed that the HTC decreased on many surfaces on the back side of the bed owing to the additional covers. Additionally, the heat transfer rate from the air to the structure across the machine was reduced by 20%. These results suggest that the heat transfer from the environment to the machine structure can be effectively suppressed by additional covers.
- [1] J. Mayr et al., “Thermal issues in machine tools,” CIRP Ann., Vol.61, No.2, pp. 771-791, 2012. https://doi.org/10.1016/j.cirp.2012.05.008
- [2] W. Gao et al., “Machine tool calibration: Measurement, modeling, and compensation of machine tool errors,” Int. J. Mach. Tools. Manuf., Vol.187, Article No.104017, 2023. https://doi.org/10.1016/j.ijmachtools.2023.104017
- [3] International Organization for Standardization (ISO), “ISO 12100: Safety of machinery—General principles for design—Risk assessment and risk reduction,” 2010.
- [4] ISO, ”ISO 23125: Machine tools—Safety—Turning machines,” 2015.
- [5] ISO, “ISO 16090-1: Machine tools safety—Machining centres, milling machines, transfer machines, Part 1: Safety requirements,” 2022.
- [6] R. Ramesh, M. A. Mannan, and A. N. Poo, “Error compensation in machine tools – a review: Part II: Thermal errors,” Int. J. Mach. Tools Manuf., Vol.40, No.9, pp. 1257-1284, 2000. https://doi.org/10.1016/S0890-6955(00)00010-9
- [7] B. Iñigo, N. Colinas-Armijo, L. N. López de Lacalle, and G. Aguirre, “Ambient temperature effect on the volumetric error of a large milling machine,” euspen Spec. Interest Group Meet.: Therm. Issues, 2020.
- [8] F. Egaña, U. Mutilba, J. A. Yagüe-Fabra, and E. Gomez-Acedo, “A novel methodology for measuring ambient thermal effects on machine tools,” Sensors, Vol.24, No.7, Article No.2380, 2024. https://doi.org/10.3390/s24072380
- [9] J. Mayr et al., “Simulation and measurement of environmental influences on machines in frequency domain,” CIRP Ann., Vol.64, No.1, pp. 479-482, 2015. https://doi.org/10.1016/j.cirp.2015.04.001
- [10] P. Hernández-Becerro et al., “Reduced-order model of the environmental variation error of a precision five-axis machine tool,” J. Manuf. Sci. Eng., Vol.143, No.2, Article No.021005, 2021. https://doi.org/10.1115/1.4047739
- [11] R. Neugebauer, S. Ihlenfeldt, and C. Zwingenberger, “An extended procedure for convective boundary conditions on transient thermal simulations of machine tools,” Prod. Eng., Vol.4, No.6, pp. 641-646, 2010. https://doi.org/10.1007/s11740-010-0263-0
- [12] E. Uhlmann and J. Hu, “Thermal modelling of an HSC machining centre to predict thermal error of the feed system,” Prod. Eng., Vol.6, No.6, pp. 603-610, 2012. https://doi.org/10.1007/s11740-012-0406-6
- [13] J. Glänzel, S. Ihlenfeldt, C. C. Naumann, and M. Putz, “Decoupling of fluid and thermo-elastic simulations on machine tools using characteristic diagrams,” Procedia CIRP, Vol.62, pp. 340-345, 2017. https://doi.org/10.1016/j.procir.2016.06.068
- [14] M. Fujishima, K. Narimatsu, N. Irino, and Y. Ido, “Thermal displacement reduction and compensation of a turning center,” CIRP J. Manuf. Sci. Technol., Vol.22, pp. 111-115, 2018. https://doi.org/10.1016/j.cirpj.2018.04.003
- [15] N. Irino et al., “Digital twin based accuracy compensation,” CIRP Ann., Vol.72, No.1, pp. 345-348, 2023. https://doi.org/10.1016/j.cirp.2023.04.088
- [16] K. Ota, D. Kono, and M. Mori, “Thermal displacement reduction based on heat transfer characteristics under environmental temperature changes,” CIRP Ann., Vol.74, No.1, pp. 493-497, 2025. https://doi.org/10.1016/j.cirp.2025.04.060
- [17] J. Jędrzejewski, W. Modrzycki, Z. Kowal, W. Kwaśny, and Z. Winiarski, “Precise modelling of HSC machine tool thermal behaviour,” J. Achiev. Mater. Manuf. Eng., Vol.24, No.1, pp. 245-252, 2007.
- [18] I. Tanabe, N. Suzuki, Y. Ishino, and H. Isobe, “Development of FEM thermal simulation technology for machine tool with enclosures and application,” J. Mach. Eng., Vol.24, No.1, pp. 17-28, 2024. https://doi.org/10.36897/jme/176716
- [19] I. Tanabe and H. Isobe, “Application of design rules for thermally insensitive machines regarding a lathe with enclosure,” J. Mach. Eng., Vol.25, No.1, pp. 5-18, 2025. https://doi.org/10.36897/jme/202955
- [20] F. Pavliček et al., “Using meta models for enclosures in machine tools,” Conf. Therm. Issues Mach. Tools, pp. 159-168, 2018.
This article is published under a Creative Commons Attribution-NoDerivatives 4.0 Internationa License.