Research Paper:
Semantic Segmentation and 3D Reconstruction of Steel Girder Bridge from TLS Point Cloud Integrating Domain Knowledge
Tomohiro Mizoguchi†

Sanyo-Onoda City University
1-1-1 Daigakudori, Sanyo-Onoda, Yamaguchi 756-0884, Japan
†Corresponding author

Component-based inspection and maintenance of steel girder bridges increasingly benefit from three-dimensional as-is structural models that explicitly represent individual members and inspection elements. However, most existing bridges lack digital structural models, and generating such models from scanned point clouds remains a nontrivial task due to occlusions, missing data, and the absence of design drawings. This study proposes a heuristic method for constructing lightweight parametric models of steel girder bridges from terrestrial laser scanning (TLS) point clouds. The proposed method integrates image-based neighborhood search, point-based dimensionality analysis using principal component analysis, and line-based and plane-based RANSAC to extract and reconstruct major structural components, including deck slabs, main girders, and cross beams. By exploiting domain knowledge and the geometric characteristics of steel girder bridge superstructures, the method enables component-wise segmentation and reconstruction without relying on design drawings or prior structural models. The proposed approach was validated using real-world TLS data of an existing steel girder bridge, demonstrating stable extraction and reconstruction of major structural components. The resulting parametric models explicitly represent inspection elements and have the potential to facilitate the spatial association of inspection results, photographs, and maintenance records, thereby supporting practical bridge maintenance workflows. The applicability and limitations of the proposed method are also discussed.
1. Introduction
Many of Japan’s social infrastructures were intensively constructed during the period of rapid economic growth, and their aging has become increasingly evident in recent years. As a result, the importance of proper maintenance and management of infrastructure has been widely recognized to ensure safety and serviceability. Moreover, with approximately 700,000 bridges across the country, there is a strong demand for efficient and effective inspection and management methods under conditions of limited budgets and a shortage of skilled engineers.
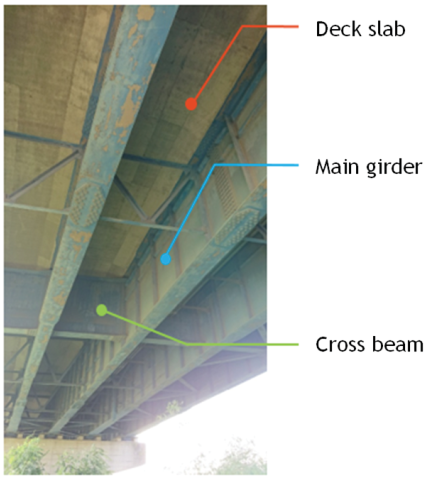
Fig. 1. Schematic overview of target structural components in a steel girder bridge.
According to the current regular inspection guidelines 1, close visual inspection remains the standard practice for bridge inspection. In steel girder bridge inspection practice, condition assessment is performed at the component level, while damage is recorded at finer location-based units within each component. In this study, the target components are the deck slab, main girder, and cross beam, which constitute the primary structural elements of steel girder bridge superstructures. Fig. 1 illustrates the location and correspondence of these components. At the same time, the guidelines allow the application of alternative inspection technologies as long as accuracy and reliability equivalent to visual inspections can be ensured. In response to this performance-based requirement, various inspection support technologies have been actively studied and developed in recent years, including methods utilizing artificial intelligence, the Internet of Things, and unmanned aerial vehicles (UAVs) 2,3.
Along with these advances, digital management using three-dimensional (3D) models has been promoted as an effective means of recording and accumulating inspection results in bridge maintenance. In particular, the creation of construction information models (CIMs), which integrate 3D geometric data with semantic information, has attracted increasing attention and is expected to serve as a comprehensive platform for bridge maintenance 4,5,6. CIM enables inspection information, such as images and documents related to deterioration and damage, to be associated and managed within a 3D space, thereby facilitating intuitive understanding of damage locations and the overall structural condition. In addition, systematic information management and improved accessibility contribute to enhanced collaboration and more efficient decision-making among inspection teams.
However, most existing bridges do not possess 3D models such as CIM or 3D CAD. Therefore, to construct an as-is 3D model that accurately reflects the current structural condition, it is necessary to perform 3D scanning of bridge structures and generate CIMs from the acquired point clouds. In recent years, various types of 3D scanning devices have become available, including terrestrial laser scanners as well as vehicle-mounted and handheld systems. Point clouds acquired by these scanners have been applied to a wide range of applications, such as deterioration detection of furnace walls 7, 3D modeling for infrastructure maintenance 8,9, dynamic map construction 10, and road management 11. These technologies enable efficient acquisition of geometric information even for large-scale bridges with complex geometries.
Among these sensing technologies, terrestrial laser scanning (TLS) provides higher scanning accuracy than mobile laser scanning 12,13 and photogrammetry 14,15, and its application to bridge inspection has been steadily expanding 16,17. TLS typically irradiates target objects from fixed observation points, such as tripods, and records reflected laser signals to generate dense 3D point clouds that represent surface geometries with high precision.
Despite these advantages, several technical challenges remain in constructing maintenance-oriented 3D models from scanned point clouds. First, the regular inspection guidelines 1 require bridge structures to be inspected and evaluated on a component-by-component basis, and inspection results must also be managed in units corresponding to inspection elements 18. In practice, however, raw point cloud data acquired by 3D scanners are not segmented according to such inspection units. Consequently, it is necessary to extract each target component from the point cloud, determine its position and orientation, and assign an appropriate semantic class through segmentation.
Furthermore, 3D models must be constructed from the segmented point clouds of individual components. In this context, parametric models defined by a limited number of parameters are widely used 19, particularly for bridges composed of relatively simple and regularly shaped members. Such models enable the derivation of dimensional information, including cross-sectional shape, height, length, and thickness, thereby allowing accurate understanding of spatial relationships among structural members. In addition, for steel girder bridges, where elongated steel members are densely arranged, laser occlusion often causes partial data loss in the point clouds. Therefore, it is essential to convert point clouds into models that can compensate for missing data and reconstruct complete structural geometries suitable for maintenance applications.
1.1. Related Works
Segmentation of point clouds and 3D parametric modeling, as described above, can be performed manually or semi-automatically. However, when significant human intervention is required, issues such as increased labor costs and prolonged processing time tend to arise. This tendency becomes particularly pronounced for structures such as steel girder bridges, where elongated members are densely arranged. Considering these challenges, research aimed at automating these processes has been actively studied in recent years.
1.1.1. Semantic Segmentation of Point Clouds
Semantic segmentation methods for bridge point clouds can be broadly classified into two categories: learning-based approaches using machine learning techniques, and domain knowledge-based approaches that integrate structural knowledge of bridge characteristics. In recent years, with the rapid advancement of neural network technologies, learning-based methods have been extensively developed and applied 20. These approaches have the advantage of being adaptable to various types of bridge structures. However, a major challenge of learning-based methods lies in the difficulty of obtaining sufficient annotated training data for bridge point clouds. In particular, models trained on limited datasets often exhibit poor generalization performance when applied to bridges with different structural configurations.
In contrast, domain knowledge-based approaches utilize bridge-specific information such as structural forms, member geometries, and general design rules to assist point cloud semantic segmentation. By incorporating such structural knowledge as heuristic constraints, these methods can effectively extract major structural components from scanned data 21.
A representative example of this approach is the study by Lu et al. 22, who proposed a method for extracting four primary structural components, including deck slabs, piers, pier caps, and girders, from highway bridge point clouds. Their method first slices the point cloud vertically into multiple cross-sections and divides the data into pier and deck regions based on height distributions. Subsequently, histograms of normal vectors and point densities are employed to extract pier caps and piers, while another histogram-based analysis is applied to the deck region to distinguish girders from the deck slab.
Similarly, Yan and Hajjar 23 proposed a heuristic-based method for automatically recognizing and extracting major structural components from steel girder bridge point clouds acquired using both TLS and UAV-based laser scanning. Their target components include five key elements: steel girders, bridge decks, piers, abutments, and cross-frames. This method exploits the structural characteristic that I-shaped steel members are aligned longitudinally along the bridge direction. Based on this feature, a skeleton structure along the roadway direction is first constructed, upon which the extraction of primary members such as girders and cross-frames is performed. One advantage of this approach is its ability to handle diverse geometric configurations and structural types, including curved and inclined bridges.
However, both of the aforementioned methods provide segmentation results at a relatively coarse component level. In particular, the extraction of girders and deck slabs lacks sufficient detail, and the resulting segmentation does not satisfy the finer inspection-unit-level segmentation required by Japan’s regular bridge inspection guidelines, which mandate inspection result management at more granular element units.
1.1.2. 3D Parametric Modeling
With regard to parametric modeling from bridge point clouds, a representative study is that of Qin et al. 24. In their method, planar and cylindrical surfaces composing structural components are first extracted, and primitive geometric surfaces are then fitted to these regions to construct parametric models. However, their approach primarily targets large, continuous surfaces such as bridge piers, where planar and cylindrical geometries dominate. Consequently, it is not directly applicable to modeling more complex elements, such as the I-shaped main girders of steel girder bridges, which are the focus of the present study.
In contrast, Yan and Hajjar 17 proposed a modeling method for the superstructure of steel girder bridges using TLS-acquired point clouds characterized by significant occlusions and missing data. Their approach focuses on detailed 3D reconstruction of main girders and cross-frames. Occluded regions are identified in advance, and a strategy is introduced to mitigate the impact of occlusion on model reconstruction. Furthermore, their method models not only the I-shaped cross-sectional geometry of main girders but also the sub-elements constituting cross-frames, thereby achieving a higher level of structural detail.
1.2. Research Purpose
In this study, based on the concept of component-wise condition assessment and location-based damage identification assumed in Japan’s regular bridge inspection guidelines 1, we propose an automated method for generating structural models suitable for inspection and record management from point cloud data. Specifically, this study focuses on point cloud data of the superstructure of steel girder bridges acquired using a TLS. The objective is to develop an automated method that extracts principal structural components, such as deck slabs, main girders, and cross girders, and further subdivides them into inspection elements in accordance with the guidelines. For each extracted element, a lightweight 3D parametric model is constructed. The effectiveness of the proposed method is verified through experiments conducted on an existing road bridge. The proposed method is applicable to TLS-acquired point clouds in general and does not require device-specific information.
The main contributions of this study are as follows:
-
Automatic semantic segmentation: Even for bridges lacking design documentation (e.g., member numbering diagrams, design drawings, or as-built drawings), the proposed method enables automatic component-wise segmentation by utilizing general domain knowledge commonly applicable to steel girder bridges.
-
Parametric modeling with occlusion compensation: For each segmented element, the method can generate a lightweight 3D parametric model even in the presence of missing data in the point cloud, by interpolating the occluded regions.
The proposed method targets three major structural components of steel girder bridges: deck slab, main girder, and cross beam. Based on the common design rules of steel girder bridges, where deck slabs are arranged horizontally with a downward-facing surface, and both main girders and cross beams are arranged horizontally in mutually perpendicular directions, the method performs automatic extraction of each member. Subsequently, the extracted components are subdivided into element units according to the inspection guideline as follows. Main girders are divided along the bridge longitudinal axis at the positions where cross beams intersect. Cross beams are divided along the transverse direction at the intersection points with main girders. Deck slabs are segmented by cross beams in the longitudinal direction and by main girders in the transverse direction.
For each segmented element, geometric attributes such as cross-sectional shape and length are parametrically defined, and a corresponding 3D model is generated. This allows accurate understanding of geometric relationships among elements, such as relative positioning and joint locations. As a result, the constructed models serve as an effective information infrastructure for bridge management and inspection support.
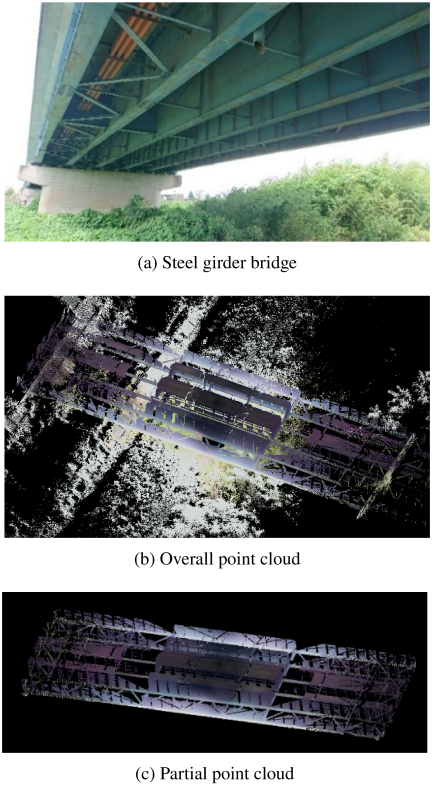
Fig. 2. Point cloud of the bridge.
1.3. Test Site and 3D Scanning
In this study, as shown in Fig. 2(a), a steel girder bridge with a single span of approximately 50 m was selected as the experimental target. Point cloud data were acquired using a Topcon GLS-2000 terrestrial laser scanner from 14 ground-based scanning positions. The scanner operates at a maximum scanning rate of 60,000 points per second, with a distance accuracy of 3.5 mm within a range of 1–150 m. The scanning angular range is 360° horizontally and 180° vertically, and during data acquisition, the angular resolution was set to 0.072°. The overall acquired point cloud is presented in Fig. 2(b). As illustrated in Fig. 2(c), non-bridge objects such as vegetation, as well as the pier and abutments, were manually removed. Consequently, only the superstructure portion of the bridge, comprising the deck slab, main girders, and cross girders, was used for analysis. The resulting point cloud after preprocessing contained a total of 48,140,272 points.
Although a specific TLS is described in this section as part of the experimental conditions, the proposed method is based on the general characteristics of high-density and high-accuracy point clouds acquired by TLS and does not depend on any specific scanner model.
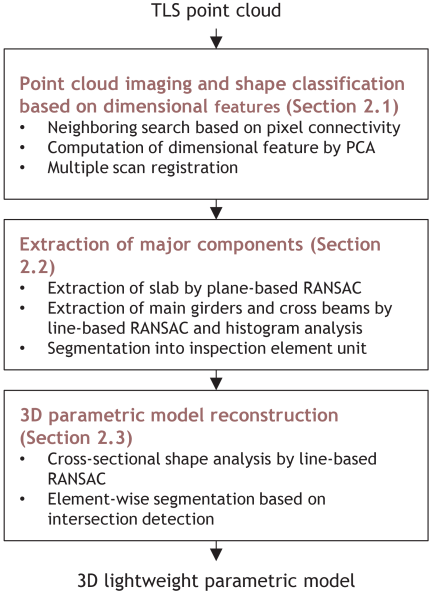
Fig. 3. Overview of our proposed method.
2. Our Proposed Method
In the proposed method, as shown in Fig. 3, individual point clouds acquired from multiple scanning positions using TLS are first taken as input. For each scan, the point cloud is converted into an image using the scanning angles of the points. Subsequently, principal component analysis (PCA) is applied to the local point distribution around each point after efficient neighborhood search based on pixel connectivity, enabling shape classification, while the normal vectors of the points are also computed. Next, the individual scans are registered and merged into a single unified point cloud using the marker coordinates recorded during the scanning (Section 2.1). After registration, the deck slab points are extracted from the merged point cloud using the plane-based RANSAC algorithm. Based on line-based RANSAC and an evaluation of the point distribution through histogram analysis, the main girders and cross beams are then extracted. The extracted deck slab, main girders, and cross beams are subsequently segmented into individual inspection elements (Section 2.2). Finally, 3D models of the main girders and cross beams are constructed by detecting straight lines on 2D cross-sectional point clouds using line-based RANSAC. The deck slab is also modeled for each rectangular region enclosed by the main girders and cross beams (Section 2.3). The details of each processing step are described in the following sections.
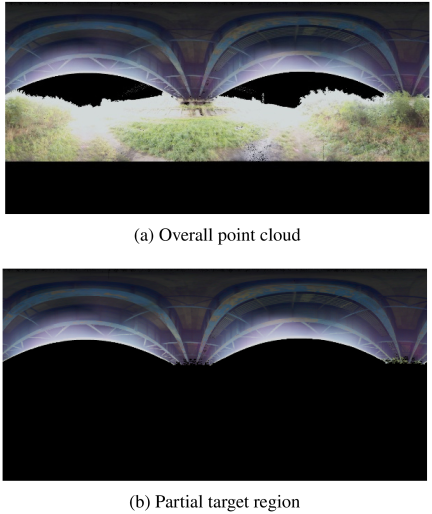
Fig. 4. Imaging of point cloud.
2.1. Point Cloud Imaging and Shape Classification Based on Dimensional Features
The majority of structural components constituting the target steel girder bridge are composed of planar surfaces. Therefore, by extracting points that are distributed on planes through PCA, subsequent processing steps can be simplified. First, for each point in a point cloud acquired from a single scanning position, the horizontal and vertical laser emission angles at the time of scanning are calculated. The point cloud is then converted into an image format by mapping these angles to the horizontal and vertical axes of the image. Given that the angular resolution of the scanner is 0.072°, the image size becomes 5,000 pixels horizontally and 2,500 pixels vertically. However, direct processing of this high-resolution image would require excessive computation time. To reduce computational cost, a representative point is determined for every \(2\times 2\)-pixel local region, and both horizontal and vertical image dimensions are compressed by half before processing. One of the advantages of this image-based representation is that the neighbor search process, described in the following subsection, can be executed more efficiently. Figs. 4(a) and 4(b) respectively show the results of converting the point clouds in Figs. 2(b) and 2(c) into image format.
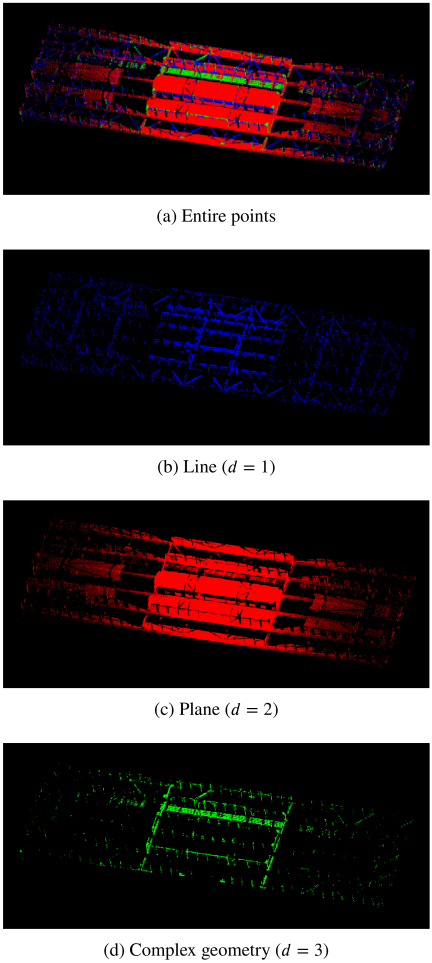
Fig. 5. Shape classification.
Next, using the adjacency relationship of the created image, a set of neighboring points within a certain spatial distance from each point is identified. This process can be efficiently implemented by recursively searching the 8-connected neighborhood of the target pixel in the image. If the distance between the point stored in the target pixel and the point stored in a neighboring pixel is within a predefined threshold, the point is extracted as part of the neighborhood. Based on empirical evaluation, this distance threshold was set to 20 cm. Subsequently, PCA is applied to the extracted local neighborhood of points. First, the covariance matrix \(S\) of the neighboring point set is calculated, and its three eigenvalues (\(\lambda_1\ge \lambda_2\ge \lambda_3\)) are obtained. If the points are distributed linearly along a one-dimensional line, only the largest eigenvalue \(\lambda_1\) takes on a large magnitude, while the others remain near zero. For a planar distribution, both \(\lambda_1\) and \(\lambda_2\) become large and \(\lambda_3\) approaches zero. In contrast, a volumetric 3D distribution results in all three eigenvalues attaining large magnitudes. Based on this principle, a dimensional feature quantity \(d\) is computed at each scanned point from the three eigenvalues according to Eqs. \(\eqref{eq:1}\) and \(\eqref{eq:2}\) 25.
If \(s_1\) is the largest, \(d=1\) (linear structure); if \(s_2\) is the largest, \(d=2\) (planar structure); and if \(s_3\) is the largest, \(d=3\) (complex 3D structure). An advantage of the dimensional feature is that no threshold is required for shape classification. The classification results are shown in Fig. 5: planes are shown in red, lines in blue, and complex 3D structures in green. The deck slab, main girders, and side faces of cross beams were successfully extracted as planar regions. A total of 9,240,748 points were classified as planes. For subsequent use, the eigenvector corresponding to the smallest eigenvalue \(\lambda_3\) was computed for each point and stored as its normal vector.
After performing the above processing for all scanned point clouds, the datasets were merged using the marker coordinates recorded during the scanning.
2.2. Extraction of Major Components
The following processing is performed on the merged point cloud. First, the point cloud corresponding to the deck slab is extracted, followed by the extraction of the main girders and cross beams. Finally, the deck slab, main girders, and cross beams are divided into inspection-element units. The details are described below.
2.2.1. Extraction of Slab
Based on domain knowledge of steel girder bridge superstructures, as shown in Fig. 6, the points of the deck slab can be regarded as lying on a single plane and occupying most of the structure. In addition, the normal vectors of the slab points are approximately directed vertically downward, whereas those of the main girders and cross beams are mainly oriented horizontally due to their vertical web and flange surfaces. Accordingly, the deck slab can be identified as the largest set of points on a single plane with approximately downward normal vectors.
Based on this principle, among the merged point clouds, only the points classified as planes are targeted, and a subset of points lying on a single plane is extracted using the plane-based RANSAC. During RANSAC-based slab extraction, points are regarded as inliers if their distance from the estimated plane is below a specified threshold, and the angles between their normal vectors and the normal vector of the estimated plane are within an angular threshold. The number of iterations was set to 300, the distance threshold to 150 mm, and the angular threshold to 30°. These parameters were empirically determined through various experiments. To extract the entire deck slab, which may contain slight deformations, the thresholds were set relatively larger than the laser scanning accuracy. An example of the extracted deck slab is shown in Fig. 7.
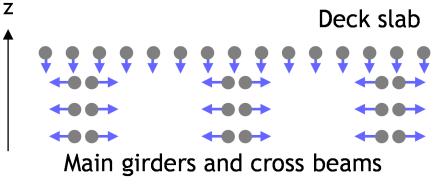
Fig. 6. Geometric characteristics of major components and their normal directions.
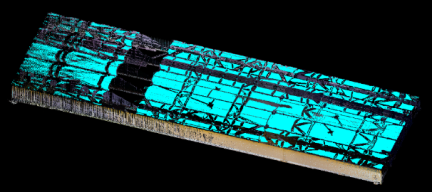
Fig. 7. Extraction result of slab.
2.2.2. Extraction of Main Girders
Next, the main girders and cross beams are extracted. The target points correspond to flat surface regions of the main girders and cross beams. In the bridge considered in this study, multiple main girders are arranged in parallel, and the cross beams are also arranged in parallel. In addition, leveraging the structural knowledge that main girders are generally longer than cross beams, the main girders, which are easier to extract, are detected first, followed by the extraction of the cross beams.
First, since the normal vectors of the flat surface regions of the main girders and cross beams are expected to be oriented horizontally, candidate points are preliminarily extracted using threshold processing based on normal vectors. Specifically, among the points that were not extracted as the deck slab in the previous step, only the points whose normal vectors are approximately perpendicular to the \(z\)-axis are extracted. The angular threshold was set to 5.0°.
Next, as shown in Fig. 8(a), the extracted point cloud is projected onto the \(xy\)-plane (\(z=0\)). As can be seen from the figure, the main girders and cross beams form a grid-like arrangement. Subsequently, a single line fitting is performed on the projected plane using RANSAC to obtain the largest subset of points distributed along a straight line. The number of iterations was set to 50, and the distance threshold was set to 30 mm. The detected points are shown in red in Fig. 8(a). Then, as shown in Fig. 8(b), the point cloud is rotated around the \(z\)-axis so that the extracted line aligns with the \(x\)-axis. From the figure, it can be confirmed that the main girders are aligned along the \(x\)-axis.
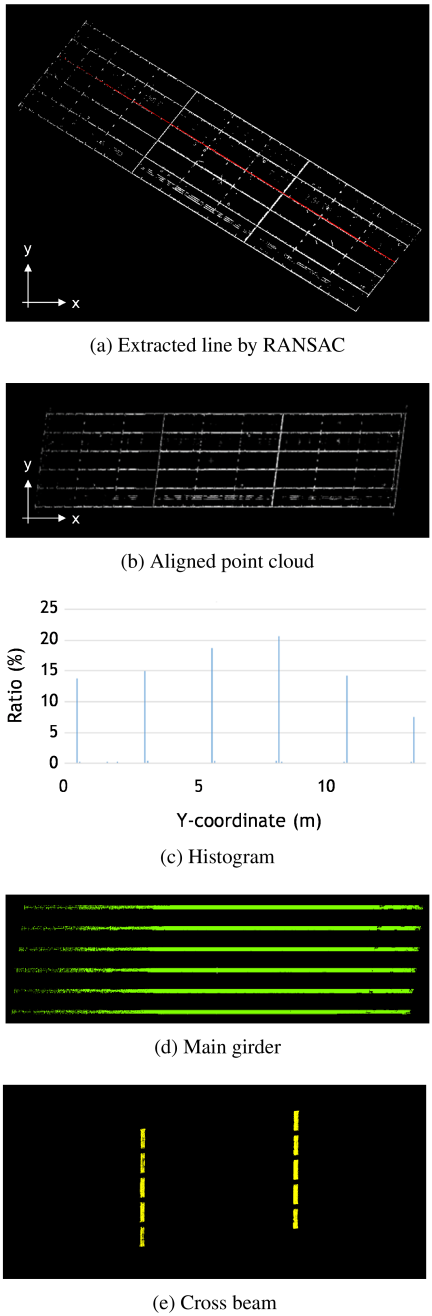
Fig. 8. Extraction of main girder and cross beam.
Next, the distribution of points along the \(x\)-axis is evaluated using a point-count histogram to extract the main girders and cross beams. Specifically, histogram bins are defined along the \(y\)-axis, and the number of points in each bin is counted to construct a histogram with the horizontal axis representing the \(y\)-coordinate and the vertical axis representing the ratio of the number of points to the total number of points. The generated histogram is shown in Fig. 8(c), with a bin width of 100 mm. Finally, local maxima in the histogram are detected, and if the number of points in a bin exceeds 5% of the total number of points, that bin and its adjacent bins are extracted as main girders. The extracted main girders are shown in Fig. 8(d).
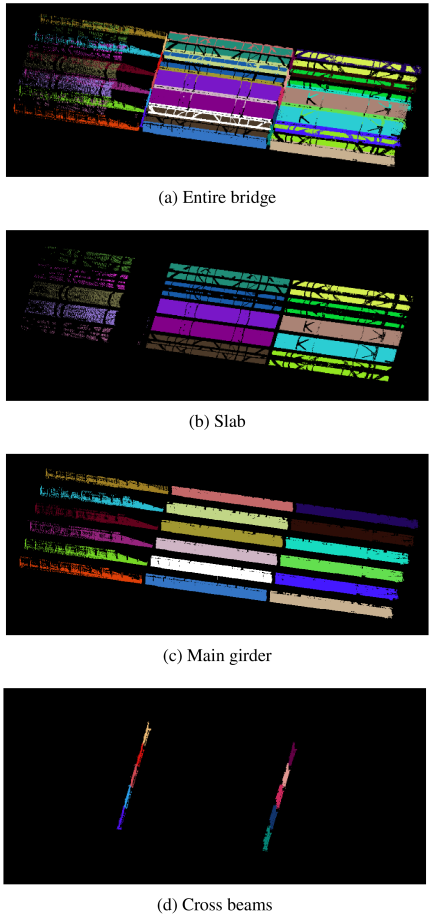
Fig. 9. Segmented parts into inspection unit.
2.2.3. Extraction of Cross Beam
For the points remaining after the main girders were extracted in the previous step, the cross beams are extracted using the same procedure as for the main girders. Most of the remaining points correspond to the cross beams. Here as well, the process begins with linear fitting using RANSAC, followed by rotation and alignment of the point cloud along the \(y\)-axis and the creation of a histogram along the \(x\)-axis to extract the points corresponding to the cross beams. The number of RANSAC iterations was set to 50, and the distance threshold to 30 mm. The histogram bin width was set to 100 mm, and among the local maxima, if the number of points exceeded 1% of the total number of points, the corresponding class and its adjacent classes were extracted as cross beams. The extracted cross beams are shown in Fig. 8(e).
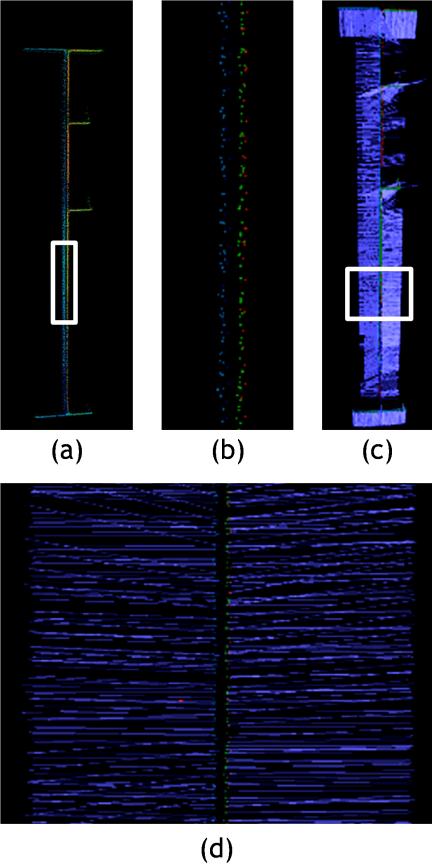
Fig. 10. Points on cross-section plane of girder: (a) point cloud, (b) zoom of point cloud, (c) normal vector, and (d) zoom of normal vector.
2.2.4. Segmentation into Inspection-Element Unit
The extracted components, the deck slab, main girders, and cross beams, are divided into inspection-element units. Since the main girders and cross beams of the bridge targeted in this study are arranged in a grid pattern, the division is performed based on their intersection points. The deck slab is then divided into rectangular regions enclosed by the segmented main girders and cross beams. The result of labeling each extracted component is shown in Fig. 9.
2.3. 3D Parametric Model Reconstruction
Finally, each segmented component is modeled element by element. In this study, both the main girders and cross beams have I-shaped cross-sections. The details are described below.
2.3.1. 3D Modeling of Girders
Figure 10(a) shows a cross-section of the merged point cloud of the girders. As shown in Fig. 10(b), since there is no intersection between the two side surfaces of the girder, which are only about 10 mm thick, it can be confirmed that both the 3D scanning and the point cloud registration were performed with high precision. Furthermore, as illustrated in Figs. 10(c) and 10(d), each scanned point cloud was color-coded, and the normal vectors of the points were visually inspected. It was observed that the normal vectors on the girder sides were oriented horizontally, while those on the upper and lower flanges were directed vertically downward, confirming that the normal vectors were correctly computed.
As shown in Fig. 11(a), due to occlusion during laser scanning from the ground, only four surfaces of the I-shaped girder, the two side surfaces and the undersides of the upper and lower flanges, can be captured. Therefore, as shown in Fig. 11(b), the merged point cloud, which was aligned to the \(x\)- and \(y\)-axes, was sliced to extract the points corresponding to the I-shaped cross-sections of the main girders and floor beams. For these extracted subsets, only the points whose normal vectors faced approximately the same direction on the projection plane were used for RANSAC-based line fitting with directional constraints, allowing the extraction of four lines corresponding to the two girder sides and the undersides of the upper and lower flanges, as shown in Fig. 11(c). The angular threshold was set to 30°, the distance threshold to 10 mm, and the number of iterations to 10.
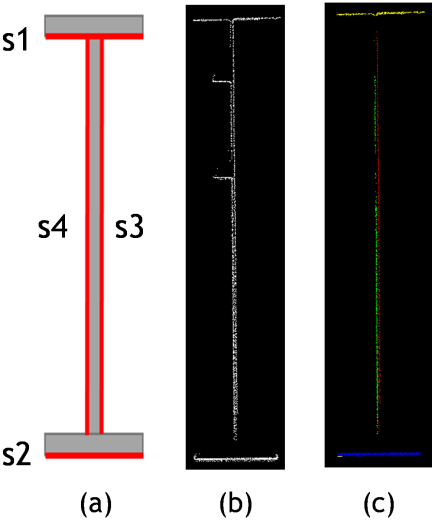
Fig. 11. Overview of 3D parametric model reconstruction of girder: (a) four faces to be modeled, (b) points on cross-section plane, and (c) line extraction by RANSAC.
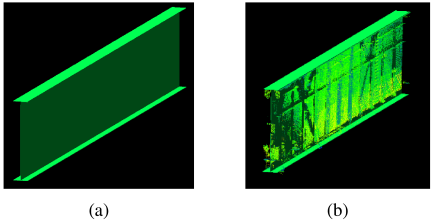
Fig. 12. Reconstructed girder model: (a) reconstructed parametric model and (b) overlay with point cloud.
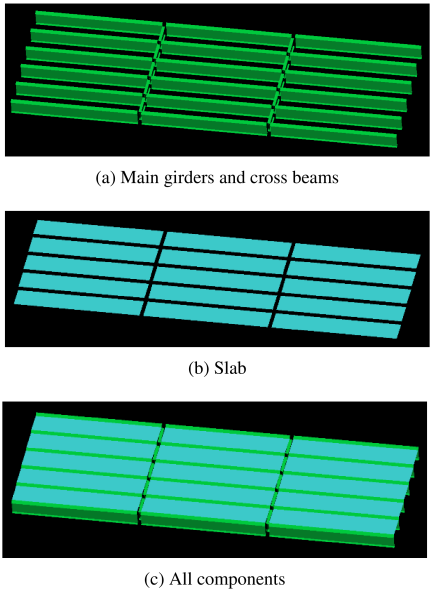
Fig. 13. Reconstructed 3D parametric models.
Subsequently, each girder element was modeled using the centroids of the extracted lines, the maximum and minimum coordinates of each divided element, and the actual measured size of the bridge. An example of the modeled main girder is shown in Fig. 12(a), and the visualization result of the model overlaid on the point cloud is presented in Fig. 12(b). It can be confirmed that the reconstructed model tightly approximates the point cloud. In this study, because the depth dimension along the roadway direction is difficult to compute automatically, an approximate depth value was manually derived from the point cloud and used for modeling. An example of the complete main girder and cross beam modeling result is shown in Fig. 13(a).
2.3.2. 3D Modeling of Slab
The deck slab is modeled as a plane for each rectangular region enclosed by the main girders and cross beams. As shown in Fig. 14, the coordinates of the four corners of the upper flanges of the modeled main girders are stored, and planes are fitted between adjacent main girders to construct the deck slab model. The resulting deck slab model is shown in Fig. 13(b), and the complete bridge model, including all components, is shown in Fig. 13(c).
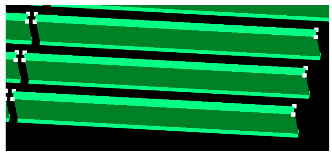
Fig. 14. 3D modeling of slab.
3. Experimental Results
3.1. Extraction of Main Components
The results of dividing the extracted deck slab, main girders, and cross beams into element units are shown in Fig. 9. For verification, manually cropped point clouds of the target components were created as ground truth, and the number of points in the automatically extracted components was compared with those in the ground truth to calculate the accuracy. Here, the accuracy was defined as the ratio of the manually extracted points that coincided with the points automatically extracted by the proposed method. For the deck slab, the accuracy was 99.4%. The deck slab was correctly divided into 15 inspection-element units. For the main girders, six peaks were observed in the histogram shown in Fig. 8(b). Since the actual bridge has six main girders, it was confirmed that all corresponding components were successfully extracted by the proposed method, with an accuracy of 98.7%. As shown in Fig. 9(c), the girders were correctly divided into 18 inspection-element units. On the other hand, the bridge has two cross beams, and two peaks were identified in the histogram. The proposed method successfully extracted these two cross beams and correctly divided them into 10 inspection-element units. However, the accuracy was 78.3%, which is lower than that for the main girders and deck slab. The reduction in accuracy is considered to be because, during the extraction of cross beams, the points corresponding to the main girders were excluded first, resulting in the omission of points at the intersections between the main girders and cross beams.
3.2. 3D Parametric Model Reconstruction
The reconstructed models of the deck slab, main girders, and cross beams are shown in Fig. 13. The average number of points per segmented element was 324,777 for the main girders, 20,533 for the cross beams, and 180,495 for the deck slab. In contrast, each modeled girder consists of 32 triangular surfaces, while each deck slab segment consists of two triangular surfaces. This demonstrates that a highly lightweight model was successfully generated. Furthermore, as shown in Fig. 12, the close overlap between the point cloud and the reconstructed model indicates that the model accurately approximates the scanned point cloud.
Table 1. Processing time.

3.3. Processing Time
The breakdown of the processing time is shown in Table 1. The total processing time was approximately 25 minutes, most of which was spent on computing the dimensional features. It is noted that, without applying the down sampling process described in Section 2.1, this computation would require approximately 10 times longer, resulting in a total processing time of 221 minutes. This confirms the effectiveness of the proposed down sampling approach. The implementation and experiments were conducted on a standard PC environment running Windows 10, an Intel Core i7 CPU, and 32 GB of RAM. The code was written in C\(++\).
4. Discussion: Applicability, Assumptions, and Limitations
In this section, the applicability, assumptions, and limitations of the proposed method are discussed. The inspection elements defined in this study are engineeringly organized to be consistent with the component-based inspection and recording framework specified in the bridge inspection guidelines, which are based on diagnoses at the member level and focused inspection locations within each member. Based on this premise, the practicality and constraints of the proposed method are examined.
4.1. Structural Conditions of the Target Steel Girder Bridge
The proposed method in this study targets the superstructures of steel girder bridges with straight girders. It assumes a structural configuration in which the main girders and cross beams are arranged parallel to each other, respectively. Although in many road steel girder bridges, the main girders and cross beams are orthogonally arranged, the proposed method does not strictly require an exact orthogonal relationship. Instead, it is applicable as long as the dominant directions of both components can be identified from the point cloud distribution.
Under these structural conditions, component extraction can be achieved using histogram-based analysis that evaluates point distributions along the principal directions. Such configurations are commonly observed in typical road steel girder bridges, making them reasonable target structures for the intended application of this study.
In contrast, for curved girder bridges or bridges with irregular girder arrangements where dominant directions cannot be uniquely determined, the above assumptions may not be held. Therefore, such bridge types are considered outside the scope of this study. For these complex configurations, incorporating learning-based approaches into the recognition process may be a promising direction for future work.
4.2. Robustness to the Quality of the Point Clouds
The proposed method primarily targets point cloud data acquired using TLS. This is because a certain level of point density and scanning accuracy is required to reliably capture planar surfaces and cross-sectional shapes corresponding to structural components such as deck slabs, main girders, and cross beams.
In the PCA-based dimensionality analysis, a sufficient number of points within each local neighborhood is assumed to ensure stable recognition of planar structures. Through empirical evaluation, we confirmed that plane detection is feasible when several tens of points are included within a neighborhood. Based on this observation, the neighborhood size was set relatively large, approximately 20 cm.
In addition, plane and line extraction using RANSAC can robustly estimate geometric primitives even in the presence of partial point cloud missing caused by occlusions, owing to the inherent characteristics of the algorithm. Although large missing regions may hinder local shape recognition when considered in isolation, interpolation can be applied by leveraging shapes estimated from neighboring regions with sufficient point density, thereby limiting the impact of data loss. In particular, main girders and cross beams generally exhibit relatively high visibility from ground-based TLS scanning and often have sufficient point density. Moreover, since these girder components extend over several meters to tens of meters, forming elongated sweep-like structures, reliable recognition and modeling can still be achieved even when partial missing data exist, by utilizing dense regions of the point cloud.
In contrast, for deck slabs, point cloud missing is more likely to occur in areas located behind girders due to occlusion effects. Nevertheless, deck slabs can typically be approximated as a single dominant planar surface with a large planar extent, typically on the order of several to several tens of meters. Therefore, interpolation can be applied to compensate for partial missing regions, and the influence of point density on deck slab recognition is considered relatively limited. This assumption was also validated using the real-world datasets employed in this study.
Regarding scanning errors, we confirmed that even in the extraction of girder cross-sectional shapes, considered the most challenging component in this method, the front and back surfaces of girders with a thickness of approximately 1 cm could be clearly distinguished. This indicates that the impact of typical scanning errors on the proposed method is limited. However, when outliers are present, it is desirable to remove them in a preprocessing step. Furthermore, accurate registration of point clouds acquired from multiple viewpoints is required to ensure reliable processing.
4.3. Effect of Parameter Selection
The various parameters used in the proposed method, including distance thresholds, angular thresholds, and histogram bin widths, were empirically determined based on the scanning accuracy of TLS and the typical dimensions of structural members in steel girder bridges. Since the sizes and arrangements of main girders and cross beams in road steel girder bridges are relatively standardized, the adopted parameter settings provided stable results for component extraction and segmentation in this study. Furthermore, these parameters were selected to ensure that the results do not vary significantly under moderate variations in point cloud density and scanning noise. This robustness was also confirmed through experiments using real-world data. On the other hand, when the scale of the target bridges differs significantly or when scanning conditions such as scanning distance, incidence angle, and point cloud density vary substantially, parameter readjustment may be required. This aspect corresponds to practical tuning in real-world applications and does not affect the fundamental concept or processing pipeline of the proposed method.
4.4. Applicability to Bridge Inspection and Maintenance
When the structural conditions and point cloud quality assumptions described in the previous sections are satisfied, the proposed method is applicable primarily to typical road steel girder bridges with straight girders. A key feature of the proposed approach is its ability to segment and represent structural components at the level of inspection elements, which correspond to the minimum units for inspection and record management. This enables inspection results, inspection photographs, and damage histories to be spatially associated with each element, providing high consistency with maintenance workflows based on regular bridge inspection guidelines. Furthermore, the parametric models generated by the proposed method are lightweight compared to the original dense point clouds, making them suitable for practical visualization, information management, and long-term data storage. Owing to these characteristics, the proposed method has the potential to contribute to improved efficiency in bridge maintenance operations and advanced utilization of inspection information.
5. Conclusion and Future Works
In this study, we aimed to develop a method for constructing maintenance-oriented 3D models from TLS point clouds of steel girder bridges and proposed a semantic segmentation and 3D modeling approach based on the use of domain knowledge. The proposed method demonstrated that, even for steel girder bridges lacking reference drawings such as member numbering diagrams, design drawings, or as-built plans, it is possible to extract major structural components and segment them into inspection elements in accordance with general design rules. It was also shown that lightweight parametric models can be generated for each segmented element, enabling compensation for missing regions in the point cloud. Overall, the effectiveness of the proposed method was verified through experiments on real-world bridge data, indicating that it provides a practical foundation for bridge maintenance applications and future digital management of inspection information.
As future work, it will be necessary to calculate the distance errors between the constructed models and the point clouds to quantitatively evaluate the modeling accuracy. In addition, extending the proposed method to point clouds acquired using drone-based SfM or LiDAR systems will be an important topic. Further applications to other types of bridges beyond the steel girder bridge considered in this study are also planned.
- [1] Ministry of Land, Infrastructure, Transport and Tourism, “Manual for regular inspection of road bridges, June 2022 edition,” 2022 (in Japanese).
- [2] C. Lin, Y. Chen, K. Itakura, S. Maharjan, and P. J. Chun, “Bridge inspection using image–point cloud fusion with image filtering, damage detection and 3D registration,” Autom. Constr., Vol.180, Article No.106538, 2025. https://doi.org/10.1016/j.autcon.2025.106538
- [3] M. Yoshikura et al., “5G-based real-time remote inspection support,” Electronics, Vol.12, Issue 5, Article No.1082, 2023. https://doi.org/10.3390/electronics12051082
- [4] R. Sacks et al., “SeeBridges as next generation bridge inspection: Overview, information delivery manual and model view definition,” Autom. Constr., Vol.90, pp. 134-145, 2018. https://doi.org/10.1016/j.autcon.2018.02.033
- [5] C.-S. Shim, N. S. Dang, S. Lon, and C.-H. Jeon, “Development of a bridge maintenance system for prestressed concrete bridges using 3D digital twin model,” Struct. Infrastruct. Eng., Vol.15, Issue 10, pp. 1319-1332, 2019. https://doi.org/10.1080/15732479.2019.1620789
- [6] P. Araya-Santelices, Z. Grande, E. Atencio, and J. A. Lozano-Galant, “Bridge management with AI, UAVs, and BIM,” Autom. Constr., Vol.175, Article No.106170, 2025. https://doi.org/10.1016/j.autcon.2025.106170
- [7] T. Aoki, E. Yamamoto, and H. Masuda, “Detection of multiscale deterioration from point-clouds of furnace walls,” Int. J. Automation Technol., Vol.17, No.6, pp. 610-618, 2023. https://doi.org/10.20965/ijat.2023.p0610
- [8] N. Hidaka, T. Michikawa, A. Motamedi, N. Yabuki, and T. Fukuda, “Polygonization of point cloud of tunnels using lofting operation,” Int. J. Automation Technol., Vol.12, No.3, pp. 356-368, 2018. https://doi.org/10.20965/ijat.2018.p0356
- [9] H. Date et al., “Efficient registration of laser-scanned point clouds of bridges using linear features,” Int. J. Automation Technol., Vol.12, No.3, pp. 328-338, 2018. https://doi.org/10.20965/ijat.2018.p0328
- [10] K. Ishikawa, D. Kubo, and Y. Amano, “Curb detection and accessibility evaluation from low-density mobile mapping point cloud data,” Int. J. Automation Technol., Vol.12, No.3, pp. 376-385, 2018. https://doi.org/10.20965/ijat.2018.p0376
- [11] R. Miyazaki, M. Yamamoto, and K. Harada, “Line-based planar structure extraction from a point cloud with an anisotropic distribution,” Int. J. Automation Technol., Vol.11, No.4, pp. 657-665, 2017. https://doi.org/10.20965/ijat.2017.p0657
- [12] R. Blaskow and H. G. Maas, “Structural health monitoring of bridge with personal laser scanning: Segment-based analysis of systematic point cloud deformations,” ISPRS Ann. Photogramm., Remote Sens. Spat. Inf. Sci., Vol.10, No.2, pp. 9-16, 2024. https://doi.org/10.5194/isprs-annals-x-2-2024-9-2024
- [13] R. Urban et al., “Determination of accuracy and usability of a SLAM Scanner GeoSLAM Zeb Horizon: A bridge structure case study,” Appl. Sci., Vol.14, No.12, Article No.5258, 2024. https://doi.org/10.3390/app14125258
- [14] M. Mohammadi et al., “Quality evaluation of digital twins generated based on UAV photogrammetry and TLS: Bridge case study,” Remote Sens., Vol.13, No.17, Article No.3499, 2021. https://doi.org/10.3390/rs13173499
- [15] F. Gaspari, F. Ioli, F. Barbieri, E. Belcore, and L. Pinto, “Integration of UAV-LiDAR and UAV-photogrammetry for infrastructure monitoring and bridge assessment,” Int. Arch. Photogramm. Remote Sens. Spat. Inf. Sci, Vol.XLIII-B2-2022, pp. 995-1002, 2022. https://doi.org/10.5194/isprs-archives-xliii-b2-2022-995-2022
- [16] M. Rashidi et al., “A decade of modern bridge monitoring using terrestrial laser scanning: Review and future directions,” Remote Sens., Vol.12, Issue 22, Article No.3796, 2020. https://doi.org/10.3390/rs12223796
- [17] Y. Yan and J. F. Hajjar, “Geometric models from laser scanning data for superstructure components of steel girder bridges,” Automation in Construction, Vol.142, Article No.104484, 2022. https://doi.org/10.1016/j.autcon.2022.104484
- [18] D. Yamaoka, N. Aoyama, K. Kawano, K. Shigetaka, and H. Sekiya, “Verification of how to create the CIM model of the bridge which assumed the use by the maintenance,” J. Jpn. Soc. Civ. Eng., Ser. F3 (Civ. Eng. Inform.), Vol.72, No.2, pp. I_21-I_28, 2016 (in Japanese). https://doi.org/10.2208/jscejcei.72.I_21
- [19] T. Yang, Y. Zou, X. Yang, and E. del Rey Castillo, “Domain knowledge-enhanced region growing framework for semantic segmentation of bridge point clouds,” Autom. Constr., Vol.165, Article No.105572, 2024. https://doi.org/10.1016/j.autcon.2024.105572
- [20] T. Xia, J. Yang, and L. Chen, “Automated semantic segmentation of bridge point cloud based on local descriptor and machine learning,” Autom. Constr., Vol.133, Article No.103992, 2022. https://doi.org/10.1016/j.autcon.2021.103992
- [21] B. Riveiro, M. J. DeJong, and B. Conde, “Automated processing of large point clouds for structural health monitoring of masonry arch bridges,” Autom. in Constr., Vol.72, pp. 258-268, 2016. https://doi.org/10.1016/j.autcon.2016.02.009
- [22] R. Lu, I. Brilakis, and C. R. Middleton, “Detection of structural components in point clouds of existing RC bridges,” Comput.-Aided Civ. Infrastruct. Eng., Vol.34, No.3, pp. 191-212, 2019. https://doi.org/10.1111/mice.12407
- [23] Y. Yan and J. F. Hajjar, “Automated extraction of structural elements in steel girder bridges from laser point clouds,” Autom. Constr., Vol.125, Article No.103582, 2021. https://doi.org/10.1016/j.autcon.2021.103582
- [24] G. Qin, Y. Zhou, K. Hu, D. Han, and C. Ying, “Automated reconstruction of parametric BIM for bridge based on terrestrial laser scanning data,” Adv. Civ. Eng., Vol.2021, Article No.8899323, 2021. https://doi.org/10.1155/2021/8899323
- [25] J. Demantké, C. Mallet, N. David, and B. Vallet, “Dimensionality based Scale Selection in 3D lidar point clouds,” Int. Arch. Photogramm., Remote Sens. Spat. Inf. Sci., Vol.XXXVIII-5/W12, pp. 97-102, 2011. https://doi.org/10.5194/isprsarchives-xxxviii-5-w12-97-2011
This article is published under a Creative Commons Attribution-NoDerivatives 4.0 Internationa License.