Research Paper:
A Flexible Differential Angle Sensor for Calibration of Linear Scale Gratings with Different Pitches
Jiucheng Wu*, Dong Wook Shin**,†
 , Chenguang Yin*, Ryo Sato*
, and Wei Gao*
, Chenguang Yin*, Ryo Sato*
, and Wei Gao*
*Department of Finemechanics, Tohoku University
6-6-01 Aramaki Aza-Aoba, Aoba-ku, Sendai, Miyagi 980-8579, Japan
**Division of Mechanical and Aerospace Engineering, Hokkaido University
Sapporo, Japan
†Corresponding author

The accurate evaluation of pitch deviations in scale gratings is essential to ensure the performance of high-precision positioning systems, such as optical encoders and machine tools. Conventional methods, including interferometry and microscopy, provide high resolution but are limited by a restricted measurement range, environmental sensitivity, and poor suitability for in-situ applications. To address these challenges, this paper presents a differential angle sensor that can detect the angles of ±1st-order diffracted beams from a scale grating for pitch deviation calibration of the scale grating. The developed sensor employs a pair of adjustable plane mirrors and a single CMOS image sensor to capture ±1st-order diffracted beams simultaneously. This configuration eliminates the need for multiple detectors and complex symmetric optics, reducing structural complexity while maintaining high sensitivity. More importantly, gratings of different pitches can be accommodated by simple shifts of mirror positions without reconfiguring the optical structure. The method was validated in two stages. First, comparative experiments with a 1.6 µm-pitch grating confirmed that the configuration achieved stability and sensitivity comparable to conventional layouts. Short-range bidirectional scanning and long-range measurements up to 90 mm showed excellent agreement with reference data from a commercial Fizeau interferometer. Second, adaptability tests on a scale grating with a different pitch of 8 µm demonstrated that lateral mirror translation preserved measurement stability and angular sensitivity, confirming the capability to evaluate multiple gratings without structural modification. These results show that the system attains accuracy equivalent to that of interferometric methods while offering significant advantages in simplicity, adaptability, and suitability for in-situ industrial calibration. This paper highlights a practical, cost-effective approach for high-precision evaluation of linear scale gratings.
1. Introduction
Optical gratings are essential components in precision positioning systems and function as reference standards for displacement measurement 1,2,3,4. Even slight pitch deviations can accumulate into significant errors, directly degrading system performance 5. Thus, the accurate evaluation of grating pitch deviations is vital for manufacturing quality control, encoder integration, and precision system calibration 6,7. Conventional methods such as interferometry, atomic force microscopy (AFM), and scanning electron microscopy (SEM) provide high spatial resolution but are impractical for industrial use because of their high cost, limited range, low throughput, and sensitivity to environmental disturbances 8,9,10,11. Moreover, AFM and SEM are restricted to small-area scanning and require extensive sample preparation or vacuum environments, rendering them unsuitable for large-scale or in-situ testing 12. To address these challenges, optical diffraction-based methods have attracted interest owing to their simple geometry and non-contact operation. These methods use the relationship between the scale pitch and diffraction angle 13,14. In particular, the differential diffraction method determines the pitch deviations by evaluating the angular difference between the \({\pm} 1\)st diffracted beams, effectively suppressing errors from stage and surface tilts 15,16. Differential angle sensors based on the differential diffraction method have been reported to provide a reasonable trade-off among sensitivity, measurement range, and robustness 17,18.
However, previous differential angle sensors in which two quadrant photodiodes (QPDs) are employed as light-position detectors to detect the \({\pm} 1\)st diffracted beams have two major problems 17,18. First, the locations of the photodiodes are determined based on the nominal pitch of the measured scale gratings. Owing to the small light-position detection ranges of the QPDs, the angle sensor can only be used for the calibration of scale gratings with the same nominal pitch. This significantly limits the application of these sensors. Second, aligning the diffracted beams into the small detection areas of the QPDs is difficult.
The objective of this study was to solve these two problems. Hence, a flexible differential angle sensor is proposed in this study. Two adjustable plane mirrors fold the \({\pm} 1\)st-order beams into a common path, and the beams are simultaneously recorded on a single CMOS image sensor with a detection area of 5.7 \(\times\) 4.3 mm. Gratings of different nominal pitches ranging from 1.6 μm to 8 μm can be calibrated using the same sensor through simple shifts of the mirror positions over a range of 14.5 cm. The large detection area of the CMOS image sensor also makes the alignment of the diffracted beams much easier compared with the use of QPDs. The spot centroids are extracted with sub-pixel accuracy through image processing. Unlike conventional QPDs or PSDs, which are limited to single-spot tracking, the CMOS-based configuration enables flexible and robust multi-spot detection. Moreover, by tuning the mirror angles, the same optical setup can accommodate gratings with different pitches or installation geometries without reconfiguring the optical path. To validate the proposed method, experiments were conducted on a grating with a nominal pitch of 1.6 μm. Short-range (500 μm) and long-range (90 mm) scanning experiments were performed, and the results were compared with those obtained from a commercial Fizeau interferometer.
The simplified configuration demonstrated comparable measurement accuracy and stability. Additionally, without any modifications to the optical structure, diffraction gratings with different pitches of 1.6 and 8 μm were evaluated, confirming the adaptability of the method.
In summary, we developed a simplified differential diffraction system that combines dual-beam acquisition with CMOS-based centroid detection for grating-pitch deviation measurements. The system reduces the alignment complexity, eliminates the need for multiple detectors, and adapts flexibly to gratings with different pitches and installation geometries. Experimental validation against a commercial Fizeau interferometer confirmed its accuracy, demonstrating its potential for practical integration into precision manufacturing environments.
2. Principle
2.1. Pitch Deviation Evaluation
In the proposed method, the pitch deviation of a scale grating is detected by observing the angular variations of first-order diffracted beams. Fig. 1 shows a schematic of light diffraction at the scale grating. Note that higher-order diffraction beams are not shown in the figure because only first-order diffraction beams are utilized in the proposed method. The nominal diffraction angles of the first-order diffraction beams are determined using the grating equation, which can be expressed as the following equations 16:
where \(\overline{\theta_{+1}}\) and \(\overline{\theta_{-1}}\) denote the nominal diffraction angles of the positive and negative diffraction sides, respectively, \(\lambda\) is the wavelength of the incident beam, and \(\overline{g}\) is the nominal grating pitch. Assuming that a grating pitch deviation of \(\Delta g(x)\) exists along the entire length of the scale grating, and the angles on both diffraction sides change by \(\Delta\theta_{+1}(x)\) and \(\Delta\theta_{-1}(x)\) as follows:
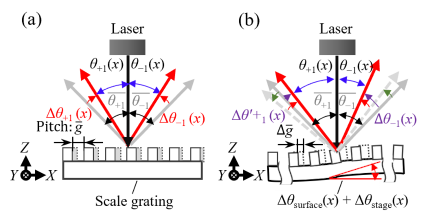
Fig. 1. Schematic of changes in diffraction angle. (a) With pitch deviation, (b) With pitch deviation and angular errors.
Meanwhile, a surface slope error of the scale grating and angular motion error during the scanning of the scale grating influence the diffraction angles by \(\Delta\theta_{\textit{surface}}(x)\) and \(\Delta\theta_{\textit{stage}}(x)\), respectively, as shown in Fig. 1(b). These errors are referred to as out-of-flatness errors. In this case, the observed angle deviations \(\Delta \theta'_{+1}(x)\) and \(\Delta\theta'_{-1}(x)\) are influenced by both pitch deviations and out-of-flatness error, which can be expressed by the following equations:
As shown in the equations, \(\Delta \theta_{\textit{surface}}(x)\) and \(\Delta\theta_{\textit{stage}}(x)\) can be eliminated by subtracting Eq. \(\eqref{eq:3}\) from Eq. \(\eqref{eq:4}\), as follows:
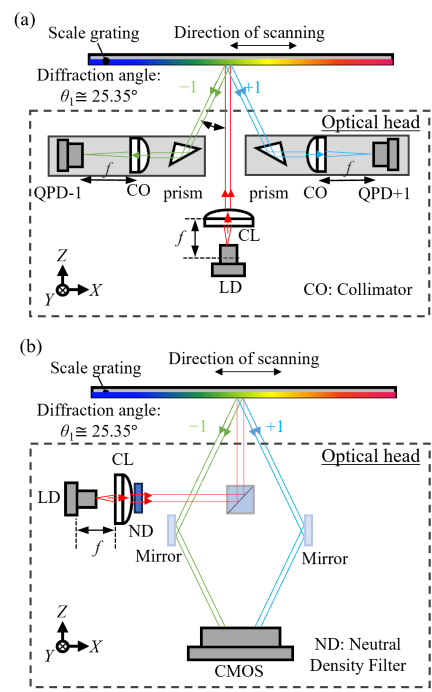
Fig. 2. Optical layouts for pitch deviation measurement of scale gratings. (a) Optical layout used in previous work. (b) Optical setup for the proposed optical lever method.
2.2. Principle of the Optical Lever Method
In this paper, a new optical lever method for evaluating pitch deviation is proposed. Fig. 2 illustrates two schematics of the optical layouts: (a) the previous method 18 and (b) the optical setup for the proposed optical lever method. In both configurations, a collimated laser beam with a wavelength of 685 nm is incident on the grating surface. The grating used in this experiment had a pitch of 1.6 μm, which produces \(\pm 1{\textrm{st}}\)-order diffracted beams with an angle of approximately 25.35°. In the previous setup in Fig. 2(a), each diffracted beam is guided through an independent optical path and detected using a QPD. However, for the measurement of gratings with various pitches, the \(\pm 1{\textrm{st}}\)-order diffraction angle varies within the range of several degrees, requiring the system to accommodate significant angular changes. The auto-collimation method is constrained by its limited effective field of view. When the pitch of the measured grating changes, the entire optical head in the previous setup must be moved to follow the direction of the diffracted beams, and the prism must be finely adjusted 20. This optical-path structure is complex and increases the difficulty of alignment and calibration. If the optical head is fixed to extend the measurable pitch range, the prism and lenses must be enlarged, and a larger sensor is required, which imposes practical limitations. Therefore, this approach is insufficiently adaptable for measuring gratings with various pitches.
To overcome this limitation, as illustrated in Fig. 2(b), this paper proposes a new optical lever method that is adaptable to the measurement of gratings with various pitches using a simple sensor configuration. This method employs a plane mirror to geometrically fold \({\pm} 1\)st-order diffracted light onto the same detection plane. By simply adjusting the mirror spacing, the system compensates for diffraction angle variations caused by different grating pitches, thereby enabling the measurement of gratings with various pitches within a single device.
Furthermore, unlike the previous setup, which requires a dual-detector unit, the proposed optical lever method employs a single CMOS image sensor capable of simultaneously detecting both diffracted beams. Therefore, signal errors can be reduced by eliminating the channel mismatch and noise influence 21.
Overall, this configuration provides greater structural simplicity and demonstrates notable advantages in terms of optical alignment flexibility compared with conventional layouts based on QPDs or PSDs.
For the optical lever method illustrated in Fig. 3, the displacement \(\Delta d\) of the light spots on the CMOS image sensor due to the change in angle can be expressed as follows 17:
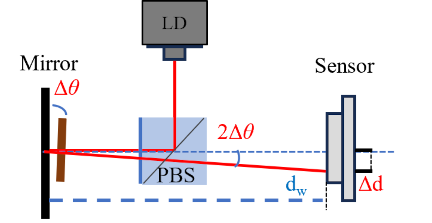
Fig. 3. Schematic of optical lever principle.
The CMOS image-sensor output in the horizontal direction, \(\Delta H_{\textit{CMOS}}\), represents the signal corresponding to the displacement of the light spot on the pixel array. The relationship between the output and the actual displacement \(\Delta d\) is given by
By substituting Eq. \(\eqref{eq:9}\) into Eq. \(\eqref{eq:10}\), the angular sensitivity of the system \(S_{\textit{CMOS}}\) can be expressed as follows:
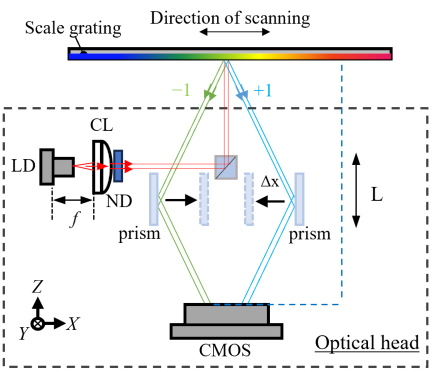
Fig. 4. Schematic of mirror position changes along the \(x\) direction.
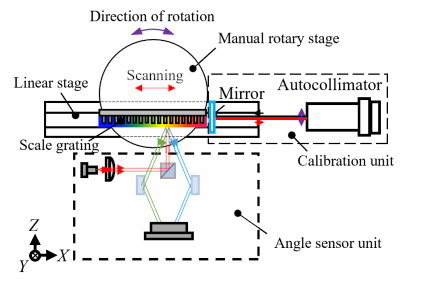
Fig. 5. Configuration of the experimental optical system.
In the proposed structure, as shown in Fig. 4, simply moving the plane mirror horizontally allows for adaptation to multiple gratings without requiring structural reconfiguration.
3. Experiments
3.1. Experimental Setup and Method
Figure 5 shows the experimental setup for the proposed optical lever method, which consisted of a collimated diode laser with a wavelength of 685 nm, pair of adjustable plane mirrors, polarization beam splitter (PBS), and CMOS image sensor (Hozan L-836). The collimated laser beam was first incident vertically on the PBS, which directed the beam toward the surface of the grating. The grating generated \(\pm 1{\textrm{st}}\)-order diffraction beams, which were individually reflected by the two adjustable plane mirrors and were simultaneously projected onto the CMOS image sensor for detection. All the optical components were mounted on a vibration-isolated table to minimize environmental disturbances.
The grating was mounted on a manual precision rotary stage equipped with a plane mirror. The stage could be rotated around the horizontal \(Y\)-axis, and the actual angular displacement was monitored using a commercial laser autocollimator (Elcomat 3000, Möller-Wedel Optical GmbH). For the pitch deviation measurements, an electric linear stage (Suruga Seiki KS102-100LG) was used to translate the grating along the \(X\)-axis, enabling precise scanning with micrometer-level step control.
For the experiment, two scale gratings with nominal pitches of 1.6 μm and 8 μm were selected to evaluate both the resolution capability and the adaptability of the proposed system. The 1.6 μm grating is a small-pitch sample commonly used in high-precision linear encoders. Its small period produces large \(\pm 1{\textrm{st}}\)-order diffraction angles of approximately \(\pm 25.3°\) at a wavelength of 685 nm. In contrast, the 8 μm grating generates much smaller \(\pm 1{\textrm{st}}\)-order diffraction angles of approximately \(\pm 4.9°\), serving to demonstrate that the same optical configuration can accommodate gratings of widely different pitches simply by laterally adjusting the plane mirrors. Furthermore, note that for the 8 μm grating, the first-order diffraction angle is only about \(\pm 4.9°\), resulting in an incidence angle on the plane mirrors of approximately 85° relative to the surface normal, which corresponds to near-grazing incidence.
This calibration method consists of two parts: stability testing and sensitivity calibration. Stability testing evaluates the system stability, whereas sensitivity calibration determines the angular response. The system resolution was evaluated based on the results of these two steps. The detailed procedures and results are presented in the following sections.
3.2. Experiment I: Structural Comparison Using a Single Grating
The experiments were performed using the optical setup described in Section 3.1. The laser spots were adjusted to exhibit a near-Gaussian profile to facilitate accurate centroid detection. Additionally, a neutral-density (ND) filter was used to attenuate the beam intensity and prevent sensor saturation. The centroid coordinates (\(x_c\) and \(y_c\)) of each beam spot were calculated using the intensity-weighted average method as follows:
First, the stability of the optical setup for grating pitch deviation measurements was evaluated. The entire optical setup was kept stationary, and the pixel positions were continuously recorded by the CMOS image sensor. Temperature stability affects the stability of pitches in scale gratings. Assuming that the thermal expansion coefficient of a glass scale is 10 \(\times\) \(10^{-6}\) K\(^{-1}\), a 1°C temperature change causes pitch changes of 16 pm and 80 pm for the 1.6 μm pitch and the 8 μm pitch, respectively. To achieve the sub-nanometric calibration stability of scale pitches, a temperature stability within 1°C is desired. The experiments were performed under stable temperature conditions of \(27.95\pm 0.06°\)C, which had a sufficient temperature stability. The CMOS image sensor captured images at 1-second intervals for a total of approximately 150 frames. For each image frame, the centroid positions of the \(\pm 1{\textrm{st}}\)-order diffraction spots were calculated using Eq. \(\eqref{eq:12}\). The range of variation in the \(X\)-direction was analyzed with a focus on evaluating the amplitude of the fluctuations in the centroid displacement of the diffraction spots during the measurement process. As shown in Fig. 6, under these temperature conditions, the fluctuations in the centroids of the \(\pm 1{\textrm{st}}\)-order diffraction beams were approximately \(\pm 0.5\) pixels for both beams. The experimental results validated the reliability and robustness of the proposed simplified configuration in a static environment.
Second, the angular sensitivities of the \(\pm 1{\textrm{st}}\)-order diffraction beams on the CMOS sensor were calibrated after confirming stability by incrementally rotating the grating with the precision rotary stage while a commercial laser autocollimator provided the reference angle. At each angular step, the centroid displacements of the \(\pm 1{\textrm{st}}\)-order diffraction spots were recorded and fitted linearly against the reference angles. The resulting sensitivity coefficients were 2.92 pixels/arc-second for the \(+1{\textrm{st}}\)-order beam and 2.83 pixels/arc-second for the \(-1{\textrm{st}}\)-order beam. The corresponding resolutions of about 0.171/0.176 arc-second for the 1.6 μm grating are summarized in Table 1, which were better than the previous method shown in Fig. 2(a) by about 0.499/0.479 arc-second 18.
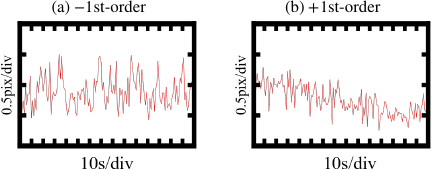
Fig. 6. Stability results of \(\pm 1\)st-order diffraction spots.
Table 1. Basic characteristics of the angle sensor with the 1.6 μm pitch grating.

Third, to assess the feasibility and repeatability of the developed angle sensor for grating pitch deviation calibration, short-range bidirectional scanning experiments were performed by moving a linear stage. The scanning range covered a 500 μm range between points A and B, with a step size of 10 μm. Bidirectional measurement was performed by conducting forward and reverse scans between points A and B. Figs. 7(a) and (b) show the angular changes of the \(\pm 1{\textrm{st}}\) order diffraction beams when the grating was scanned forward and reverse along points A and B, respectively. Based on these results and using Eq. \(\eqref{eq:8}\), the corresponding pitch deviation was calculated, as shown in Fig. 7(c). The peak-to-peak pitch deviation over a scanning range of 500 μm was approximately 0.015 nm.
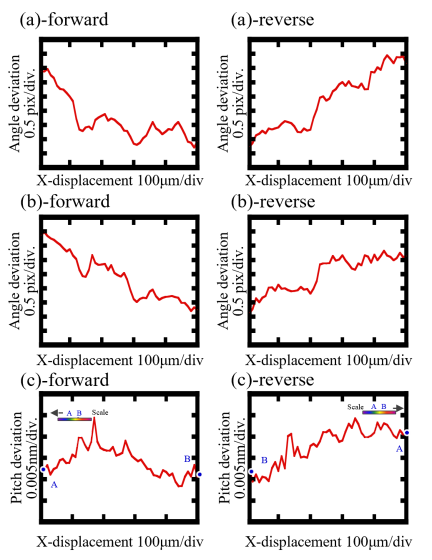
Fig. 7. Pitch deviation obtained in a short-range scanning. (a) Deviation in the angle of diffraction of the positive beam. (b) Deviation in the angle of diffraction of the negative beam. (c) Pitch deviation calculated from (a) and (b).
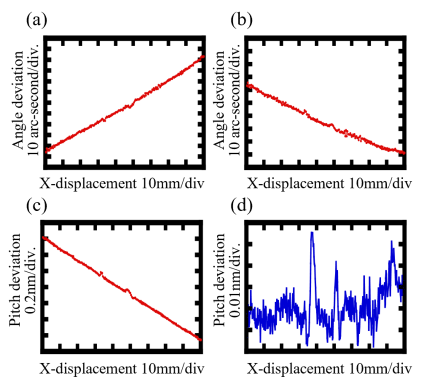
Fig. 8. Pitch deviation acquired during long-range scanning. (a) Angle deviation of positive-beam diffraction. (b) Angle deviation of negative-beam diffraction. (c) Pitch deviation calculated from sensor readings. (d) Nonlinear components of pitch deviation.
The experiment was further extended to evaluate the pitch deviation across the entire effective measurement range (90 mm) of the scale grating with the step size adjusted to 0.4 mm. Note that this step size was approximately half the diameter of the laser spot on the CMOS image sensor, ensuring spatial resolution while effectively suppressing aliasing errors in the pitch deviation curve. Figs. 8(a) and (b) show the variation curves of the positive and negative diffraction beam angles, respectively. Based on the measurement results shown in Figs. 8(a) and (b), and by applying Eq. \(\eqref{eq:8}\), the pitch deviation \(\Delta g(x)\) over the entire length of the scale grating was calculated, as shown in Fig. 8(c). Note that the slope of the scale, which is caused by the alignment error of the scale grating, introduces a cosine error in the nominal pitch value and the pitch deviation values of the scale grating. Assuming that the slope angle is 1°, the cosine error is approximately 0.015%, corresponding to 0.15 pm for a pitch deviation of 1 nm, which is sufficiently small. Therefore, the linear component in Fig. 8(c) represents the change in the pitch deviation instead of the slope of the scale. The data shown in Fig. 8(c) are in good agreement with the measurement results at the same scale reported in a previous study 18. To analyze the nonlinear components, \(\Delta g_n(x)\) of the pitch deviations, the data in Fig. 8(c) were fitted with a straight line using the least-squares method and the fitted trend was subtracted from the measured profile. After the linear error was removed, the nonlinear component of the pitch deviation of the scale grating was obtained, as shown in Fig. 8(d), with a value of approximately 0.03 nm.
For independent verification, the same scale grating was calibrated by using a commercial Fizeau interferometer (Verifire™, Zygo Corporation, 102 mm \(\times\) 102 mm aperture). In this method, the wavefronts of the \(\pm 1{\textrm{st}}\)-order diffracted beams from the grating were measured using the Fizeau interferometer. The accumulative pitch deviation \(e(x)\) of the grating was obtained from the differential operation of the two wavefronts, where the phase errors introduced by the \(Z\)-directional flatness were eliminated. Differentiating \(e(x)\) yields the nonlinear components, \(\Delta g_n(x)\), of the pitch deviation, as expressed in Eq. \(\eqref{eq:13}\) 22:
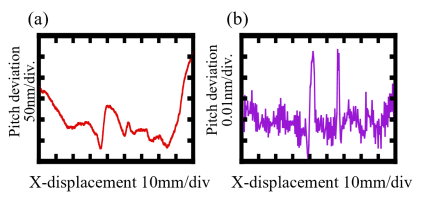
Fig. 9. Pitch deviation measured by a commercial Fizeau interferometer. (a) Accumulative pitch deviation, (b) Nonlinear components of pitch deviation.
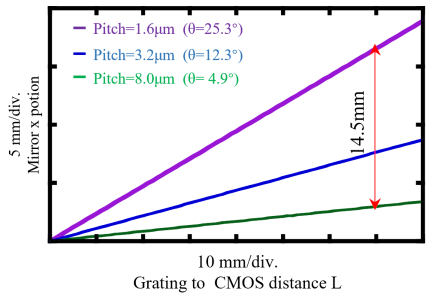
Fig. 10. Relationship between the grating-to-CMOS distance \(L\) and mirror \(x\) position (mirror located at mid-plane).
Following this procedure, the pitch-deviation curve shown in Fig. 9(b) was obtained. Note that the linear component of the pitch deviation was automatically removed by the derivative operation in Eq. \(\eqref{eq:13}\). The close agreement between the results of the nonlinear components in Figs. 8(d) and Fig. 9(b) confirmed the feasibility of the proposed method. The spatial resolution of the proposed method was determined using the diameter of the laser beam, which was approximately 1 mm. The spatial resolution of the Fizeau-interferometer-based method was determined using the pixel size of the CCD camera of the Fizeau interferometer, which was approximately 0.3 mm. Although the latter was slightly higher than the former, both methods were considered to have the same degree of spatial resolution.
3.3. Experiment II: Multi-Grating Adaptability
As shown in Section 3.2, the performance of the proposed system was validated using a diffraction grating with a pitch of 1.6 μm. To further evaluate the adaptability of the system across multiple pitches, experiments were performed with gratings of varying pitches. As shown in Fig. 4, the two mirrors were symmetrically arranged in parallel with respect to the incident optical axis. When the grating pitch changed, the mirrors were positioned at the corresponding spacing determined by the geometric relationship shown in Fig. 10. When the grating was positioned 75 cm from the mirror surface, changing the pitch from 1.6 to 8 μm required each mirror to be translated laterally by approximately 14.5 cm along the incident optical axis. This enabled the amount of adjustment to be determined in advance.
(a) 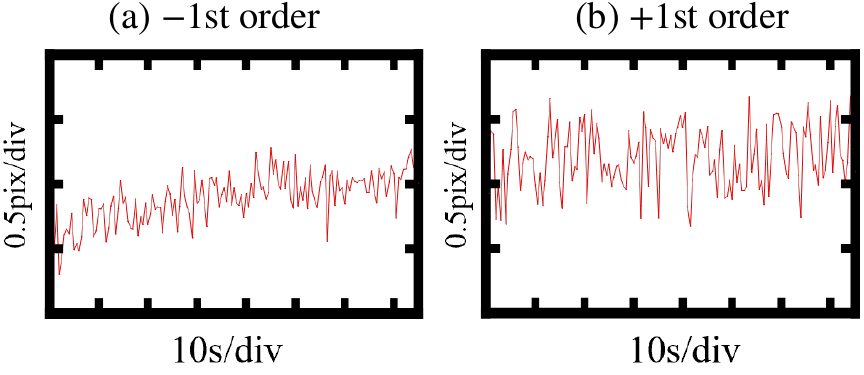
Fig. 11. Stability results of \(\pm 1\)st-order diffraction spots (8 μm pitch grating).
As described in Section 3.1, the incidence angle under this condition is near-grazing incidence, and the reflectance of the mirrors and quality of the reflected beams are influenced by their polarization and angle-dependent responses 23. Therefore, the system performance under this condition must be re-verified for stability. Hence, after the mirror translation corresponding to the 8 μm grating, stability testing was conducted using the same procedure, as described in Section 3.2. Approximately 150 frames of \(\pm 1{\textrm{st}}\)-order diffracted beam images were continuously acquired at 1-second intervals, and the centroid positions were calculated. As shown in Fig. 11, the centroid fluctuation of the \(+1{\textrm{st}}\)-order beam in the \(X\)-direction was approximately \(\pm 0.54\) pixels, whereas that of the \(-1{\textrm{st}}\)-order beam was approximately \(\pm 0.51\) pixels. These values were consistent with the \(\pm 0.50\) pixels obtained with the 1.6 μm grating, indicating that the measurement stability of the system remained consistent even under near-glancing incidence at approximately 85°. The short-term variability of the signals was primarily determined by the instability of the pair of adjustable plane mirrors. The difference between the two signal variabilities was caused by differences in the two mirror stabilities. This explains why the two signals had different variabilities, as shown in Figs. 6 and 11. This was caused by changes in the stability of the mirrors after adjustment. Sensitivity tests were performed to assess the sensitivity of the measurement system to angular changes. The sensitivity of the system was determined using the slope of the linear fit. The sensitivities of the \(+1{\textrm{st}}\) and \(-1{\textrm{st}}\) order beams were 2.65 pixels/arc-second and 2.61 pixels/arc-second, respectively. The corresponding resolutions based on the stability test results are summarized in Table 2.
Table 2. Basic characteristics of the angle sensor with the 8 μm pitch grating.

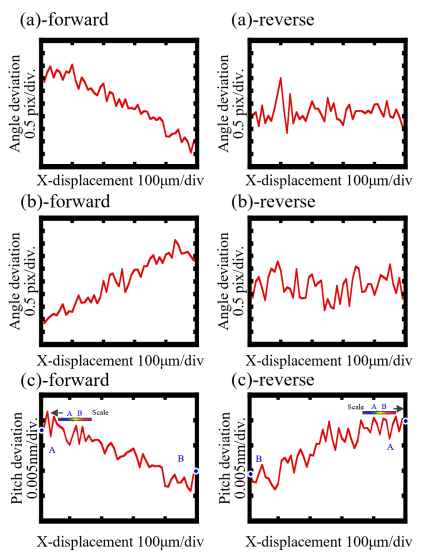
Fig. 12. Pitch deviation obtained in a short-range scanning (8 μm pitch grating). (a) Deviation in the angle of diffraction of the positive beam. (b) Deviation in the angle of diffraction of the negative beam. (c) Pitch deviation calculated from (a) and (b).
For the feasibility and repeatability of the developed angle sensor in grating pitch deviation calibration, short-range bidirectional scanning experiments were performed on the 8 μm-pitch grating. The experimental setup was the same as previously described.
The results of these experiments are presented in Fig. 12. Figs. 12(a) and (b) show the angular changes of the \(\pm 1{\textrm{st}}\)-order diffraction beams during the forward and reverse scans, respectively. Based on these results and Eq. \(\eqref{eq:8}\), the corresponding pitch deviation was calculated, as shown in Fig. 12(c). The calibration results indicated that within the 500 μm range, the peak-to-peak value of the scale grating pitch deviation was approximately 0.30 nm, also exhibiting good repeatability and consistent bidirectional response.
The experiment was also further extended to evaluate the pitch deviation across the entire effective measurement range (90 mm) of the scale grating (8 μm). Figs. 13(a) and (b) show the variation curves of the positive and negative diffraction beam angles, respectively. Based on these results, the pitch deviation over the entire length of the scale grating was calculated; the results are shown in Fig. 13(c). The pitch deviation distribution of the scale grating was obtained after removing linear errors from the raw data, as shown in Fig. 13(d). This value was approximately 2.33 nm. Based on Eq. \(\eqref{eq:13}\), the pitch-deviation curve was obtained, as shown in Fig. 14(b).
The close agreement between the results shown in Figs. 13(d) and 14(b) confirms that the proposed method provides an accurate calibration of the pitch deviation of the scale grating. These results confirm that the proposed system can measure gratings of various pitches while retaining practicality, simplicity, and measurement accuracy.
4. Conclusion
This study proposed a flexible differential angle sensor for calibrating the pitch deviations of linear scale gratings with different nominal pitches ranging from 1.6 to 8 μm. By employing a pair of adjustable plane mirrors to merge the \(\pm1{\textrm{st}}\)-order diffracted beams and capturing them with a single CMOS image sensor, the system eliminates the need for multiple detectors and complex symmetric optics while maintaining a high measurement resolution and improving alignment flexibility and adaptability.
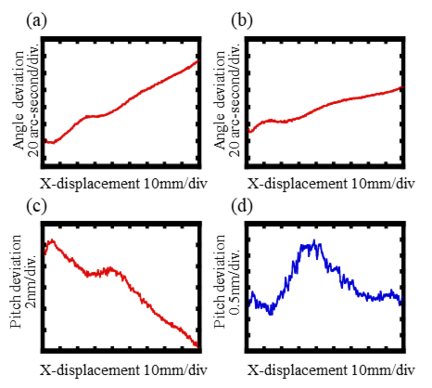
Fig. 13. Pitch deviation acquired during long-range scanning (8 μm pitch grating). (a) Angle deviation of positive-beam diffraction. (b) Angle deviation of negative-beam diffraction. (c) Pitch deviation calculated from sensors reading. (d) Nonlinear components of pitch deviation.
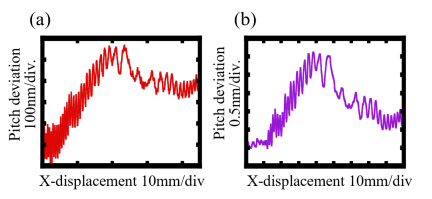
Fig. 14. Pitch deviation measured by a commercial Fizeau interferometer (8 μm pitch grating). (a) Accumulative pitch deviation. (b) Nonlinear components of pitch deviation.
For the 1.6 μm-pitch grating, stability tests showed centroid fluctuations of \(\pm 0.50\) pixels (\(+1{\textrm{st}}\)), and \(\pm 0.50\) pixels (\(-1{\textrm{st}}\)). Short-range scanning achieved a pitch-deviation resolution of approximately 0.015 nm, and measurements over a 90 mm range yielded about 0.03 nm, in close agreement with the results obtained using a commercial Fizeau interferometer (Verifire™, Zygo).
The system’s adaptability was further verified on an 8 μm-pitch grating. Even under near-grazing incidence (\(\sim\)85°), stability tests showed centroid fluctuations of \(\pm 0.54\) pixels (\(+1{\textrm{st}}\)) and \(\pm 0.51\) pixels (\(-1{\textrm{st}}\)). Short-range bidirectional scanning produced a peak-to-peak pitch deviation of approximately 0.30 nm, and measurements over a 90 mm range yielded about 2.33 nm, again consistent with the reference data from the Fizeau interferometer. Owing to the adjustable mirror design, the proposed system can accommodate diffraction gratings with pitches up to 8 μm without changing the optical configuration. These results demonstrate that the proposed method achieves measurement accuracy comparable to that of a commercial Fizeau interferometer while offering structural simplicity, repeatable performance across different grating pitches, and suitability for the in-situ calibration of optical encoders and other precision manufacturing systems.
- [1] W. Gao, S.-W. Kim, H. Bosse, and K. Minoshima, “Dimensional metrology based on ultrashort pulse laser and optical frequency comb,” CIRP Annals, Vol.74, No.2, pp. 993-1018, 2025. https://doi.org/10.1016/j.cirp.2025.04.094
- [2] A. Archenti, W. Gao, A. Donmez, E. Savio, and N. Irino, “Integrated metrology for advanced manufacturing,” CIRP Annals, Vol.73, pp. 639-665, 2024. https://doi.org/10.1016/j.cirp.2024.05.003
- [3] H. Yu, X. Chen, C. Liu, G. Cai, and W. Wang, “A survey on the grating-based optical position encoder,” Optics & Laser Technology, Vol.143, Article No.107352, 2021. https://doi.org/10.1016/j.optlastec.2021.107352
- [4] S. Wang, L. Luo, and X. Li, “Design and parameter optimization of zero position code considering diffraction based on deep learning generative adversarial networks,” Nanomanufacturing and Metrology, Vol.7, Article No.2, 2024. https://doi.org/10.1007/s41871-023-00221-6
- [5] B. Muhutijiang, W. Wei, and K. Qiu, “A new method for non-destructive measuring of grating parameters,” Proc. SPIE, Vol.11188, Article No.1118825, 2019. https://doi.org/10.1117/12.2537840
- [6] V. I. Korotkov, S. A. Pul’kin, A. L. Vitushkin, and L. F. Vitushkin, “Laser interferometric diffractometry for measurements of diffraction grating spacing,” Applied Optics, Vol.35, No.24, pp. 4782-4790, 1996. https://doi.org/10.1364/ao.35.004782
- [7] X. Chen, Y. Shimizu, X. Xiong, Y.-L. Chen, and W. Gao, “Self-calibration of Fizeau interferometer and planar scale gratings in Littrow setup,” Optics Express, Vol.25, No.18, pp. 21567-21582, 2017. https://doi.org/10.1364/OE.25.021567
- [8] F. Meli and R. Thalmann, “Long-range AFM profiler used for accurate pitch measurements,” Measurement Science and Technology, Vol.9, No.7, pp. 1087-1092, 1998. https://doi.org/10.1088/0957-0233/9/7/014
- [9] G. Ahn, Y.-Y. Choi, D. J. Miller, H. Song, K. No, and S. Hong, “Measurement anomaly of step width in calibration grating using atomic force microscopy,” arXiv:1909.09508, 2019. https://doi.org/10.48550/arXiv.1909.09508
- [10] W. Gao and A. Kimura, “A fast evaluation method for pitch deviation and out-of-flatness of a planar scale grating,” CIRP Annals, Vol.59, No.1, pp. 505-508, 2010. https://doi.org/10.1016/j.cirp.2010.03.035
- [11] R. García and R. Pérez, “Dynamic atomic force microscopy methods,” Surface Science Reports, Vol.47, Nos.6-8, pp. 197-301, 2002. https://doi.org/10.1016/S0167-5729(02)00077-8
- [12] T. Kitazume, N. Tashiro, Y. Yamazaki, and Y. Shimizu, “Validation of pitch deviation measurement of a diffraction scale grating using robust and highly-sensitive optical angle sensors,” Precision Engineering, Vol.96, pp. 874-883, 2025. https://doi.org/10.1016/j.precisioneng.2025.08.003
- [13] W. H. Lee, “High-efficiency multiple beam gratings,” Applied Optics, Vol.18, No.13, pp. 2152-2158, 1979. https://doi.org/10.1364/AO.18.002152
- [14] L. Zhu, F. Mehdizadeh, and R. Talebzadeh, “Application of photonic-crystal-based nonlinear ring resonators for realizing an all-optical comparator,” Applied Optics, Vol.58, pp. 8316-8321, 2019. https://doi.org/10.1364/AO.58.008316
- [15] W. Gao and Y. Shimizu, “Optical metrology for precision engineering,” De Gruyter, 2021.
- [16] L. Quan, Y. Shimizu, X. Xiong, H. Matsukuma, and W. Gao, “A new method for evaluation of the pitch deviation of a linear scale grating by an optical angle sensor,” Precision Engineering, Vol.67, pp. 1-13, 2021. https://doi.org/10.1016/j.precisioneng.2020.09.008
- [17] L. Quan, Y. Shimizu, R. Sato, D. W. Shin, H. Matsukuma, A. Archenti, and W. Gao, “Design and testing of a compact optical angle sensor for pitch deviation measurement of a scale grating with a small angle of diffraction,” Int. J. Automation Technol., Vol.16, No.5, pp. 572-581, 2022. https://doi.org/10.20965/ijat.2022.p0572
- [18] J. Wu, Y. Hong, D. W. Shin, R. Sato, L. Quan, H. Matsukuma, and W. Gao, “On-machine calibration of pitch deviations of a linear scale grating by using a differential angle sensor,” Int. J. Automation Technol., Vol.18, No.1, pp. 4-10, 2024. https://doi.org/10.20965/ijat.2024.p0004
- [19] Z. M, Odibat and N. T. Shawagfeh, “Generalized Taylor’s formula,” Applied Mathematics and Computation, Vol.186, Issue 1, pp. 286-293, 2007. https://doi.org/10.1016/j.amc.2006.07.102
- [20] W. Ma, J. Li, S. Liu, Y. Han, X. Liu, Z. Wang, and C. Jiang, “An autocollimator axial measurement method based on the strapdown inertial navigation system,” Sensors, Vol.24, No.8, Article No.2590, 2024. https://doi.org/10.3390/s24082590
- [21] L. P. Salles and D. W. de Lima Monteiro, “Designing the response of an optical quad-cell as position-sensitive detector,” IEEE Sensors J., Vol.10, No.2, pp. 286-293, 2010. https://doi.org/10.1109/JSEN.2009.2033806
- [22] W. Gao, S. W. Kim, H. Bosse, H. Haitjema, Y. L. Chen, X. D. Lu, W. Knapp, A. Weckenmann, W. T. Estler, and H. Kunzmann, “Measurement technologies for precision positioning,” CIRP Annals, Vol.64, No.2, pp. 773-796, 2015. https://doi.org/10.1016/j.cirp.2015.05.009
- [23] M. Born and E. Wolf, “Principles of optics: Electromagnetic theory of propagation, interference and diffraction of light,” 7th edition, Cambridge University Press, 1999.
This article is published under a Creative Commons Attribution-NoDerivatives 4.0 Internationa License.