Research Paper:
Monocular 3D Measurement in Featureless Elongated Structures Using Light-Section Method and Active Laser-Based SfM
Hiroshi Higuchi†, Qi An
 , and Atsushi Yamashita
The University of Tokyo
7-3-1 Hongo, Bunkyo-ku, Tokyo 113-8656, Japan
†Corresponding author

When measuring large, elongated structures such as tunnels, the integration of the local three-dimensional (3D) shapes measured at multiple points using tools such as laser scanners is necessary. However, because tunnel interiors often have smooth, texture-less surfaces, estimating the relative pose between measurement points is difficult. This paper proposes a lightweight 3D measurement method using a single camera and laser projection. The system performs cross-sectional shape measurements using the light-section method and pose estimation using the projected laser features. By introducing a scale optimization approach that minimizes the nearest-neighbor distances between point clouds, accurate global 3D reconstruction is achieved without relying on external sensors. The proposed method enables efficient and precise measurements, even in featureless environments.
1. Introduction
Automated three-dimensional (3D) measurements of large structures are critical for manufacturing and infrastructure inspection. For elongated structures such as tunnels, accurate geometric data are essential for maintenance, safety assessments, and digital twin creation 1. However, tunnel interiors present unique challenges because of their smooth and repetitive surfaces, with no distinctive visual features 2. Traditional 3D reconstruction methods struggle in such environments, making tunnel measurements a particularly demanding application.
Conventional 3D measurement approaches rely on extracting visual features from the environment. These methods estimate the relative poses between the measurement positions using two-dimensional (2D) texture features 3,4 or 3D surface landmarks 5. However, simultaneous localization and mapping (SLAM) systems face significant challenges in featureless environments. Even advanced direct methods, such as large-scale direct (LSD)-SLAM, which track camera motion through photometric error minimization, struggle when distinctive visual cues are absent.
A fundamental challenge in vision systems is scale ambiguity, where the true metric scale cannot be determined from visual information alone. Modern solutions address scale ambiguity using additional sensors or data-driven approaches. Visual-inertial odometry systems integrate inertial measurement unit (IMU) data to provide a metric scale, as demonstrated by Oriented FAST and Rotated BRIEF (ORB)-SLAM3 6. Alternatively, deep-learning methods directly estimate the depth from single images 7,8 and have been extensively applied to structural-health monitoring 9, although these approaches may fail in unfamiliar environments.
Neural rendering techniques have emerged as powerful alternatives. Neural radiance fields 10 and 3D Gaussian splatting 11 achieve impressive reconstruction quality. Though suitable for high-fidelity modeling, these methods require substantial computational resources, making them impractical for lightweight single-camera measurement systems.
Active sensing uses structured light to project artificial features and is a promising solution for featureless environments. The theoretical foundations are well established 12, and practical implementations include multi-camera systems 13, dot-pattern projections 14, and preplaced target approaches 15. Recent advances have focused on improving the data-processing methods 16. However, single-camera active-sensing systems still have fundamental scale ambiguity.
Researchers have developed specialized approaches for tunnel measurements. Xue et al. 17 combined structure from motion (SfM) with direct linear transformation to achieve proper scale reconstruction. Multi-camera structured-light systems have shown success; Zhan et al. 13 achieved high-speed and high-accuracy tunnel profiling. Cooperative robotic systems using omnidirectional laser projections have enabled dense texture-less scanning 18. Panoramic camera approaches have also proven effective 19, whereas neural SLAM methods (such as point-based implicit neural (PIN)-SLAM 20) maintain global consistency for large-scale mapping.
Current approaches have significant practical limitations. Multi-camera and multi-sensor systems increase the complexity, cost, and calibration requirements. External sensors such as IMUs add synchronization challenges. Deep-learning methods may fail in novel environments; neural rendering approaches require excessive computational resources, and single-camera systems cannot resolve scale ambiguities without external reference information—thus limiting their practical applicability.
This paper introduces a novel 3D measurement system that addresses these limitations by using a unique, scale-optimization approach. Our system uses only a single camera and ring-laser projections for both cross-sectional measurements using the light-section method and pose estimation using SfM. The key innovation is a scale-optimization technique that enforces geometric consistency between the cross-sectional and anchored laser point clouds, enabling metric-scale determination without external sensors. This approach provides an efficient and low-cost solution for accurate 3D measurements in elongated featureless environments.
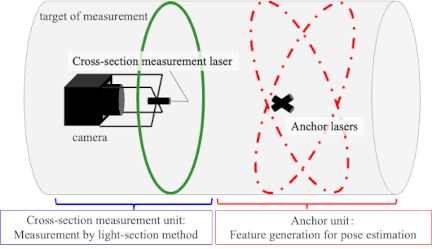
Fig. 1. Overview of the proposed 3D measurement system, consisting of a cross-section measurement unit and an anchor unit. The system uses ring lasers and a single camera to enable both shape acquisition and motion estimation in featureless elongated environments.
2. Proposed Method
An overview of the proposed 3D measurement system is presented in Fig. 1. The system comprises a cross-section measurement unit and an anchor unit.
The cross-section measurement unit is equipped with a camera and ring laser (termed the cross-sectional measurement laser); it uses the light-section method to measure the shape of the cross-sectional area illuminated by the ring laser.
The anchor unit is equipped with two ring lasers (termed anchor lasers) fixed in relation to each other; it generates feature points for motion estimation by the cross-section measurement unit. To generate 2D features regardless of the environmental shape, the anchor lasers project patterns divided at different intervals along the circumference.
Input images are repeatedly captured and the devices are moved (with one device remaining stationary relative to the environment while the other is moved). This pattern is repeated for each movement of the anchor unit followed by multiple movements of the cross-section measurement unit.
In the proposed method, the time \((i,j)\) is the time at which the cross-section measurement unit has moved \(j\) times, after the anchor unit has moved \(i\) times. Here, the total number of anchor unit movements is \(n\), and the total number of cross-section measurement unit movements before the next anchor unit movement after it has moved \(i\) times is \(m_i\). The camera coordinate system of the cross-section measurement unit at time \((i,j)\) is denoted as \(\Sigma_{C_{(i,j)}}\). The acquired camera images are processed to measure the 3D shape of the elongated structures. The processing consists of three main steps: cross-section measurement using the light-section method (Section 2.1), pose estimation using anchor-laser-based SfM (Section 2.2), and scale determination with point cloud integration (Section 2.3).
To clarify the relationship between time and device movement in the proposed method, Fig. 2 provides a schematic illustration. In each measurement cycle, the cross-section measurement unit is moved several times while the anchor unit remains stationary. This pattern is repeated with periodic movement of the anchor unit to new positions. The pose at each time step \((i,j)\) corresponds to the \(j\)-th movement of the cross-sectional unit after the \(i\)-th movement of the anchor unit.
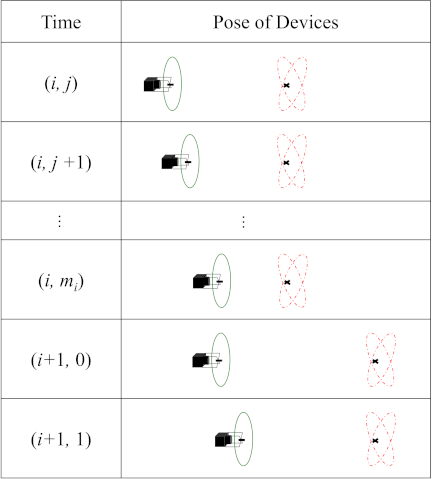
Fig. 2. Illustration of the relationship between time and device movement. The cross-section measurement unit (left) moves multiple times under a fixed anchor unit (right), and the pose at each time step \((i,j)\) is defined accordingly.
2.1. Measurement Using Light-Section Method
Using each camera image captured at each time step as input, the 3D positions of points illuminated by a ring laser in the camera coordinate system are measured using the light-section method. The point cloud coordinates are calculated by triangulation from the 2D points of the ring laser in the image and the pre-calibrated pose relationship between the camera and ring laser.
Let \(\mathbf{\hat p}_{(i,j, k)}\) be the light ray vector of the \(k\)-th 2D point of the ring laser observed in the image at time \((i,j)\). Let the position vector \(\mathbf{n}\) of the foot of the perpendicular line drawn from the camera origin to the plane formed by the ring laser be pre-calibrated as an external parameter. Because the measurement points exist on the plane formed by the laser, the 3D coordinates \({}^{C_{(i,j)}}\mathbf{p}_{(i,j, k)}\) of the \(k\)-th measurement point in the camera coordinate system at times \((i,j)\) can be obtained using the following equation:
2.2. Pose Estimation Using Anchor-Laser Projection
To reconstruct the overall shape, the cross-sectional measurement results obtained at each time point must be transformed into a unified coordinate system. Here, we estimate the coordinate transformation matrix to coordinate system \(\Sigma_{C_{(0,0)}}\).
We first estimate the pose relationships between the cross-section measurement units at times \((i,0)\), \((i,1)\), \((i,2)\), \(\ldots\), \((i,m_i)\) (when the coordinate system of the anchor unit is unchanged). During these time intervals, the laser pattern generated by the anchor unit can be considered a static feature. Therefore, the pose of the cross-section measurement unit and the 3D coordinates of the feature points can be estimated using SfM, with matched feature points between the acquired images as the input. We employ a standard five-point algorithm to estimate the essential matrix and recover the relative pose up to an unknown scale.
However, due to scale ambiguity, the coordinate transformation \({}^{C_{(i,0)}}\mathbf{T}_{C_{(i,j)}}\) and the 3D coordinates \({}^{C_{(i,0)}}\mathbf{q}_{(i,l)}\) of the \(l\)-th feature point are obtained as follows using the unknown parameter \(s_i\) common to this time series:
\(\mathbf{R}_{(i,j)}\), \(\mathbf{\hat t}_{(i,j)}\), and \(\mathbf{\hat q}_{(i,l)}\) are parameters estimated using SfM when the scale is fixed. \(\mathbf{R}_{(i,j)}\) and \(\mathbf{\hat t}_{(i,j)}\) represent the rotation and translation transformations between times \((i,0)\) and \((i,j)\) of the cross-section measurement unit, respectively. \(\mathbf{\hat q}_{(i,l)}\) represents the 3D coordinates of the \(l\)-th feature point in \(\Sigma_{C_{(i,0)}}\). Therefore, the coordinate transformation \({}^{C_{(i,0)}}\mathbf{T}_{C_{(i,j)}}\) can be expressed as a function \(\mathbf{G}_{(i,j)}(s_i)\) with only one variable \(s_i\) as an unknown parameter.
Due to the motion constraint \(\Sigma_{C_{(i,m_i)}}=\Sigma_{C_{(i+1,0)}}\), the coordinate transformation \({}^{C_{(0,0)}}\mathbf{T}_{C_{(i,j)}}\) can be expressed as a function \(\mathbf{H}_{(i,j)}(s_0, \ldots, s_i)\) with parameters \((s_0, \ldots, s_i)\) as follows:
Note that when \(i=0\), the product \(\prod_{k=0}^{-1}\) becomes the identity matrix, and the product operation is performed sequentially from left to right in ascending index order.
2.3. Scale Determination and Integration
In our method, the scale parameters \((s_0, \ldots, s_{n-1})\) are determined by enforcing geometric consistency between the point clouds obtained using the anchor lasers and those obtained using the cross-section laser. The metric scale can be estimated without using additional external sensors—by exploiting the fact that the anchor-laser points are on the same surface as the cross-sectional profile.
To integrate the cross-sectional shapes at individual times, it is necessary to determine the scale parameters \((s_0, \ldots, s_{n-1})\) in Eq. \(\eqref{eq:U0020h}\). By applying Eq. \(\eqref{eq:U0020h}\), the measurement points \({}^{C_{(i,j)}}\mathbf{p}_{(i,j, k)}\) obtained by the light-section method are transformed to the \(\Sigma_{C_{(0,0)}}\) coordinate system as follows:
When transformed to the \(\Sigma_{C_{(0,0)}}\) coordinate system, the real-scale 3D coordinates of the anchor laser measured during motion estimation become
Let \(e_{(i,l)}(s_0, \ldots, s_i)\) be the nearest-neighbor distance when searching for the nearest-neighbor point to each anchor-laser point \({}^{C_{(0,0)}}\mathbf{q}_{(i,l)}\) from all ring-laser point clouds consisting of \({}^{C_{(0,0)}}\mathbf{p}_{(i,j, k)}\). Because the anchor-laser point cloud and the measurement point cloud obtained by the light-section method are point clouds on the same static measurement target surface, when the correct scale is given, the sum of nearest-neighbor distances \(E(s_0, \ldots, s_{n-1})\) in the following equation becomes minimum:
Therefore, the scale can be determined by optimizing \((s_0, \ldots, s_{n-1})\) using \(E(s_0, \ldots, s_{n-1})\) as an evaluation function. By substituting the optimized scale parameters into Eq. \(\eqref{eq:U0020wp}\), the cross-sectional measurement results at any time can be transformed into a unified coordinate system, obtaining the global 3D shape.
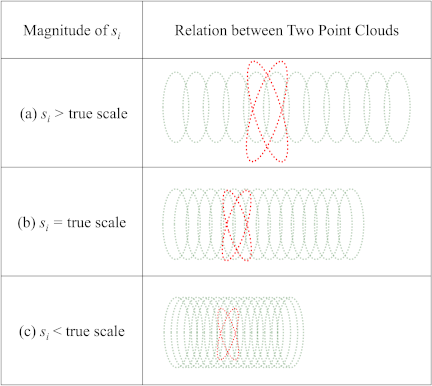
Fig. 3. Relationship between the scale parameter \(s_i\) and the alignment of the \(i\)-th point clouds. Case (a): \(s_i\) is larger than the true scale. Case (b): \(s_i\) matches the true scale. Case (c): \(s_i\) is smaller than the true scale. In each case, green dots represent cross-sectional point clouds obtained using the light-section method, and red dots represent anchor-laser point clouds. Proper alignment is observed in Case (b), where the scale is correct.
Figure 3 illustrates the relationship between the estimated scale parameter \(s_i\) and the alignment quality of the point clouds. When the scale is overestimated (Fig. 3(a)), the cross-sectional point clouds are overly expanded and fail to align with the anchor points. Conversely, underestimation (Fig. 3(c)) causes compression and misalignment. The correct scale estimation (Fig. 3(b)) results in an accurate overlap between the two types of point clouds. This validates the use of nearest-neighbor distance minimization as a reliable scale-optimization criterion.
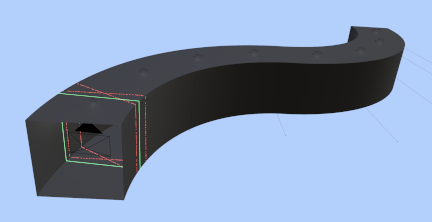
Fig. 4. Overview of the simulated measurement environment in Blender. The black pyramid indicates the camera; the green solid line is the ring laser for cross-section measurement (light-section method); the red lines with randomly spaced segments are the anchor lasers used for pose estimation. The interior represents a featureless elongated structure.
3. Experiment
3.1. Simulation Experiment
To verify the effectiveness of the proposed method, we simulated a 3D measurement experiment using the 3D computer graphics software Blender (Fig. 4).
The cross-section measurement unit consisted of a camera and a green-ring laser. The camera had a sensor size of 35 mm, horizontal field of view of 140°, and resolution of 3,840 px \(\times\) 2,160 px. The cross-sectional measurement laser was positioned 2 m from the camera origin, and the laser plane was perpendicular to the optical axis of the camera.
The patterns of the two red-ring anchor lasers were divided at random intervals along the circumference. The anchor lasers were positioned such that the angle between their planes was 30°.
The measurements were conducted inside an S-shaped curved tunnel structure with a square cross-section of 2 m \(\times\) 2 m. The tunnel was formed by bending a rectangular tube along a curved path with a radius of 11.5 m. The measurement device was moved along the curved path while maintaining its orientation tangential to the curve. One movement loop comprised 10 movements of the cross-section measurement unit along the curved trajectory in 0.2° increments, followed by a single 2° movement of the anchor unit. This movement loop was repeated 87 times.
Figure 5 shows the 3D point clouds obtained using the proposed method. The cross-sectional measurement laser points obtained using the light-section method and anchor laser points obtained using SfM are displayed as green and red point clouds, respectively. The measurement results confirmed that the S-shaped curved tunnel could be reconstructed at the real scale. In addition, we verified that the proposed scale-optimization method determined the scale such that the anchor-laser points were positioned on the planes formed by the ring-laser points.
To evaluate measurement accuracy, we calculated the Euclidean distance between the true wall surface and the cross-sectional measurement laser points; the mean error was 59.9 mm. This error is thought to arise from the accumulation of slight inaccuracies in pose estimation over the 87 measurement loops.
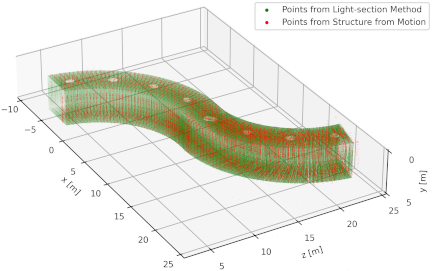
Fig. 5. 3D point cloud reconstruction results from the simulation experiment. The green points represent the cross-section laser measurements, and the red points represent anchor-laser detections used for motion estimation. The reconstructed shape matches the ground truth geometry.
3.2. Real Experiment
We experimentally verified the effectiveness of the proposed method in a long, featureless, and real environment.
The cross-section measurement unit (Fig. 6) comprised a 35-mm sensor digital camera (SONY, \(\alpha\)7S) with a 16-mm focal-length, F2.8 maximum-aperture fisheye lens (SAL16F28). A single green-ring laser was used in this setup. In the anchor unit (Fig. 6), two green-ring lasers were fixed such that the patterns intersected. A slit-type filter was installed in the anchor unit to form an intermittent pattern in the circumferential direction. A microcontroller board (Arduino Zero) controlled the lighting of each laser to blink alternately, such that sequential frames with only the reflections from each laser could be captured.
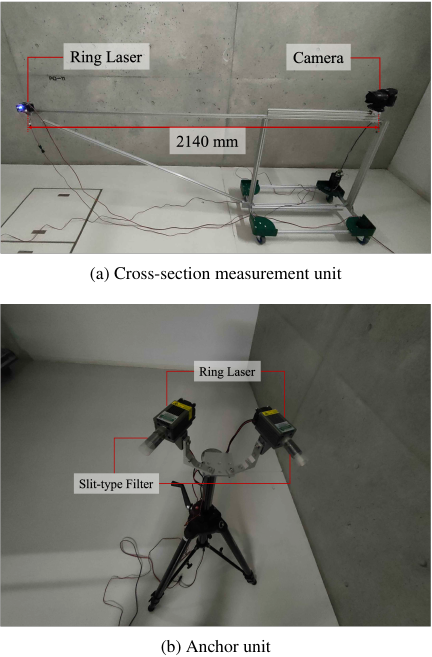
Fig. 6. Physical measurement devices used in the real-world experiment. (a) The cross-section unit combines a digital camera and green ring laser. (b) The anchor unit consists of two green ring lasers with slit filters for pattern differentiation.
The measurement target was a hallway on the first basement floor of the Environmental Studies Building at the Kashiwa Campus of the University of Tokyo (Fig. 7). To capture videos, each measurement device was repeatedly moved as follows:
-
The anchor unit was moved about 2 m at a time.
-
The cross-section measurement unit was moved continuously for about 2 m.
-
The units were moved forward from the proximity of the hallway entrance, until the ring lasers illuminated the far door. The proposed method was implemented for 3D measurements using captured time-series images as the input.
In this experiment, the measurement process involved alternating movements of the cross-section and anchor units. The total measurement distance was about 16 m, and the entire scanning process took about 8 min. To distinguish between the lasers, the cross-sectional and anchor lasers were blinked in opposite phases at 7.4925 Hz. With a camera frame rate of 29.97 fps, we captured images every two frames such that the frames alternated between showing only the anchor lasers or only the cross-sectional laser. The total processing time for the data set was about 75 min. Fig. 8 shows the scene during the measurement video acquisition.
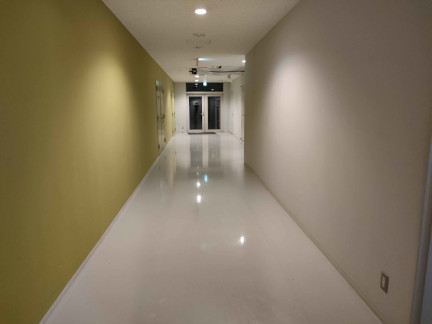
Fig. 7. Real-world hallway used as the measurement target. The experiment was conducted in a corridor on the first basement floor of the Environmental Studies Building at the University of Tokyo.
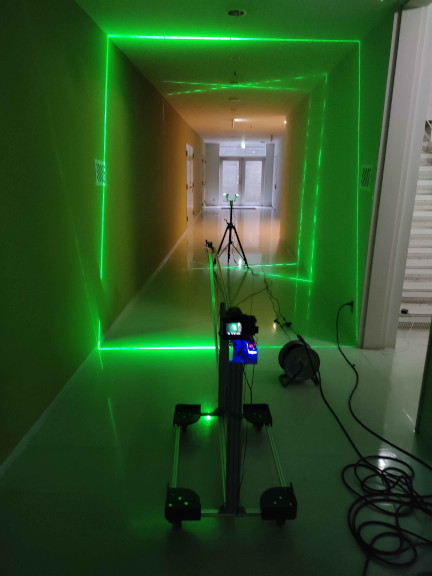
Fig. 8. Scene during the real-world measurement. The cross-section and anchor units are operated sequentially while the hallway is scanned with laser patterns.
The results of the 3D measurements in the real environment used in the experiment are shown in Fig. 9. The cross-sectional measurement laser point cloud obtained using the light-section method and the anchor-laser point cloud obtained using SfM are displayed as green and red point clouds, respectively.
The top view of the hallway selected as the measurement target is presented in Fig. 10. The measured and actual distances were compared and evaluated, as shown in the figure.
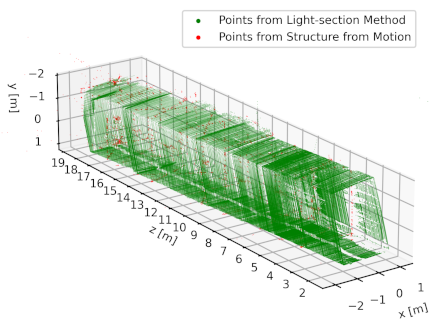
Fig. 9. Reconstruction results from the real-world experiment. The green and red point clouds represent the cross-section and anchor-laser measurements, respectively, visualized in the unified coordinate system.
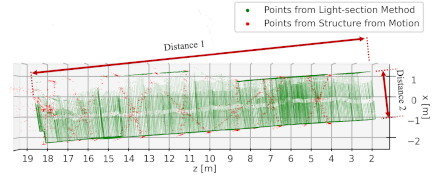
Fig. 10. Top-down view of the reconstructed hallway point cloud. The measured geometry aligns closely with the actual structure, validating the effectiveness of our proposed method in real environments.
Table 1. Comparison of measured distances and actual reference values in the real-world hallway. Distance 1 indicates the total hallway length, while Distance 2 represents the hallway width.

Table 1 lists the measured and actual distances in the hallway. Distance 1 represents the total length of the hallway (about 16 m), whereas Distance 2 represents the width of the hallway (about 2.3 m). For Distance 1, the measured value was 15,672 mm, compared with the ground truth of 16,025 mm. For Distance 2, the measured value was 2,312 mm compared with the ground truth of 2,315 mm. The measurement results confirm that the proposed method enables 3D measurements with an accuracy of 353 mm (2.2%) for long distances and 3 mm (0.13%) for short distances in real environments.
3.3. Comparison and Discussion
Simulations and real-environment experiments were conducted to evaluate the proposed method. The simulation was designed to rigorously assess the performance of the method in a featureless environment with complex motions (including rotation) that are difficult to execute precisely in real environments. The real-world experiment focused on verifying system applicability to long, elongated structures (such as tunnels) which are the primary target applications.
The accuracy of the results in the real-world experiment was lower than that in the simulation. We attribute this primarily to the reduced precision of the SfM-based pose estimation and scale determination in the real environment. While the simulation provided ideal feature points from the anchor lasers, the real-world environment contained background textures and ambient light, which may have introduced noise into the feature-tracking process. Furthermore, scale optimization relies on the assumption that the feature points from SfM and surface points from the light-section method lie on the same geometric surface. In the real experiment, depth estimation errors, particularly for feature points with a small parallax, likely introduced inconsistencies that affected the scale-optimization accuracy. Reducing these errors is a key challenge for future studies.
From a practical perspective, improving the efficiency of both the measurement and processing is essential. In the current configuration, the temporal resolution of the scan is limited by the camera frame rate. Increasing the scanning resolution would require the handling of motion blur at increased moving speeds. Alternatively, increasing the frame rate or employing different methods for laser separation—such as using different colors or modulation frequencies instead of temporal blinking—could allow faster movement without compromising image quality. On the processing side, two factors dominate the total computation time.
Laser detection, feature extraction, and matching grow linearly with the number of captured frames. The current pipeline runs in a single process; we expect a substantial speed-up by parallelizing these steps.
The cost of the scale-optimization stage can be reduced through improved initialization and optimization strategies.
4. Conclusion
This study proposed a 3D measurement method for elongated and featureless environments using a light-section method combined with laser-projection based pose estimation. The system uses only a single camera and ring lasers to achieve both cross-sectional shape measurement and motion estimation, even in environments with minimal texture or geometric features.
To address the scale ambiguity of monocular vision-based motion estimation, we introduced a scale-optimization technique that minimizes the distance between point clouds from different laser projections. This approach enabled the integration of local measurements into a unified coordinate system without the need for additional external sensors.
The simulation results confirmed that the proposed method accurately reconstructed known geometric environments with millimeter-level precision. Real-world experiments further demonstrated its practicality by achieving measurement accuracies of 2.2% for long-range distances and 0.13% for short-range distances in actual hallway settings.
These results demonstrated that the proposed system offers a simple, efficient, and robust solution for the 3D measurement of elongated featureless environments. Future work will focus on reducing the cumulative error and expanding its applicability to more complex settings.
Acknowledgments
This work was supported in part by JSPS KAKENHI Grant Number 25K22112.
- [1] C. Boje, A. Guerriero, S. Kubicki, and Y. Rezgui, “Towards a semantic construction digital twin: Directions for future research,” Automation in Construction, Vol.114, Article No.103179, 2020. https://doi.org/10.1016/j.autcon.2020.103179
- [2] J. Engel, T. Schöps, and D. Cremers, “LSD-SLAM: Large-scale direct monocular SLAM,” European Conf. on Computer Vision, pp. 834-849, 2014. https://doi.org/10.1007/978-3-319-10605-2_54
- [3] B. Zheng, T. Oishi, and K. Ikeuchi, “Rail sensor: A mobile lidar system for 3D archiving the bas-reliefs in Angkor Wat,” IPSJ Trans. on Computer Vision and Applications, Vol.7, pp. 59-63, 2015. https://doi.org/10.2197/ipsjtcva.7.59
- [4] A. Duda, J. Schwendner, and C. Gaudig, “SRSL: Monocular self-referenced line structured light,” Proc. of the 2015 IEEE/RSJ Int. Conf. on Intelligent Robots and Systems, pp. 717-722, 2015. https://doi.org/10.1109/IROS.2015.7353451
- [5] R. Kaijaluoto and A. Hyyppä, “Precise indoor localization for mobile laser scanner,” The Int. Archives of the Photogrammetry, Remote Sensing and Spatial Information Sciences, Vol.XL-4/W5, pp. 1-6, 2015. https://doi.org/10.5194/isprsarchives-XL-4-W5-1-2015
- [6] C. Campos, R. Elvira, J. J. G. Rodríguez, J. M. M. Montiel, and J. D. Tardós, “ORB-SLAM3: An accurate open-source library for visual, visual-inertial and multi-map SLAM,” IEEE Trans. on Robotics, Vol.37, No.6, pp. 1874-1890, 2021. https://doi.org/10.1109/TRO.2021.3075644
- [7] C. Godard, O. Mac Aodha, M. Firman, and G. Brostow, “Digging into self-supervised monocular depth estimation,” Proc. of the IEEE/CVF Int. Conf. on Computer Vision, pp. 3827-3837, 2019. https://doi.org/10.1109/ICCV.2019.00393
- [8] R. Ranftl, K. Lasinger, D. Hafner, K. Schindler, and V. Koltun, “Towards robust monocular depth estimation: Mixing datasets for zero-shot cross-dataset transfer,” IEEE Trans. on Pattern Analysis and Machine Intelligence, Vol.44, No.3, pp. 1623-1637, 2022. https://doi.org/10.1109/TPAMI.2020.3019967
- [9] J. Jia and Y. Li, “Deep learning for structural health monitoring: Data, algorithms, applications, challenges, and trends,” Sensors, Vol.23, No.21, Article No.8824, 2023. https://doi.org/10.3390/s23218824
- [10] B. Mildenhall, P. P. Srinivasan, M. Tancik, J. T. Barron, R. Ramamoorthi, and R. Ng, “NeRF: Representing scenes as neural radiance fields for view synthesis,” Communications of the ACM, Vol.65, No.1, pp. 99-106, 2021. https://doi.org/10.1145/3503250
- [11] B. Kerbl, G. Kopanas, T. Leimkühler, and G. Drettakis, “3D Gaussian splatting for real-time radiance field rendering,” ACM Trans. on Graphics, Vol.42, No.4, Article No.139, 2023. https://doi.org/10.1145/3592433
- [12] J. Geng, “Structured-light 3D surface imaging: A tutorial,” Advances in Optics and Photonics, Vol.3, No.2, pp. 128-160, 2011. https://doi.org/10.1364/AOP.3.000128
- [13] D. Zhan, L. Yu, J. Xiao, and T. Chen, “Multi-camera and structured-light vision system (MSVS) for dynamic high-accuracy 3D measurements of railway tunnels,” Sensors, Vol.15, No.4, pp. 8664-8684, 2015. https://doi.org/10.3390/s150408664
- [14] X. Yang and G. Jiang, “A practical 3D reconstruction method for weak texture scenes,” Remote Sensing, Vol.13, No.16, Article No.3103, 2021. https://doi.org/10.3390/rs13163103
- [15] C. Yao, S. He, H. Chen, X. Zhang, and Z. Wang, “Pose estimation of nonoverlapping FOV cameras for shield tunnel convergence measurement,” Measurement, Vol.242, Article No.116101, 2025. https://doi.org/10.1016/j.measurement.2024.116101
- [16] J. Wang and Z. Zhou, “The 3D reconstruction method of a line-structured light vision sensor based on composite depth images,” Measurement Science and Technology, Vol.32, No.7, Article No.075101, 2021. https://doi.org/10.1088/1361-6501/abcf64
- [17] Y. Xue, S. Zhang, M. Zhou, and H. Zhu, “Novel SfM-DLT method for metro tunnel 3D reconstruction and visualization,” Underground Space, Vol.6, No.2, pp. 134-141, 2021. https://doi.org/10.1016/j.undsp.2020.01.002
- [18] T. Igaue, T. Haymizu, H. Higuchi, M. Ikura, K. Yoshida, S. Yamanaka, T. Yamaguchi, H. Asama, and A. Yamashita, “Cooperative 3D tunnel measurement based on 2D–3D registration of omnidirectional laser light,” J. of Field Robotics, Vol.40, No.8, pp. 2042-2056, 2023. https://doi.org/10.1002/rob.22241
- [19] M. Janiszewski, M. Torkan, L. Uotinen, and M. Rinne, “Rapid photogrammetry with a 360-degree camera for tunnel mapping,” Remote Sensing, Vol.14, No.21, Article No.5494, 2022. https://doi.org/10.3390/rs14215494
- [20] Y. Pan, X. Zhong, L. Wiesmann, T. Posewsky, J. Behley, and C. Stachniss, “PIN-SLAM: LiDAR SLAM using a point-based implicit neural representation for achieving global map consistency,” IEEE Trans. on Robotics, Vol.40, pp. 4045-4064, 2024. https://doi.org/10.1109/TRO.2024.3422055
This article is published under a Creative Commons Attribution-NoDerivatives 4.0 Internationa License.