Research Paper:
Evaluation of Friction Characteristics Between Tool and Workpiece Using Cutting Resistance During Feed Deceleration in Interrupted Cutting—Analysis of the Definition of Calculated Friction Characteristic Values—
Isaí Espinoza Torres*,**
 , Ryutaro Tanaka*,†
, Israel Martínez Ramírez**
, Katsuhiko Sekiya*, and Keiji Yamada*
, Ryutaro Tanaka*,†
, Israel Martínez Ramírez**
, Katsuhiko Sekiya*, and Keiji Yamada*
*Graduate School of Advanced Science and Engineering, Hiroshima University
1-4-1 Kagamiyama, Higashi-hiroshima, Hiroshima 739-8527, Japan
†Corresponding author
**Mechanical Engineering Department, University of Guanajuato
Salamanca, Mexico

This study investigated the resistance forces acting during the feed deceleration of an interrupted cutting process, aiming to develop a methodology for characterizing the friction among the cutting tool, cutting fluid, and different workpiece materials. The cutting forces were analyzed to calculate the normal and tangential forces under three conditions: constant feed cutting, deceleration, and zero-cutting state. Resistance forces persisted despite the absence of active cutting. The behavior of zero-cutting forces depended on the workpiece material. A method was proposed to estimate ploughing forces, assuming a direct relationship with the frictional properties of the tool flank face. In addition, a procedure was developed to characterize the friction on the tool rake face by analyzing the relationship between normal and tangential forces obtained experimentally. By identifying inflection points in the –Fn relationship, the frictional components acting on the tool rake face could be decomposed. Furthermore, the influence of the uncut chip thickness on the stability of the cutting resistance was evaluated. The results revealed a direct correlation between normal forces and frictional characteristics under the zero-cutting conditions. Finally, the study assessed the impact of different cutting fluids (dry, water-soluble oil, and vegetable oil) on frictional behavior, exhibiting significant changes in the interaction between the workpiece, cutting fluid, and tool.
1. Introduction
Measuring cutting forces helps understand the cutting process, making it essential to consider them during milling. Excessive cutting forces can accelerate tool wear, leading to frequent tool changes and production downtime, ultimately affecting manufacturing costs 1. Furthermore, the surface quality is affected by the formation of waviness and vibration marks 2. Understanding the cutting forces also helps predict wear mechanisms and determine the friction coefficients at the chip-tool interface 3. Analyzing friction at the interface between the tool and the chip is challenging owing to the interplay of various complex physical phenomena 4. Different cutting fluids and application methods have been employed to mitigate the effect of friction during machining 5. These fluids cool and lubricate the contact zones between the tool and the chip, which helps improve the surface quality of the workpiece and significantly reduce tool wear 6. Experimental tribological methods have been used to study friction and cutting fluids. Tortora and Veeregowda 7 investigated the stability of lubricant films using a modified ball-on-disk technique. The main objective was to evaluate the friction, wear, and stability of the films under sliding contact conditions. Several authors studied similar techniques 8,9,10,11; however, the results obtained are often extrapolated from simplified test conditions that did not replicate the cutting process 12. Directly analyzing the interaction between the cutting tool, workpiece, and lubricant during a real cutting process by measuring the cutting force components could be considered a more representative approach. This methodology reproduces the tribological conditions typical of machining, including high contact pressures, localized temperatures, and sliding velocity generated by the chip flow. Decomposing the resultant cutting forces enables the estimation of friction forces acting on both the rake and flank face of the tool. Therefore, this approach can yield more reliable insights than those derived from external tribological tests, which often fail to capture the dynamic and thermal complexities of actual machining environments.
A transition occurs between the shearing and ploughing regimes during cutting 13,14. One of the factors influencing whether the material flows along the rake or flank face, resulting in either elastic recovery or plastic deformation, is the uncut chip thickness 15. Several authors have proposed methods for evaluating cutting forces at varying uncut chip thicknesses while maintaining a constant cutting speed 16,17,18,19. However, these approaches typically require CNC equipment, and the determination of the cutting forces at each chip thickness involves multiple experimental trials. In contrast, this study proposes a method for estimating the cutting forces by controlling the uncut chip thickness within a single experimental test in the conventional milling machine. The cutting forces in a face milling operation of a conventional milling machine were analyzed during a controlled deceleration phase to investigate the transition of these forces as the uncut chip thickness was varied, enabling the identification of the ploughing force components associated with the flank and rake faces. This transition was examined under various machining conditions, which revealed distinct trends depending on the material used. The inflection points were analyzed to determine the transition from ploughing to shear-dominated cutting regimes. Finally, the behavior of these forces was further evaluated under different environmental conditions, offering valuable insights into their influence on the machining process. This method offers an efficient, more accessible alternative for assessing the frictional behavior of different materials and cutting fluids under conditions representative of machining processes.
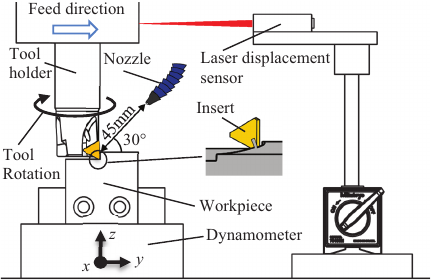
Fig. 1. Schematic of experimental setup.
2. Experimental Procedure
2.1. Experimental Setup
Figure 1 illustrates a schematic of the experimental setup. Milling experiments were performed using a conventional vertical milling machine (model 2UMC, Niigata), equipped with a dynamometer (model 9257B, Kistler) to measure the three orthogonal components (\(F_{x}\), \(F_{y}\), \(F_{z}\)) of cutting forces on the workpiece. The cutting tool was fitted with a single insert. The feed direction, indicated by the arrow, represents the relative motion between the tool and the workpiece. Additionally, a displacement sensor mounted on the machine bed recorded the tool displacement as a function of time.
The cutting conditions for the cutting force measurement experiments are listed in Table 1.
The experiments were conducted using six materials: SCM435, SUS304, C3604, Ti-6Al-4V, Alloy625, and Alloy718. Uncoated cutting inserts with a cutting-edge radius of 3 μm, mounted on a Kyocera MTES335 tool holder, were used. A new insert was used for each test to minimize wear effects and ensure data repeatability. Fig. 2 illustrates the evolution of cutting forces and tool displacements during machining. The graph shows the cutting resistance \(F_y\) (the cutting forces \(F_x\) and \(F_z\) exhibited similar behaviors) for each test. Initially, a constant cutting force pattern was observed, until the tool reached the section where the feed was stopped. Due to machine inertia, the feed undergoes gradual deceleration before completely stopping; this transition is represented by the green shaded area. Subsequently, the system reached a state of feed stop, entering a feed stop–dwell phase, where cutting resistance remained but at reduced magnitudes. The upper-right schematic shows the process configuration. In this figure, the tool advances along the \(y\)-axis while the workpiece rotates. The feed stop region, which influences the evolution of cutting resistance, is highlighted in red. Notably, the cutting resistance persisted even after the feeding was stopped. This suggests that if the zero cutting, i.e., the chip thickness approaches zero, is considered, this phase can be used to evaluate the friction characteristics between the tool flank face and the workpiece, as well as the influence of the cutting fluid.
Table 1. Cutting conditions.

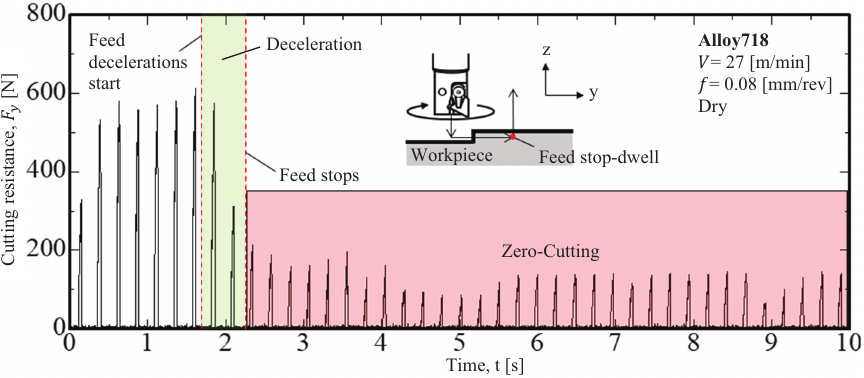
Fig. 2. The resistance force \(F_{y}\) measured during the different states.
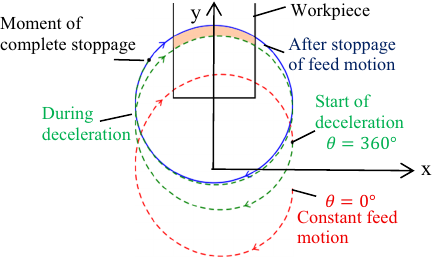
Fig. 3. Trajectory of the tool edge during transition from constant feed to complete stop.
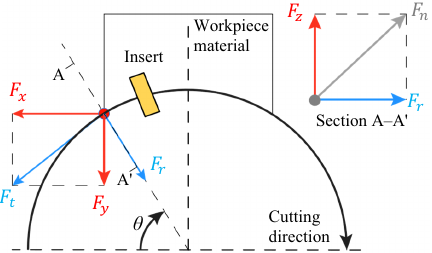
Fig. 4. Transformation of resistance forces on the insert.
Figure 3 shows the tool trajectory under different experimental conditions. In the case of constant-feed (highlighted in red), the tool follows a trochoidal path, and its position can be described by Eq. \(\eqref{eq:1}\), where \(f_0\) is the constant feed rate [mm/s], \(\omega\) is the spindle angular velocity [rad/s], \(R\) is the tool radius, and \(t\) is the time [s]. During the deceleration stage (highlighted in green), the feed rate decreases from \(f_0\) to zero and can be expressed as a time-dependent function \(f(t)\). In this case, the tool trajectory can be described using Eq. \(\eqref{eq:2}\).
The cutting forces can be synchronized with the tool rotation angle (\(\theta\)) for different experimental conditions by obtaining the tool position at each instant.
2.2. Calculation of Cutting Forces in Tangential–Normal System
Figure 4 depicts the calculation of the cutting forces in a tangential-normal system. In this calculation, forces measured by the dynamometer (\(F_x\), \(F_y\), \(F_z\)) are transformed into a tangential-radial system (\(F_t\), \(F_r\), \(F_z\)) fixed to the tool edge moving along the cutting direction, forming an angle (\(\theta\)) relative to the feed direction. Eqs. \(\eqref{eq:3}\) and \(\eqref{eq:4}\) describe the transformation from Cartesian to tangential-radial force components. Eq. \(\eqref{eq:3}\) employs a transformation matrix as a function of \(\theta\) to calculate the tangential (\(F_t\)) and radial forces. Eq. \(\eqref{eq:4}\) defines the magnitude of the normal force (\(F_n\)) as the resultant of the axial (\(F_z\)) and radial forces, as described in Section A–\(\textrm{A}'\).
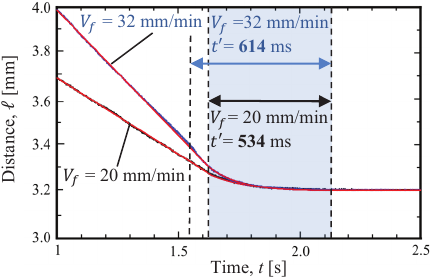
Fig. 5. Distance data during feed deceleration.
2.3. Calculation of Uncut Chip Thickness During Feed Deceleration
Figure 5 shows the experimental data obtained by the laser displacement for two feed rates (\(V_f\); \(V_{f}=20\) and 32 mm/min), exhibiting a progressive displacement reduction during a constant feed.
When the feed is stopped, a transient deceleration phase occurs before chip dissipation is completed (blue shaded area). Significant differences in the deceleration time (534 ms for 20 mm/min and 614 ms for 32 mm/min) indicated that higher feed rates resulted in longer deceleration times.
Figure 6 shows how the distance is measured during the deceleration phase and how this behavior can be described by an equation based on an exponential relationship. This function was selected because of its monotonically decreasing trend, which eventually converges to a constant value. Here, \(l_1\) represents the distance at the start of feed deceleration [mm], and \(K\) is a specific constant. The variable \(t\) corresponds to the time from the start of feed deceleration [s], and \(t'\) denotes the total time interval from the beginning of deceleration until complete stoppage. The proposed model exhibits a high correlation coefficient, demonstrating its reliability. The feed rate in the feed deceleration section was determined by differentiating the equation. Finally, the uncut chip thickness was calculated based on the obtained data and by analyzing the tool trajectory 20, as shown in Fig. 7(a).
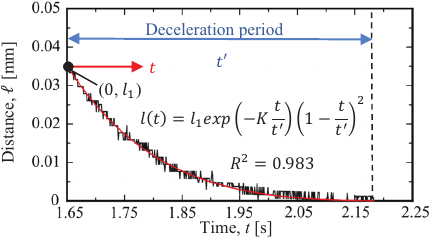
Fig. 6. Function of distance data in feed deceleration.
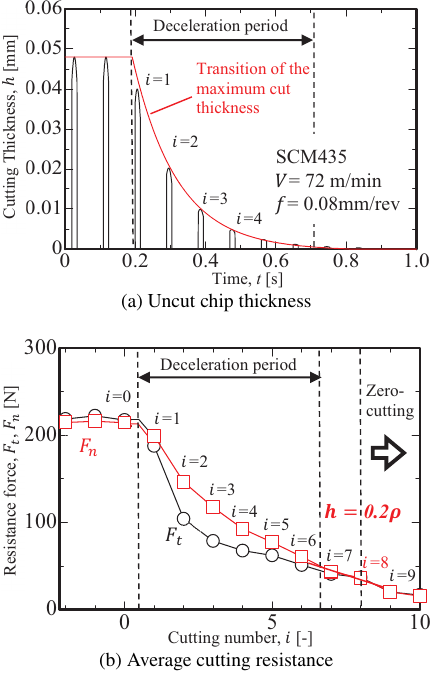
Fig. 7. Method for estimating ploughing force from cutting resistance under zero-cutting conditions.
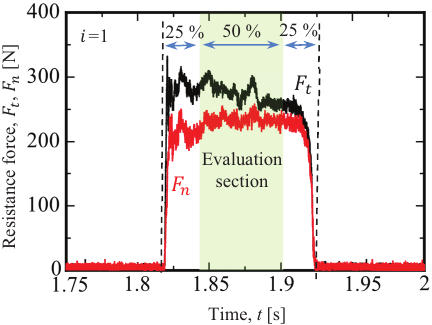
Fig. 8. Evaluation section in each revolution.
2.4. Evaluation Range and Trajectory of Average Resistance During Cutting
Figure 8 presents the dynamic behavior of cutting resistance during an interrupted cutting process. Two main force components are represented in the figure: the tangential cutting force (\(F_t\)) and the normal force (\(F_n\)), highlighted in black and red, respectively. Two initial and final zones, each covering 25% of the cutting period, were identified. These sections were excluded because they corresponded to the transient regions associated with the beginning and end of the interrupted cutting process. The green-marked interval represents the region used to evaluate and properly characterize the process, allowing for reliable data that reflect the actual machining conditions without the influence of transitional phases. The cut corresponded to \(i=1\) for an SCM435, as noticed in Figs. 9(c) and (d).
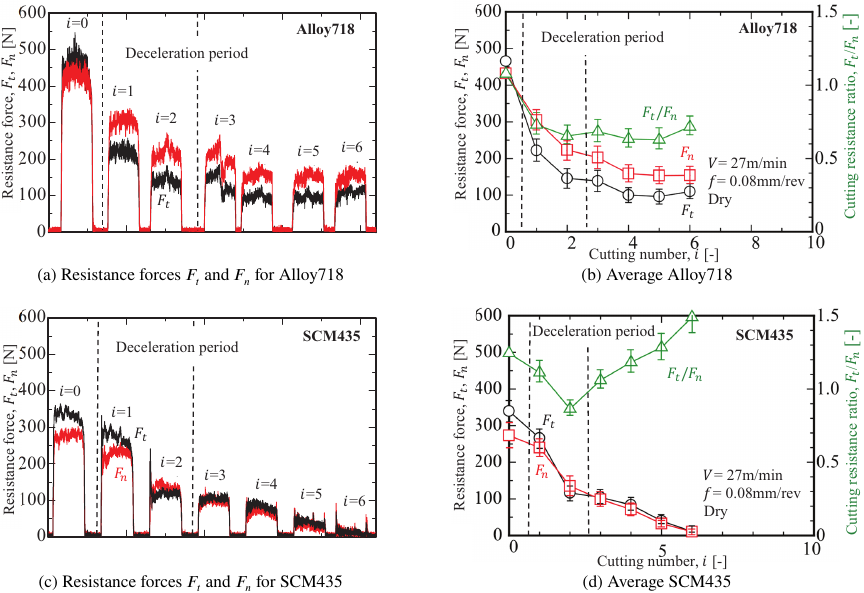
Fig. 9. Variation in resistance forces observed after feed stop, influenced by the work material.
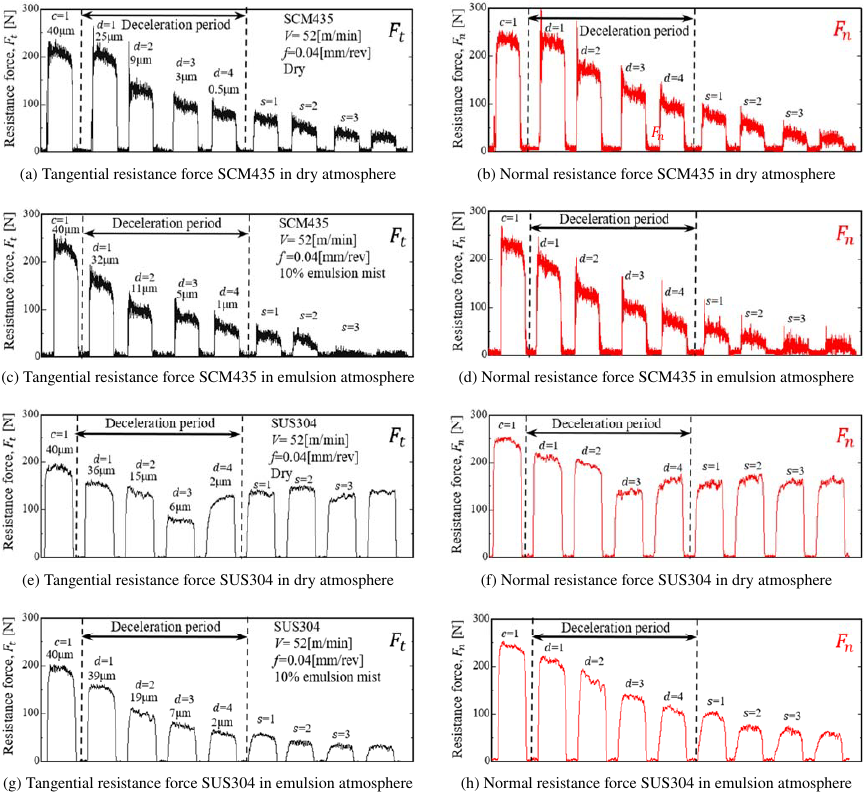
Fig. 10. Transition of resistance forces \(F_n\) and \(F_t\) after feed motion starts to decelerate.
3. Results and Consideration
3.1. Cutting Resistance Before and After Cutting Interruption
Figure 10 illustrates the transition of the cutting forces through three distinct phases: stable cutting condition (\({c=1}\)), deceleration period (\(d=1\) to 4), and zero-cutting phase (\(s=1\) to 3) for SCM435 and SUS304, highlighting the differences in their cutting resistance behavior. These variations demonstrate that each material responds differently as the feed rate decreases, allowing the proposal of an experimental method for evaluating friction under real machining conditions. This method considered the actual contact pressure, temperature, cutting speed, and lubrication, as well as the effects of adhesion and detachment of the built-up material. However, these effects were limited because only 20 cuts were performed before the feed stopped, providing representative values of the interaction between the tool rake face and work material. For SCM435, the cutting forces plummeted after the zero-cutting point, and this effect became more evident under lubricated conditions. At \(s=1\), the tangential force was approximately 75 N under dry conditions and 50 N with lubrication, whereas at \(s=3\), the difference became more pronounced, with values of 40 and 10 N, respectively. These reductions can be attributed to the moderate mechanical strength and high thermal conductivity of the tool material, which promote heat dissipation and reduce adhesion on the tool edge. In contrast, SUS304 exhibited a more gradual decrease in cutting forces, with higher residual values during the zero-cutting phase under dry conditions. An increase was observed after \(d=3\), where the tangential force increased from 75 to 125 N at \(d=4\) and remained at approximately 140 N throughout the zero-cutting phase. However, under lubricated conditions the forces gradually decreased from 60 N at \(s=1\) to 30 N at \(s=3\). These differences are associated with the low thermal conductivity and high strain hardening of SUS304, which lead to heat accumulation and stronger contact between the tool and the material, increasing the likelihood of adhesion and surface defects. Finally, the behaviors of Ti-6Al-4V, Alloy718, and C3604 (not shown in the figure) exhibited similar patterns. The high residual forces in Ti-6Al-4V and Alloy718 were related to their high mechanical strength and low thermal conductivity, whereas C3604, known for its excellent machinability and high thermal conductivity, exhibits a rapid decrease in cutting force, indicating a clean separation between the tool and the material.
3.2. Influence of Workpiece Material on Cutting Resistance After Stopping the Feed
Figure 9 depicts the influence of work material on cutting resistance after feed interruption, comparing Alloy718 and SCM435 steel. In Figs. 9(a) and (b), corresponding to Alloy718, the resistance forces (\(F_t\), \(F_n\)) remain approximately constant after deceleration. The tangential force stabilized at approximately 100 N, while the normal force remained near 150 N, indicating a stronger interaction between the tool and the work material in the normal direction. As indicated in Fig. 9(b), the mean values and their corresponding errors are calculated because the forces tended to oscillate within a limited range, owing to vibrations or irregularities. When calculating the force ratio (\(F_{t}/F_{n}\)), the trend remained approximately constant after the deceleration stage, with an average value close to \(F_{t}/F_{n}=0.65\).
For SCM435 steel, as indicated in Figs. 9(c) and (d), a progressive decrease in the resistance forces (\(F_t\), \(F_n\)) was observed from approximately 100 N at cut \(i=3\) to approximately 20 N at cut \(i=6\). For this material, the normal cutting forces were marginally weaker than the tangential forces. The force ratio (\(F_{t}/F_{n}\)) increased after the feed stopped, from \(F_{t}/F_{n}=1.1\) at \(i=3\) to \(F_{t}/F_{n}=1.5\) at \(i=6\). This behavior can be attributed to two factors. First, residual material is removed with each successive cut, gradually reducing the load on the tool. Second, the interruption of cutting significantly reduces heat generation, inducing a thermal imbalance at the tool–workpiece interface. This can modify the frictional conditions and stress distribution, thereby influencing the mechanical response during the subsequent cutting engagement. Both the resistance forces and their ratios varied depending on the work material used. In general, materials with higher mechanical strength exhibited a stable trend, while materials with lower strength and a higher tendency for adhesion exhibited a non-uniform trend during the zero-cutting state.
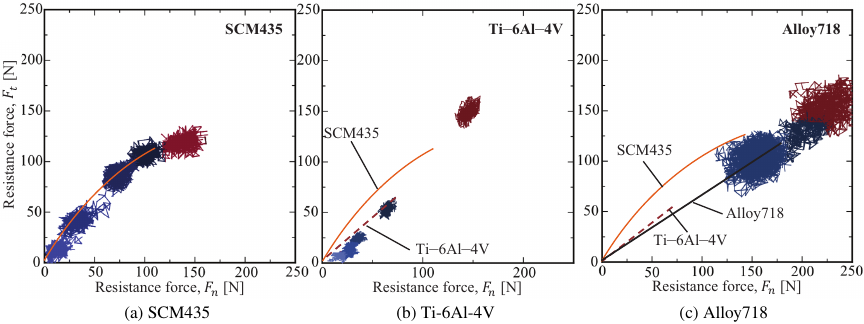
Fig. 11. Differences in the transition of \(F_t\)–\(F_n\) trajectory after stopping feed.
3.3. Differences in the Transition of \(F_t\)–\(F_n\) Trajectory After Stopping Feed Due to Work Material
Figure 11 depicts the relationship between the normal resistance force (\(F_n\)) and tangential resistance force (\(F_t\)). The forces corresponding to the deceleration state are displayed in different shades of blue, whereas data associated with the feed-stop condition are highlighted in red. The approximation of the experimental data illustrates the evolution of the resistance forces after interruption of the feed motion. It can be observed that the force trajectories vary significantly depending on the analyzed material. SCM435 steel (Fig. 11(a)) exhibited a nonlinear relationship between \(F_n\) and \(F_t\), in contrasting the approximately linear behaviors of Ti-6Al-4V (Fig. 11(b)) and Alloy718 (Fig. 11(c)). Both SCM435 and Alloy718 exhibited similar trends after the cutting process stopped, whereas Ti-6Al-4V exhibited higher force values. This can be attributed to the presence of residual material and the fact that at this stage, the tool still performs a small cutting interaction, temporarily increasing the cutting forces. Therefore, identifying and distinguishing between the different experimental states are important.
The nonlinearity observed in SCM435 may be attributed to a disproportionate distribution between the normal and tangential forces, possibly caused by the temperature decrease and residual stresses in the material. In contrast, Ti-6Al-4V and Alloy718 exhibited behavior closer to a linear trend, indicating greater stability and consistency in the evolution of forces during the cutting process.
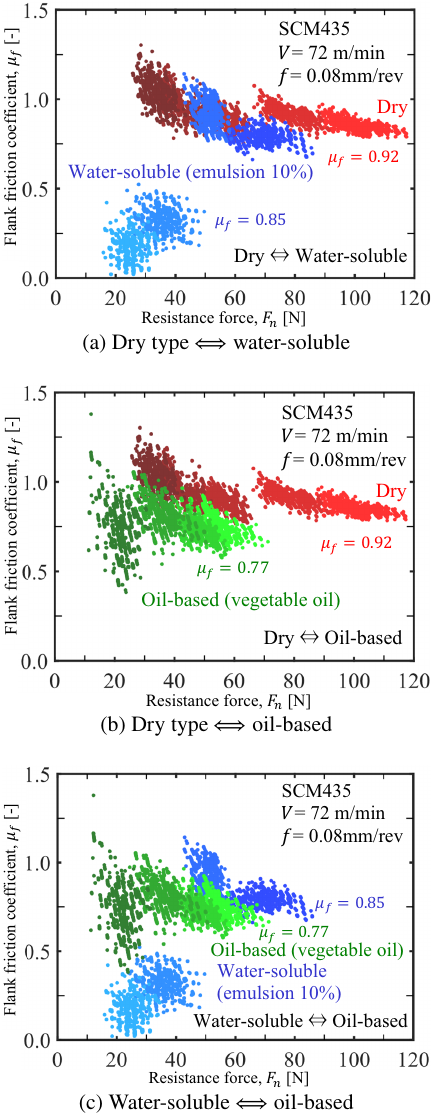
Fig. 12. Effect of lubrication method on the coefficient of friction at the flank face.
3.4. Effect of Lubrication Methods on the Flank Friction Coefficient
Figures 12 and 13 illustrate the influence of lubrication method on the flank friction coefficient (\(\mu_f\)) for SUS304 and SCM435, respectively. Each plot compares two types of environments as well as cuts following deceleration, represented by different shades corresponding to each atmosphere, allowing visualization of the evolution of \(\mu_f\) under varying lubrication conditions. In Fig. 12(a), \(\mu_f\) is highest for dry cutting and lowest for water-soluble lubrication during the first rotation after deceleration. In subsequent rotations, \(\mu_f\) for the emulsion increases, reaching values like dry cutting at a normal force of approximately 45 N, while below 40 N the emulsion reduces friction more effectively. As depicted in Fig. 12(b), vegetable oil lubrication provides smaller, more stable \(\mu_f\) values than dry cutting across most of the \(F_n\) range. A comparison between emulsion and vegetable oil in Fig. 12(c) indicates that the emulsion reduces friction more effectively under light loads, whereas vegetable oil performs slightly better under higher normal forces. For SUS304, Fig. 13(a) indicates a higher \(\mu_f\) under dry conditions, with friction remaining almost constant at a normal force of approximately 80 N. Fig. 13(b) compares dry and MQL lubrication, indicating that normal forces decrease when MQL is used, reaching values below 45 N, while \(\mu_f\) remains nearly constant across different loads. Fig. 13(c) compares water-soluble and oil-based lubrication with MQL, revealing a reduction in \(\mu_f\). For both materials, the friction reduction when comparing dry to MQL lubrication ranged between 16% and 24%, while reduction from dry to emulsion is between 8% and 13%. Additionally, SUS304 consistently exhibited higher friction coefficients than SCM435 under all evaluated conditions.
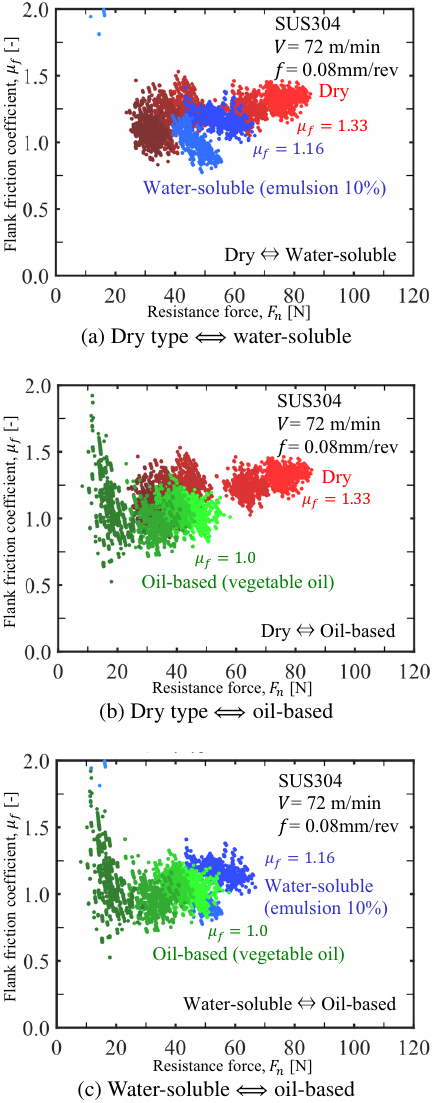
Fig. 13. Effect of lubrication method on the coefficient of friction at the flank face.
3.5. Ploughing Forces
Figure 14 shows the decomposition of cutting forces during the machining process, considering the effect of tool edge rounding. The cutting resistance offers two main contributions: forces associated with chip formation and ploughing forces. These forces can be vectorially decomposed into their normal (\(F_n\)) and tangential (\(F_t\)) components, allowing differentiation between the contributions from chip formation (\(F_t- F_{t\textrm{-}\mathit{pl}}\), \(F_n-F_{\mathit{n\textrm{-}pl}}\)) and edge rounding (\(F_{t\textrm{-}\mathit{pl}}\), \(F_{n\textrm{-}\mathit{pl}}\)). An accurate evaluation of these forces is essential for analyzing the friction coefficient at the flank face of the tool.
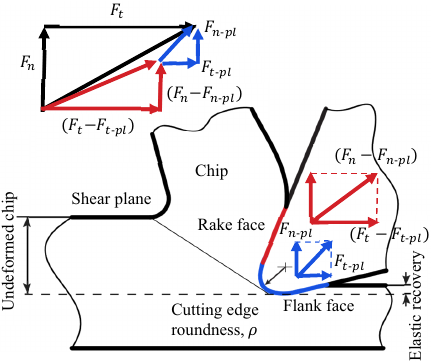
Fig. 14. Cutting resistance force components at the flank face of the tool.
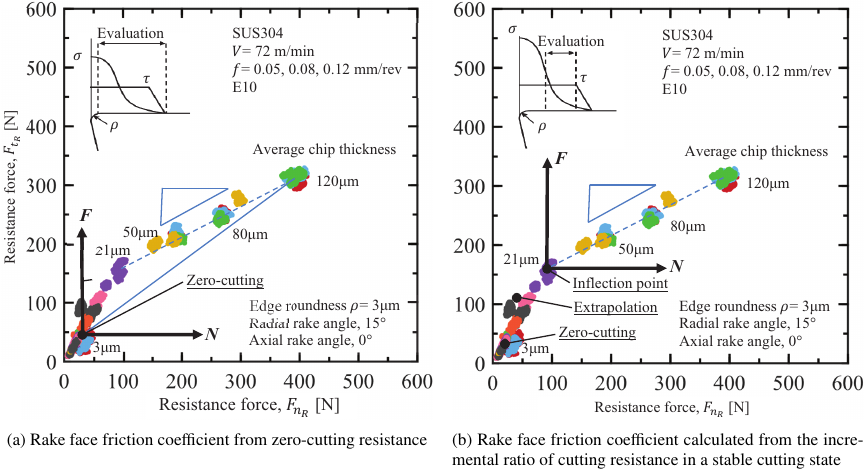
Fig. 15. Analysis of cutting stability, observed through the transition in the \(F_{t_R}\)–\(F_{n_R}\) distribution during the cutting process.
3.6. Method for Estimating the Ploughing Force
Figure 7(a) illustrates the evolution of cutting thickness as a function of time and, the progressive reduction in the maximum uncut chip thickness until transition to zero cutting. As shown in Fig. 7(b), the cutting resistance (\(F_t\), \(F_n\)) decreases with successive cuts until a threshold at which the cutting thickness becomes negligible, indicating the presence of ploughing forces is reached. To estimate this resistance, an approximation curve was obtained from the first zero cut and the resistances before and after it. The resistance value at the first zero cut was estimated. At this instant, the actual cutting depth was equal to the residual thickness left by the previous cut. The ploughing forces were estimated at these points because various studies have identified regions where ploughing and shearing forces are dominant. Various researchers have discovered that the existence of this region depended on the uncut chip thickness (\(h\)) and the edge roundness (\(\rho\)). They also determined that the critical threshold between the transition of both regions could be considered to obey the following relation: \(h_{\mathit{min}}=0.2\rho\) 21,22.
3.7. Consideration for Determining Inflection Points
Figure 15 analyzes the inflection points that indicate the transition to a stable cutting regime, using the calculated tangential (\(F_{t_R}\)) and normal (\(F_{n_R}\)) resistance forces acting on the tool rake face, obtained from Eqs. \(\eqref{eq:5}\) and \(\eqref{eq:6}\), where \(\alpha\) represents the rake angle.
In Fig. 15(a), the cutting forces corresponding to the minimum chip thickness (zero-cutting condition) are considered as inflection points for evaluating the friction coefficient on the rake face. This is because these forces act primarily along the tool-rake flank. However, the experimental results did not exhibit a continuous trend in the ratio (\(F_t/F_n\)), demonstrating that edge rounding influences the resistance forces even beyond the geometric region where the rounding is located. This instability can be explained by the fact that edge rounding modifies the local orientation of the rake face, thereby generating a more negative effective rake angle. Consequently, the chip is forced to slide more intensely along the rake face, distorting the relationship between the normal and tangential components of the contact force. Therefore, a constant or representative friction coefficient under the zero-cutting condition is not a valid assumption.
In Fig. 15(b), a new inflection point is proposed, at which the relationship between normal force \(F_{t_R}\) and tangential force \(F_{n_R}\) on the rake face stabilizes, indicating a transition toward a more stable cutting regime. The nearly constant slope observed between this point and the zero-cutting condition suggests the existence of an apparent friction coefficient associated with chip sliding on the rake face. Nevertheless, in this transition region, the effects of edge rounding, such as ploughing and adhesion, are still present; therefore, this coefficient does not represent a pure value of the shear angle friction. Therefore, the evaluation focused on the region where the uncut chip thickness exceeded the cutting-edge radius. As observed in the analysis, when the thickness reached approximately 6–7 times the edge radius, the ratio \(F_{t_R}/F_{n_R}\) exhibited a continuous linear trend. Physically, this condition implies that the cutting thickness is sufficiently large compared to the edge radius, such that the influence of edge rounding on the contact mechanics and local stress distribution becomes minimal. Below this threshold, the cutting process is dominated by elastoplastic deformation and frictional effects induced by edge rounding, which generate significant variations in the resistance forces. In this stable regime, the rate of increase between \(F_{t_R}\) and \(F_{n_R}\)is considered representative of the friction coefficient at the tool rake face. Although a threshold of approximately 6–7 times the edge radius was identified for the materials and tool geometries analyzed in this study, it is not intended as a universal constant. This limit may vary with factors such as the mechanical properties of the work material, tool edge radius, and lubrication conditions. Nevertheless, it provides a useful reference for identifying the onset of a stable cutting regime, in which the resistance forces no longer depend on the edge geometry, thereby enabling a more reliable estimation of the friction coefficient on the rake face.
Finally, the forces under zero-cutting conditions were estimated using the extrapolation method 19 by analyzing data beyond the inflection point. These estimated forces were generally higher than those obtained directly under zero-cutting conditions. In addition, the upper-left corners of Figs. 15(a) and (b) illustrate schematic of the variations in stress in the evaluated regimes.
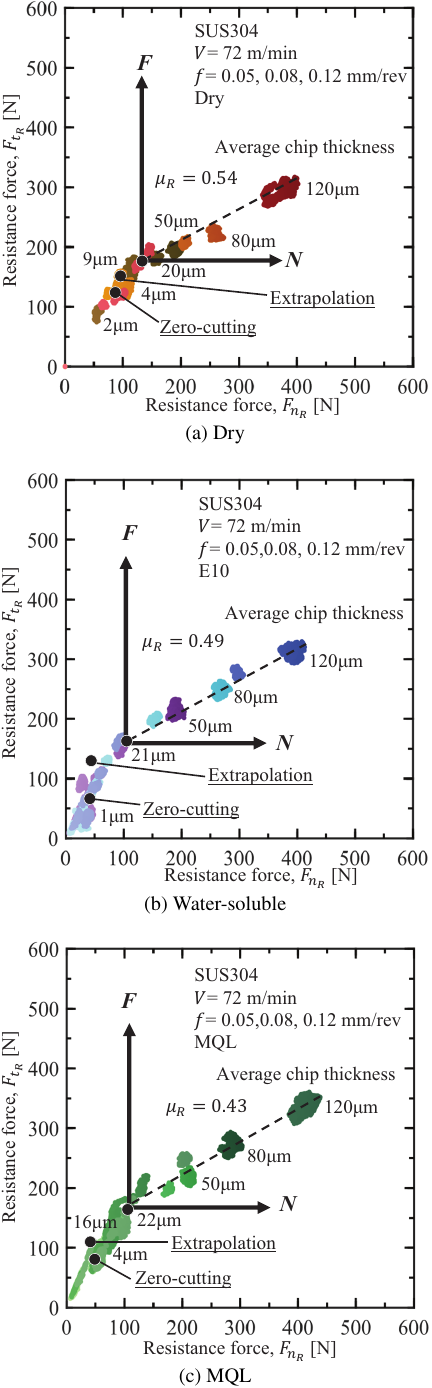
Fig. 16. Effect of lubrication methods on the coefficient of friction om the rake face.
3.8. Effect of Lubrication Method on the Friction Coefficient at the Rake Face
Figure 16 illustrates the relationship between the normal resistance force to the face (\(F_{n_R}\)) and the tangential resistance force to the rake face (\(F_{t_R}\)) under three lubrication conditions: dry cutting, 10% water-soluble oil, and vegetable oil. The lines in each graph represent a linear approximation of friction in the stable region of the tool-workpiece contact after the inflection point and were obtained using the least squares method. The slopes of these lines correspond to the apparent friction coefficient on the rake face (\(u_R\)), which varies depending on the cutting fluid: 0.54 for dry, 0.49 for emulsion, and 0.43 for vegetable oil. The lowest friction was observed when vegetable oil was used, suggesting that the higher lubricating capacity of the adsorbed layer contributed to friction reduction on the rake face. The friction coefficient decreased by 20.4% when comparing dry cutting to MQL with vegetable oil, which is consistent with the trends reported in other publications, where significant friction reduction was also observed under MQL compared with the trend under dry conditions 23.
4. Conclusion
This study presented a method based on the evaluation of cutting resistance during feed deceleration in an interrupted cutting process, enabling a more accurate characterization of the friction properties of the tool and its interaction with the workpiece material and cutting fluids. Building on this approach, a comprehensive methodology for evaluating friction under dynamic cutting conditions is proposed, providing a quantitative framework for understanding the interaction among the tool, workpiece material, and cutting fluid, including the transient effects during feed deceleration. These results offer valuable insights for optimizing cutting strategies, selecting suitable lubricants, and predicting tool wear, thereby contributing to improved process efficiency, reduced energy consumption, and extended tool life. The main results of this study are as follows:
-
(1)
The behavior of the tangential and normal forces and friction at the tool edge varied across each of the three states depending on the machined material. The coefficient of friction at the tool flank face was influenced by the different cutting fluids used, with the highest value observed under dry conditions, followed by water-soluble lubrication, whereas vegetable oil lubrication exhibited the lowest coefficient of friction.
-
(2)
To investigate the friction behavior on the tool rake face, the inflection point of the relationship \(F_{t_R}\)–\(F_{n_R}\) was identified to locate the transition to a more stable cutting regime, allowing the determination of the friction forces acting on the rake face. The friction force was strongly influenced by the lubrication method, with the lowest values observed when using vegetable oil under MQL conditions, and the highest values recorded during dry machining.
Acknowledgments
The authors would like to acknowledge Takatsugu Kumano and Ryoto Sugimori for their contributions to this research, particularly for their support in data analysis and execution of the experiments.
- [1] C. Hopkins, T. Clarke, N. Nguyen, N. Z. Yussefian, and A. Hosseini, “On modelling the cutting forces and impact resistance of honed milling tools,” Trans. of the Canadian Society for Mechanical Engineering, Vol.48, No.1, pp. 53-67, 2024. https://doi.org/10.1139/tcsme-2023-0066
- [2] R. Sakamoto et al., “Prediction of surface roughness components in turning with single point tool—Measurement of tool edge contour and prediction of its position during cutting—,” Int. J. Automation Technol., Vol.18, No.3, pp. 382-389, 2024. https://doi.org/10.20965/ijat.2024.p0382
- [3] V. F. C. Sousa et al., “Cutting forces assessment in CNC machining processes: A critical review,” Sensors, Vol.20, No.16, Article No.4536, 2020. https://doi.org/10.3390/s20164536
- [4] H. Puls, F. Klocke, and D. Lung, “A new experimental methodology to analyse the friction behaviour at the tool-chip interface in metal cutting,” Production Engineering, Vol.6, Nos.4-5, pp. 349-354, 2012. https://doi.org/10.1007/s11740-012-0386-6
- [5] R. S. Marano and D. J. Smolenski, “Cutting fluids for machining,” K. H. J. Buschow et al. (Eds.), “Encyclopedia of Materials: Science and Technology,” pp. 1934-1940, Elsevier, 2001. https://doi.org/10.1016/B0-08-043152-6/00352-1
- [6] A. Abdelbary and L. Chang, “Lubricants and their properties,” A. Abdelbary and L. Chang, “Principles of Engineering Tribology: Fundamentals and Applications,” pp. 345-389, Elsevier, 2023. https://doi.org/10.1016/B978-0-323-99115-5.00003-7
- [7] A. M. Tortora and D. H. Veeregowda, “True stability of lubricants determined using the ball-on-disk test,” Advances in Tribology, Vol.2016, Article No.4020537, 2016. https://doi.org/10.1155/2016/4020537
- [8] F. Zemzemi, J. Rech, W. Ben Salem, A. Dogui, and P. Kapsa, “Identification of a friction model at tool/chip/workpiece interfaces in dry machining of AISI4142 treated steels,” J. of Materials Processing Technology, Vol.209, No.8, pp. 3978-3990, 2009. https://doi.org/10.1016/j.jmatprotec.2008.09.019
- [9] W. Grzesik, Z. Zalisz, and P. Nieslony, “Friction and wear testing of multilayer coatings on carbide substrates for dry machining applications,” Surface and Coatings Technology, Vol.155, No.1, pp. 37-45, 2002. https://doi.org/10.1016/S0257-8972(02)00040-3
- [10] P. Hedenqvist and M. Olsson, “Sliding wear testing of coated cutting tool materials,” Tribology Int., Vol.24, No.3, pp. 143-150, 1991. https://doi.org/10.1016/0301-679X(91)90020-A
- [11] J. Rech et al., “Characterisation of friction and heat partition coefficients at the tool-work material interface in cutting,” CIRP Annals, Vol.62, No.1, pp. 79-82, 2013. https://doi.org/10.1016/j.cirp.2013.03.099
- [12] H. Puls, F. Klocke, and D. Lung, “Experimental investigation on friction under metal cutting conditions,” Wear, Vol.310, Nos.1-2, pp. 63-71, 2014. https://doi.org/10.1016/j.wear.2013.12.020
- [13] R. Sekhar and P. Shah, “Investigating shearing, ploughing, and particle fracture forces in turning of low percent reinforcement Al/B4C metal matrix composites,” Revue des Composites et des Matériaux Avancés, Vol.33, No.5, pp. 283-291, 2023. https://doi.org/10.18280/rcma.330502
- [14] M. H. M. Dib, J. G. Duduch, and R. G. Jasinevicius, “Minimum chip thickness determination by means of cutting force signal in micro endmilling,” Precision Engineering, Vol.51, pp. 244-262, 2018. https://doi.org/10.1016/j.precisioneng.2017.08.016
- [15] C.-J. Lin et al., “Prediction of shearing and ploughing constants in milling of Inconel 718,” J. of Manufacturing and Materials Processing, Vol.5, No.1, Article No.8, 2021. https://doi.org/10.3390/jmmp5010008
- [16] A. C. Ramos et al., “Characterization of the transition from ploughing to cutting in micro machining and evaluation of the minimum thickness of cut,” J. of Materials Processing Technology, Vol.212, No.3, pp. 594-600, 2012. https://doi.org/10.1016/j.jmatprotec.2011.07.007
- [17] C.-F. Wyen and K. Wegener, “Influence of cutting edge radius on cutting forces in machining titanium,” CIRP Annals, Vol.59, No.1, pp. 93-96, 2010. https://doi.org/10.1016/j.cirp.2010.03.056
- [18] X. Wu et al., “Investigation on the ploughing force in microcutting considering the cutting edge radius,” The Int. J. of Advanced Manufacturing Technology, Vol.86, Nos.9-12, pp. 2441-2447, 2016. https://doi.org/10.1007/s00170-016-8386-x
- [19] A. Popov and A. Dugin, “A comparison of experimental estimation methods of the ploughing force in orthogonal cutting,” Int. J. of Machine Tools and Manufacture, Vol.65, pp. 37-40, 2013. https://doi.org/10.1016/j.ijmachtools.2012.09.003
- [20] S. Tanaka, R. Tanaka, K. Sekiya, and K. Yamada, “Study on cutting forces in zero-cutting after complete stop of feed motion when face milling of alloy 718,” Int. J. of Abrasive Technology, Vol.11, No.3, pp. 175-183, 2023. https://doi.org/10.1504/IJAT.2023.10052374
- [21] P. Sahoo, K. Patra, T. Szalay, and A. A. Dyakonov, “Determination of minimum uncut chip thickness and size effects in micro-milling of P-20 die steel using surface quality and process signal parameters,” The Int. J. of Advanced Manufacturing Technology, Vol.106, Nos.11-12, pp. 4675-4691, 2020. https://doi.org/10.1007/s00170-020-04926-6
- [22] S. Wojciechowski, “Estimation of minimum uncut chip thickness during precision and micro-machining processes of various materials—A critical review,” Materials, Vol.15, No.1, Article No.59, 2022. https://doi.org/10.3390/ma15010059
- [23] S. Werda, A. Duchosal, G. Le Quilliec, A. Morandeau, and R. Leroy, “Minimum quantity lubrication advantages when applied to insert flank face in milling,” The Int. J. of Advanced Manufacturing Technology, Vol.92, Nos.5-8, pp. 2391-2399, 2017. https://doi.org/10.1007/s00170-017-0317-y
This article is published under a Creative Commons Attribution-NoDerivatives 4.0 Internationa License.